Using Plants to Improve Flood Management - Floodplain Management
Using Plants to Improve Flood Management - Floodplain Management
Using Plants to Improve Flood Management - Floodplain Management

Create successful ePaper yourself
Turn your PDF publications into a flip-book with our unique Google optimized e-Paper software.
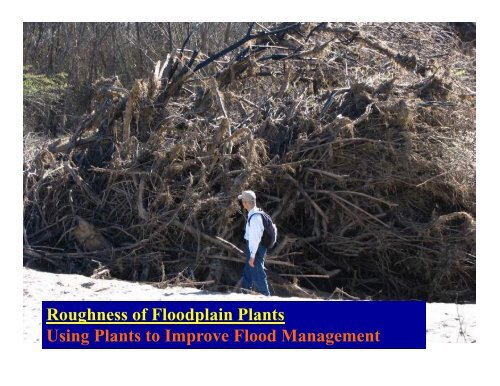
Roughness of <strong>Flood</strong>plain <strong>Plants</strong><br />
<strong>Using</strong> <strong>Plants</strong> <strong>to</strong> <strong>Improve</strong> <strong>Flood</strong> <strong>Management</strong>
What is Roughness<br />
Texture<br />
Friction<br />
Blockage<br />
Resistance <strong>to</strong><br />
flow
<strong>Plants</strong> have roughness
So do the<br />
Things we<br />
Put in channels
We measure roughness using Mannings n –<br />
a number used in a whole bunch of hydraulic<br />
analyses<br />
R= hydraulic radius<br />
S f = friction slope<br />
V = water velocity<br />
n=(1/v)R 2/3 S 1/2<br />
f
Manning's n Coefficients for Open Channel Flow<br />
The fluid mechanics calculations website<br />
Manning n has no units.<br />
Material Manning n Material Manning n<br />
Natural Streams<br />
Excavated Earth Channels<br />
Clean and Straight 0.030 Clean 0.022<br />
Major Rivers 0.035 Gravelly 0.025<br />
Sluggish with Deep Pools 0.040 Weedy 0.030<br />
S<strong>to</strong>ny, Cobbles 0.035<br />
Metals<br />
<strong>Flood</strong>plains<br />
Brass 0.011 Pasture, Farmland 0.035<br />
Cast Iron 0.013 Light Brush 0.050<br />
Smooth Steel 0.012 Heavy Brush 0.075<br />
Corrugated Metal 0.022 Trees 0.15<br />
Non-Metals<br />
Glass 0.010 Finished Concrete 0.012<br />
Clay Tile 0.014 Unfinished Concrete 0.014<br />
Brickwork 0.015 Gravel 0.029<br />
Asphalt 0.016 Earth 0.025<br />
Masonry 0.025 Planed Wood 0.012<br />
Unplaned Wood 0.013
Type of Channel and Description<br />
Minimum Normal Maximum<br />
Natural streams - minor streams (<strong>to</strong>p width at floodstage < 100 ft)<br />
1. Main Channels<br />
a. clean, straight, full stage, no rifts or deep pools<br />
b. same as above, but more s<strong>to</strong>nes and weeds<br />
c. clean, winding, some pools and shoals<br />
d. same as above, but some weeds and s<strong>to</strong>nes<br />
0.025 0.030 0.033<br />
0.030 0.035 0.040<br />
0.033 0.040 0.045<br />
0.035 0.045 0.050<br />
e. same as above, lower stages, more ineffective<br />
slopes and sections<br />
0.040 0.048 0.055<br />
f. same as "d" with more s<strong>to</strong>nes 0.045 0.050 0.060<br />
g. sluggish reaches, weedy, deep pools 0.050 0.070 0.080<br />
h. very weedy reaches, deep pools, or floodways<br />
with heavy stand of timber and underbrush<br />
0.075 0.100 0.150<br />
2. Mountain streams, no vegetation in channel, banks usually steep, trees and brush<br />
along banks submerged at high stages<br />
a. bot<strong>to</strong>m: gravels, cobbles, and few boulders 0.030 0.040 0.050<br />
b bot<strong>to</strong>m: cobbles with large boulders<br />
0.040 0.050 0.070
Mannings n – average of all textures,<br />
but used as a model fitting parameter.<br />
Inaccuracy in other model parameters:<br />
Shape, channel form, grade, slope,<br />
sinuosity, velocity, water density, …<br />
get assigned <strong>to</strong> roughness
O’Connor Lakes, Star Bend<br />
Lots of variation:<br />
∆ velocity = ∆ roughness<br />
Pre‐project velocities
The need for improving safety and<br />
ecosystem management prompted us<br />
<strong>to</strong> look at the role some common<br />
plants play in creating roughness.<br />
<strong>Plants</strong> selected because they are adapted <strong>to</strong><br />
flooding, are common in our floodways, and<br />
provide good habitat value
Mulefat<br />
Wild Rose<br />
Sandbar willow<br />
California Blackberry
x= 47'<br />
x=33'<br />
x=19'<br />
Flume<br />
tail tank<br />
H<br />
V<br />
6’<br />
Depth<br />
Control<br />
Weir<br />
x =60'<br />
C<br />
B<br />
A<br />
2’<br />
x =0'<br />
Pumps<br />
Point gage locations<br />
and<br />
velocity measurement sections
Velocity measurement locations in a cross-section<br />
Flume width 5 ft<br />
Flume width 5 ft<br />
8 ft<br />
6 ft<br />
8 ft<br />
6 ft<br />
2 ft<br />
2 ft<br />
4 ft bin Width<br />
4 ft bin Width<br />
Water depth<br />
higher than 2 ft<br />
Water depth<br />
lower than 2 ft
Velocity and Water Surface Profiles<br />
V Scale X 19.5 33.5 47<br />
2 Z 2.65 2.54 2.56<br />
2.17 4.39 4.69 4.86<br />
1.67 4.18 4.56 4.64<br />
V (ft/s) 1.17 4.11 4.42 4.44<br />
0.67 4.00 4.20 4.03<br />
0.25 3.62 3.47 3.36<br />
8.00<br />
7.00<br />
6.00<br />
Flow Regime S15<br />
Elevation [ft]<br />
5.00<br />
4.00<br />
3.00<br />
2.00<br />
1.00<br />
V= 2 ft/s<br />
0.00<br />
0 10 20 30 40 50 60 70<br />
X [ft]<br />
Water Surface Flume Top Elevation Bot<strong>to</strong>m Elevation<br />
Velocity at P#2 Velocity at P#3 Velocity at P#4
STREAMBED BARE<br />
SOIL SAMPLE<br />
PREPARATION
Sandbar Willow<br />
1 st replicate
Sandbar Willow<br />
3 rd replicate
Velocity Profile Sandbar Willow<br />
5<br />
4<br />
V=1.5 ft/s H=1.5 ft<br />
5<br />
V|x=16ft<br />
V|x=34ft<br />
V|x=47ft 4<br />
V=3.0 ft/s H=1.5 ft<br />
V|x=16ft<br />
V|x=34ft<br />
V|x=47ft<br />
3<br />
3<br />
Z(ft)<br />
Z(ft)<br />
2<br />
2<br />
1<br />
1<br />
0<br />
0 2 4 6<br />
Velocity (ft/s)<br />
0<br />
0 2 4 6<br />
Velocity (ft/s)
Velocity Profile Sandbar Willow<br />
5<br />
4<br />
V=1.5 ft/s H=5 ft<br />
5<br />
V|x=16ft<br />
V|x=34ft<br />
V|x=47ft 4<br />
V=3.0 ft/s H=5 ft<br />
V|x=16ft<br />
V|x=34ft<br />
V|x=47ft<br />
3<br />
3<br />
Z(ft)<br />
Z(ft)<br />
2<br />
2<br />
1<br />
1<br />
0<br />
0 2 4 6<br />
Velocity (ft/s)<br />
0<br />
0 2 4 6<br />
Velocity (ft/s)
Velocity Profile Sandbar Willow<br />
5<br />
4<br />
V=4.5 ft/s H=3 ft<br />
5<br />
V|x=16ft<br />
V|x=34ft<br />
V|x=47ft 4<br />
V=6.0 ft/s H=3 ft<br />
V|x=16ft<br />
V|x=34ft<br />
V|x=47ft<br />
3<br />
3<br />
Z(ft)<br />
Z(ft)<br />
2<br />
2<br />
1<br />
1<br />
0<br />
0 2 4 6<br />
Velocity (ft/s)<br />
0<br />
0 2 4 6<br />
Velocity (ft/s)
Roughness Coefficient vs Reynolds Number<br />
Sandbar Willow<br />
ng's n<br />
Manni<br />
0.09<br />
0.08<br />
0.07<br />
0.06<br />
0.05<br />
0.04<br />
0.03<br />
0.02<br />
0.01<br />
0.00<br />
0 200,000 400,000 600,000<br />
Bare Soil<br />
Willow1<br />
Willow2<br />
Willow3<br />
Linear (Bare Soil)<br />
Linear (Willow1)<br />
Linear (Willow2)<br />
Linear (Willow3)<br />
Re
Velocity Profile Mulefat<br />
V=4.5 ft/s H=3ft<br />
V=6 ft/s H=3 ft<br />
5<br />
4<br />
V|x=16ft<br />
V|x=34ft<br />
V|x=47ft<br />
5<br />
4<br />
V|x=16ft<br />
V|x=34ft<br />
V|x=47ft<br />
Depth<br />
(ft)<br />
3<br />
2<br />
Depth<br />
(ft)<br />
3<br />
2<br />
1<br />
1<br />
0<br />
0 2 4 6<br />
Velocity (ft/s)<br />
0<br />
0 5 10<br />
Velocity (ft/s)
Comparative Roughness: Mulefat & Sandbar Willow<br />
Man ning's n<br />
0.12<br />
0.10<br />
0.08<br />
0.06<br />
Bare Soil<br />
Willow (March)<br />
Willow (April)<br />
Willow (May)<br />
Mule Fat (Nov-Dec)<br />
Mule Fat (Oct-Nov)<br />
Linear (Bare Soil)<br />
Linear (Willow (March))<br />
Linear (Willow (April))<br />
Linear (Willow (May))<br />
Linear (Mule Fat (Nov-Dec))<br />
Linear (Mule Fat (Oct-Nov) )<br />
0.04<br />
0.02<br />
0.00<br />
0 100,000 200,000 300,000 400,000 500,000 600,000 700,000<br />
Re
Velocity Profile California Blackberry<br />
V=3 ft/s Ht=5ft<br />
V=6 ft/s Ht=3.4ft<br />
6<br />
5<br />
V|x=16ft<br />
V|x=34ft<br />
V|x=47ft<br />
6<br />
5<br />
V|x=16ft<br />
V|x=34ft<br />
V|x=47ft<br />
4<br />
4<br />
Height<br />
(ft)<br />
3<br />
Heigh ht (ft)<br />
3<br />
2<br />
2<br />
1<br />
1<br />
0<br />
0.0 2.0 4.0 6.0<br />
Velocity (ft/s)<br />
0<br />
0.0 2.0 4.0 6.0<br />
Velocity (ft/s)
Roughness coefficients vs Reynolds Number<br />
California Blackberry<br />
Mannin ng's n<br />
0.16<br />
0.14<br />
0.12<br />
0.10<br />
008 0.08<br />
0.06<br />
Blackberry(Mar)<br />
Blackberry(Apr)<br />
Blackberry(May)<br />
Willow (March)<br />
Willow (April)<br />
Willow (May)<br />
Mule Fat (Oct-Nov)<br />
Mule Fat (Nov-Dec)<br />
Mule Fat (January)<br />
Mule Fat (February)<br />
Bare Soil<br />
Linear (Blackberry(Mar))<br />
Linear (Blackberry(Apr))<br />
Linear (Blackberry(May))<br />
0.04<br />
0.02<br />
0.00<br />
0 100,000 200,000 300,000 400,000 500,000 600,000 700,000<br />
Re
Velocity profile Wildrose<br />
V=4.5ft/s H=3ft<br />
V=6ft/s H=3.4ft<br />
6<br />
5<br />
V|x=16ft<br />
V|x=34ft<br />
V|x=47ft<br />
6<br />
5<br />
V|x=16ft<br />
V|x=34ft<br />
V|x=47ft<br />
depth (ft)<br />
Water<br />
4<br />
3<br />
2<br />
Water<br />
depth (ft)<br />
4<br />
3<br />
2<br />
1<br />
1<br />
0<br />
0 2 4 6 8<br />
Velocity (ft/s)<br />
0<br />
0 2 4 6 8<br />
Velocity (ft/s)
Mannings Coefficient vs Reynolds Number<br />
Rose and Blackberry<br />
Manning's<br />
n<br />
0.16<br />
0.14<br />
0.12<br />
0.10<br />
0.08<br />
Blackberry(Mar)<br />
Blackberry(Apr)<br />
Blackberry(May)<br />
Willow (March)<br />
Willow (April)<br />
Willow (May)<br />
Mule Fat (Oct-Nov)<br />
Mule Fat (Nov-Dec)<br />
Mule Fat (January)<br />
Mule Fat (February)<br />
Bare Soil<br />
Wildrose#1(Jun)<br />
Wildrose#2(Jun)<br />
Wildrose#3(Jul)<br />
Linear (Blackberry(Mar))<br />
Linear (Blackberry(Apr))<br />
Linear (Blackberry(May))<br />
Linear (Wildrose#1(Jun))<br />
Linear (Wildrose#2(Jun))<br />
Linear (Wildrose#3(Jul))<br />
0.06<br />
0.04<br />
0.02<br />
0.00<br />
0 100,000 200,000 300,000 400,000 500,000 600,000 700,000<br />
Re
Erosion Summary<br />
Erosion (in)<br />
3<br />
Bare soil<br />
2<br />
mulefat<br />
1<br />
rose<br />
willow<br />
1<br />
3 5<br />
Velocity (ft/sec)
Swim Response <strong>to</strong> Sandbar Willow<br />
○ = TBF Swim Chamber<br />
● = MO 2<br />
■ =TBF Flume<br />
(1.5 ft/s)<br />
(3.0 ft/s)<br />
(0.5 ft/s)
A Mosaic of <strong>Plants</strong><br />
As built – velocity