

Victorian Intertidal Reef Monitoring Program - Parks Victoria
Victorian Intertidal Reef Monitoring Program - Parks Victoria
Victorian Intertidal Reef Monitoring Program - Parks Victoria

Create successful ePaper yourself
Turn your PDF publications into a flip-book with our unique Google optimized e-Paper software.
parks victoria technical series<br />
Number 70<br />
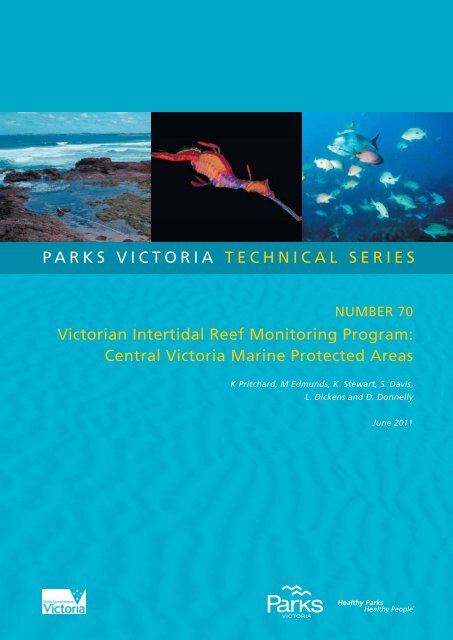
<strong><strong>Victoria</strong>n</strong> <strong>Intertidal</strong> <strong>Reef</strong> <strong>Monitoring</strong> <strong>Program</strong>:<br />
Central <strong>Victoria</strong> Marine Protected Areas<br />
K Pritchard, M Edmunds, K. Stewart, S. Davis,<br />
L. Dickens and D. Donnelly<br />
June 2011
© <strong>Parks</strong> <strong>Victoria</strong><br />
All rights reserved. This document is subject to the Copyright Act 1968, no part of this<br />
publication may be reproduced, stored in a retrieval system, or transmitted in any form, or by any<br />
means, electronic, mechanical, photocopying or otherwise without the prior permission of the<br />
publisher.<br />
First published 2011<br />
Published by <strong>Parks</strong> <strong>Victoria</strong><br />
Level 10, 535 Bourke Street, Melbourne <strong>Victoria</strong> 3000<br />
Opinions expressed by the Authors of this publication are not necessarily those of <strong>Parks</strong> <strong>Victoria</strong>,<br />
unless expressly stated. <strong>Parks</strong> <strong>Victoria</strong> and all persons involved in the preparation and distribution<br />
of this publication do not accept any responsibility for the accuracy of any of the opinions or<br />
information contained in the publication.<br />
Authors:<br />
Katharine Pritchard – Marine Ecologist, Australian Marine Ecology Pty Ltd<br />
Matt Edmunds – Principal Ecologist, Australian Marine Ecology Pty Ltd<br />
Kim Stewart – Marine Ecologist, Australian Marine Ecology Pty Ltd<br />
Shaun Davis – Marine Ecologist, Australian Marine Ecology Pty Ltd<br />
Luke Dickens – Marine Ecologist, Australian Marine Ecology Pty Ltd<br />
David Donnelly – Marine Ecologist, Australian Marine Ecology Pty Ltd<br />
National Library of Australia<br />
Cataloguing-in-publication data<br />
Includes bibliography<br />
ISSN 1448-4935<br />
Citation<br />
Pritchard K, Edmunds M, Stewart K, Davis S, Dickens L and Donnelly D (2011) <strong><strong>Victoria</strong>n</strong> intertidal<br />
reef monitoring program: the intertidal reef biota of central <strong>Victoria</strong>’s marine protected areas.<br />
<strong>Parks</strong> <strong>Victoria</strong> Technical Series No. 70. <strong>Parks</strong> <strong>Victoria</strong>, Melbourne.<br />
Printed on environmentally friendly paper
<strong>Parks</strong> <strong>Victoria</strong> Technical Paper Series No. 70<br />
<strong><strong>Victoria</strong>n</strong> <strong>Intertidal</strong> <strong>Reef</strong> <strong>Monitoring</strong><br />
<strong>Program</strong>:<br />
<strong>Victoria</strong> Marine Protected Areas<br />
Katharine Pritchard<br />
Matt Edmunds<br />
Kim Stewart<br />
Shaun Davis<br />
Luke Dickens<br />
David Donnelly<br />
Australian Marine Ecology<br />
June 2011
<strong>Parks</strong> <strong>Victoria</strong> Technical Series No. 70<br />
<strong>Intertidal</strong> <strong>Reef</strong> <strong>Monitoring</strong> <strong>Program</strong><br />
EXECUTIVE SUMMARY<br />
<strong>Intertidal</strong> reefs are present on headlands and points throughout <strong>Victoria</strong>, providing a variety<br />
of different habitats between the marine and terrestrial environments. <strong>Intertidal</strong> reefs have<br />
important social and cultural values and, because of their accessibility and proximity to land,<br />
are subject to human pressures including collection, trampling and pollution. To effectively<br />
manage and conserve these habitats, the <strong><strong>Victoria</strong>n</strong> Government has established a long-term<br />
<strong>Intertidal</strong> <strong>Reef</strong> <strong>Monitoring</strong> <strong>Program</strong> (IRMP). The IRMP provides information on the status of<br />
<strong><strong>Victoria</strong>n</strong> intertidal reef flora and fauna, as well as the nature and magnitude of trends in<br />
species populations and species diversity through time.<br />
Within the <strong><strong>Victoria</strong>n</strong> Embayments bioregion, intertidal survey sites were established on reefs<br />
in the northern Port Phillip Bay marine sanctuaries at Point Cooke, Jawbone and Ricketts<br />
Point. Reference sites were also surveyed in association with each of these sanctuaries.<br />
Along the Central <strong><strong>Victoria</strong>n</strong> bioregion, intertidal survey sites were established at Point Addis,<br />
Port Phillip Heads and Bunurong Marine National <strong>Parks</strong> and Point Danger, Barwon Bluff and<br />
Mushroom <strong>Reef</strong> Marine Sanctuaries. Reference sites were also surveyed in association with<br />
each of these locations.<br />
The IRMP uses standardised visual census methods for surveying invertebrates and<br />
macroalgae on intertidal reefs. The standard operating procedures were modified in<br />
consultation with <strong>Parks</strong> <strong>Victoria</strong> after the first survey of reefs in 2003. The northern Port<br />
Phillip Bay sites and the Mushroom <strong>Reef</strong> Marine Sanctuary were resurveyed in 2004 using<br />
the revised standard operating procedures. All monitoring sites were resurveyed in the<br />
summer of 2004/2005. In addition, 4 new sites were established and surveyed inside and<br />
outside Bunurong Marine National Park (Eagles Nest) and Port Phillip Heads Marine<br />
National Park (Point Lonsdale). Another survey of the sites along the open coast (i.e.<br />
excluding those in Port Phillip Bay) was done in summer 2005/2006. All sites were surveyed<br />
in autumn 2007, autumn to early winter in 2009 and again in autumn 2010.<br />
The objectives of this report were to:<br />
1. provide an overview of the methods used for the IRMP;<br />
2. provide general descriptions of the biological communities and species populations at<br />
each monitoring site;<br />
3. describe changes and trends that have occurred over the monitoring period;<br />
4. identify any unusual biological phenomena, interesting or unique communities or<br />
species; and<br />
5. identify any introduced species at the monitoring locations.<br />
Surveys occur at a single reef during a single low tide and target the predominant substratum<br />
type. Five fixed transects, each running from high to low shore, are positioned at equal<br />
II
<strong>Parks</strong> <strong>Victoria</strong> Technical Series No. 70<br />
<strong>Intertidal</strong> <strong>Reef</strong> <strong>Monitoring</strong> <strong>Program</strong><br />
distance across the intertidal area to be surveyed, which is 30-100 m in length. Surveys of<br />
biota occur in quadrats at sample locations along each transect and are surveyed for: (1) the<br />
density of non-sessile invertebrates; and (2) the percentage cover of macroalgae and<br />
aggregated sessile invertebrates.<br />
There were considerable differences in the intertidal flora and fauna between the Port Phillip<br />
Bay and the open coast sites. The open coast sites had greater species richness and<br />
diversity, along with a much higher cover of the alga Hormosira banksii and higher<br />
abundances of the snail Austrocochlea constricta, and the limpet Siphonaria spp.<br />
Point Cooke MS<br />
Point Cooke MS is situated in Port Phillip Bay. Key observations made at Point Cooke MS<br />
and reference Altona site during the monitoring program are:<br />
Total algal cover has been low and relatively stable at both sites over the past three<br />
years.<br />
An originally small patch of the seagrass Zostera muelleri continued to increase in 2010.<br />
Jawbone MS<br />
Jawbone MS is situated in Port Phillip Bay. Key observations made at Jawbone MS and<br />
reference Williamstown site during the monitoring program are:<br />
Species richness and diversity levels were among the highest recorded in 2010.<br />
An increase in brown alga Hormosira banksii increased the total algal cover considerable<br />
during the 2010 survey.<br />
Ricketts MS<br />
Ricketts Point MS is situated in Port Phillip Bay. Key observations made at Ricketts Point MS<br />
and reference Half Moon Bay site during the monitoring program are:<br />
Species richness and diversity levels were among the highest recorded in 2010,<br />
excepting species richness of mobile invertebrate at Halfmoon Bay (which was the lowest<br />
recorded).<br />
Total algal cover has generally increased at both sites from 2005 to 2010.<br />
Port Phillip Heads MNP<br />
Key observations made at Port Phillip Heads MNP and reference Cheviot Bay site during the<br />
monitoring program are:<br />
Algal species richness was low at both sites over the survey period.<br />
Total algae cover increased at both sites in 2010 after slight but steady declines since<br />
December 2004.<br />
III
<strong>Parks</strong> <strong>Victoria</strong> Technical Series No. 70<br />
<strong>Intertidal</strong> <strong>Reef</strong> <strong>Monitoring</strong> <strong>Program</strong><br />
Mushroom <strong>Reef</strong> MS<br />
Key observations made at Mushroom <strong>Reef</strong> MS and reference West Flinders site during the<br />
monitoring program are:<br />
Species diversity levels had decreased during 2010 for both mobile invertebrate and algal<br />
and sessile invertebrates.<br />
Bunurong MNP<br />
Observations from 2010 were within the limits of previous surveys. There were no key<br />
changes at this site.<br />
Point Addis MNP<br />
Key observations made at Point Addis MNP and reference Winkipop site during the<br />
monitoring program are:<br />
Invertebrate species diversity was at the lowest level recorded at the Winkipop reference<br />
site.<br />
Algal and sessile invertebrate species diversity was at its highest recorded level at Point<br />
Addis.<br />
Total algal cover decreased at both sites from 2009 to 2010.<br />
Point Danger MS<br />
Key observations made at Point Danger MS and reference Point Danger West site during the<br />
monitoring program are:<br />
Mobile invertebrate species richness had increased in 2010 to the highest level recorded.<br />
At Point Danger MS the total algae cover continued to steadily increase from 2005 to<br />
2010.<br />
Barwon Bluff MS<br />
Key observations made at Barwon Bluff MS and reference Barwon Beach site during the<br />
monitoring program are:<br />
Total algal cover increased at both site from 2009 to 2010 and is high compared to<br />
previous observations.<br />
IV
<strong>Parks</strong> <strong>Victoria</strong> Technical Series No. 70<br />
<strong>Intertidal</strong> <strong>Reef</strong> <strong>Monitoring</strong> <strong>Program</strong><br />
CONTENTS<br />
Executive summary ............................................................................................................. II<br />
Contents............................................................................................................................... V<br />
Index of figures and tables ............................................................................................... VII<br />
1 Introduction ..................................................................................................................I1<br />
1.1 INTERTIDAL REEF ECOSYSTEMS ....................................................................................I1<br />
1.2 INTERTIDAL REEF MONITORING PROGRAM ..................................................................I2<br />
2 Methods ........................................................................................................................ 1<br />
2.1 SITE SELECTION AND SURVEY TIMES ............................................................................. 1<br />
2.2 VISUAL CENSUS TECHNIQUES ........................................................................................10<br />
2.3 DATA ANALYSIS .................................................................................................................15<br />
2.4 CONDITION INDICATORS ..................................................................................................16<br />
3 Point Cooke Marine Sanctuary ...................................................................................19<br />
3.1 SITE DESCRIPTION AND TRANSECT LAYOUT ...............................................................19<br />
3.2 COMMUNITY STRUCTURE ................................................................................................22<br />
3.3 DIVERSITY ..........................................................................................................................24<br />
3.4 MACROALGAE AND AGGREGATING SESSILE INVERTEBRATES ................................27<br />
3.5 MOBILE INVERTEBRATES.................................................................................................28<br />
3.6 CONDITION INDICATORS ..................................................................................................31<br />
4 Jawbone Marine Sanctuary ........................................................................................36<br />
4.1 SITE DESCRIPTION AND TRANSECT LAYOUT ...............................................................36<br />
4.2 COMMUNITY STRUCTURE ................................................................................................38<br />
4.3 DIVERSITY ..........................................................................................................................38<br />
4.4 MACROALGAE AND AGGREGATING SESSILE INVERTEBRATES ................................42<br />
4.5 MOBILE INVERTEBRATES.................................................................................................43<br />
4.6 CONDITION INDICATORS ..................................................................................................46<br />
5 Ricketts Point Marine Sanctuary ................................................................................51<br />
5.1 SITE DESCRIPTION AND TRANSECT LAYOUT ...............................................................51<br />
5.2 COMMUNITY STRUCTURE ................................................................................................53<br />
5.3 DIVERSITY ..........................................................................................................................53<br />
5.4 MACROALGAE AND AGGREGATING SESSILE INVERTEBRATES ................................57<br />
5.5 MOBILE INVERTEBRATES.................................................................................................58<br />
5.6 CONDITION INDICATORS ..................................................................................................60<br />
6 Port Phillip Heads Marine National Park ....................................................................65<br />
6.1 SITE DESCRIPTION AND TRANSECT LAYOUT ...............................................................65<br />
6.2 COMMUNITY STRUCTURE ................................................................................................67<br />
6.3 DIVERSITY ..........................................................................................................................67<br />
6.4 MACROALGAE AND AGGREGATING SESSILE INVERTEBRATES ................................71<br />
6.5 MOBILE INVERTEBRATES.................................................................................................72<br />
6.6 CONDITION INDICATORS ..................................................................................................75<br />
7 Mushroom <strong>Reef</strong> Marine Sanctuary .............................................................................80<br />
7.1 SITE DESCRIPTION AND TRANSECT LAYOUT ...............................................................80<br />
7.2 COMMUNITY STRUCTURE ................................................................................................83<br />
7.3 DIVERSITY ..........................................................................................................................83<br />
7.4 MACROALGAE AND AGGREGATING SESSILE INVERTEBRATES ................................87<br />
7.5 MOBILE INVERTEBRATES.................................................................................................88<br />
7.6 CONDITION INDICATORS ..................................................................................................91<br />
8 Bunurong Marine National Park .................................................................................95<br />
8.1 SITE DESCRIPTION AND TRANSECT LAYOUT ...............................................................95<br />
8.2 COMMUNITY STRUCTURE ................................................................................................97<br />
8.3 DIVERSITY ..........................................................................................................................97<br />
8.4 MACROALGAE AND AGGREGATING SESSILE INVERTEBRATES ..............................101<br />
8.5 MOBILE INVERTEBRATES...............................................................................................102<br />
8.6 CONDITION INDICATORS ................................................................................................105<br />
9 Point Addis Marine National Park............................................................................. 109<br />
9.1 SITE DESCRIPTION AND TRANSECT LAYOUT .............................................................109<br />
9.2 COMMUNITY STRUCTURE ..............................................................................................111<br />
V
<strong>Parks</strong> <strong>Victoria</strong> Technical Series No. 70<br />
<strong>Intertidal</strong> <strong>Reef</strong> <strong>Monitoring</strong> <strong>Program</strong><br />
9.3 DIVERSITY ........................................................................................................................111<br />
9.4 MACROALGAE AND AGGREGATING SESSILE INVERTEBRATES ..............................115<br />
9.5 MOBILE INVERTEBRATES...............................................................................................116<br />
9.6 CONDITION INDICATORS ................................................................................................119<br />
10 Point Danger Marine Sanctuary ................................................................................ 124<br />
10.1 SITE DESCRIPTION AND TRANSECT LAYOUT .............................................................124<br />
10.2 COMMUNITY STRUCTURE ..............................................................................................127<br />
10.3 DIVERSITY ........................................................................................................................127<br />
10.4 MACROALGAE AND AGGREGATING SESSILE INVERTEBRATES ..............................131<br />
10.5 MOBILE INVERTEBRATES...............................................................................................132<br />
10.6 CONDITION INDICATORS ................................................................................................135<br />
11 Barwon Bluff Marine Sanctuary ................................................................................ 140<br />
11.1 SITE DESCRIPTION AND TRANSECT LAYOUT .............................................................140<br />
11.2 COMMUNITY STRUCTURE ..............................................................................................143<br />
11.3 DIVERSITY ........................................................................................................................143<br />
11.4 MACROALGAE AND AGGREGATING SESSILE INVERTEBRATES ..............................147<br />
11.5 MOBILE INVERTEBRATES...............................................................................................148<br />
11.6 CONDITION INDICATORS ................................................................................................151<br />
12 References ................................................................................................................. 156<br />
13 Acknowledgements ................................................................................................... 158<br />
Appendix A – Site Details ................................................................................................. A1<br />
VI
<strong>Parks</strong> <strong>Victoria</strong> Technical Series No. 70<br />
<strong>Intertidal</strong> <strong>Reef</strong> <strong>Monitoring</strong> <strong>Program</strong><br />
INDEX OF FIGURES AND TABLES<br />
FIGURES<br />
Figure 1.1. An example plot depicting change in an environmental, population or<br />
community variable over time (days, months or years). ................................................. 3<br />
Figure 1.2. <strong>Parks</strong> <strong>Victoria</strong> Ranger Mr Dale Appleton working with marine biologist<br />
during intertidal reef monitoring surveys. ....................................................................... 5<br />
Figure 2.1. Location of intertidal monitoring sites in northern Port Phillip Bay. Marine<br />
Sanctuary areas are indicated by grey shading. ............................................................ 2<br />
Figure 2.2. Location of intertidal monitoring sites along the coastline of central <strong>Victoria</strong>. ....... 3<br />
Figure 2.3. Location of intertidal monitoring sites at Bunurong Marine National Park.<br />
Marine National Park areas are indicated by grey shading. ........................................... 4<br />
Figure 2.4. Location of intertidal monitoring sites along the western coastline of central<br />
<strong>Victoria</strong>. Marine protected areas’ boundaries are indicated by grey shading. ................. 5<br />
Figure 2.5. Example layout of high and low shore baselines and transects on an<br />
intertidal reef. Transects (T1-T5) run across the shore from right to left when<br />
looking towards the water. Endpoints of each transect are equidistant along each<br />
of the baselines. Sampling locations (S1-S5) are arranged down shore along each<br />
transect and encompass differences in substratum height down the shore. ................... 9<br />
Figure 2.6. Configuration of a sampling location along a transect. Each 2 x 2 m<br />
sampling location is centred on a point along the transect line. A quadrat is placed<br />
randomly within the sampling location using random x- and y-coordinates between<br />
-1 and 1. ........................................................................................................................ 9<br />
Figure 2.7. Quadrat with the alga Hormosira banksii and snail Bembicium nanum. The<br />
abundance of each gastropod is counted within the quadrat. The cover of<br />
macrophytes and highly aggregated animals is measured by the number of points<br />
intersecting each species on the quadrat grid. ..............................................................12<br />
Figure 2.8. Marine biologists counting invertebrates within quadrats during intertidal<br />
reef monitoring surveys at Halfmoon Bay (Site 4112), May 2009. .................................12<br />
Figure 2.9. Examples of typical flora and fauna on intertidal reefs: (a) the brown alga<br />
Hormosira banksii; (b) the common limpet Cellana tramoserica; (c) the limpets<br />
Siphonaria spp (centre) and Notoacmea mayi; (d) the gastropods Bembicium<br />
nanum (bottom) and Austrocochlea constricta; (e) the gastropods Cominella<br />
lineolata (top) and Dicathais orbita; and (f) the anemone Aulactinia veratra and the<br />
green alga Ulva spp in standing water. .........................................................................14<br />
Figure 3.1. <strong>Intertidal</strong> reef habitat at Point Cooke Marine Sanctuary: (a) 1 June 2007;<br />
and (b) 29 April 2009. ...................................................................................................20<br />
Figure 3.2. <strong>Intertidal</strong> reef at the Altona reference site, 27 April 2009. ....................................21<br />
Figure 3.3. Two dimensional MDS plot of invertebrate assemblages on intertidal reefs<br />
at Point Cooke, within the Point Cooke MS, and the Altona reference site. (a)<br />
Mobile Invertebrates, Kruskal stress = 0.17 and (b) Macroalgae and Aggregating<br />
Sessile Invertebrates, Kruskal stress = 0.08. The grey lines represent data from all<br />
other intertidal sites used in the MDS analysis. .............................................................23<br />
Figure 3.4. Mobile invertebrate species richness at Point Cooke, within the Point Cooke<br />
MS, and Altona reference site. ......................................................................................25<br />
Figure 3.5. Algal and aggregating sessile invertebrate species richness of intertidal<br />
sites at Point Cooke, within the Point Cooke MS, and the Altona reference site. ..........25<br />
Figure 3.6. Mobile invertebrate diversity (Hills N 2 ) of intertidal sites at Point Cooke,<br />
within the Point Cooke MS, and the Altona reference site. ............................................26<br />
Figure 3.7. Algal and aggregating sessile invertebrate diversity (Hill’s N 2 ) of intertidal<br />
sites at Point Cooke, within the Point Cooke MS, and the Altona reference site. ..........26<br />
Figure 3.8 Mean density (± Standard Error) of Ulva spp. at Point Cooke, within the<br />
Point Cooke MS, and the Altona reference site. ............................................................28<br />
VII
<strong>Parks</strong> <strong>Victoria</strong> Technical Series No. 70<br />
<strong>Intertidal</strong> <strong>Reef</strong> <strong>Monitoring</strong> <strong>Program</strong><br />
Figure 3.9. Mean density (± Standard Error) of: (a) the top shell Austrocochlea porcata;<br />
(b) the conniwink Bembicium spp.; and (c) the limpet Cellana tramoserica at Point<br />
Cooke, within the Point Cooke MS, and the Altona reference site. ................................30<br />
Figure 3.10. Mean sizes (± Standard Error) of: (a) the top shell Austrocochlea<br />
constricta; and (b) the limpet Cellana tramoserica at Point Cooke, and the Altona<br />
reference site. ...............................................................................................................31<br />
Figure 3.11. Mean cover (± Standard Error) of: (a) all algae; (b) erect coralline algae;<br />
and (c) turfing algae at Point Cooke, within the Point Cooke MS, and the Altona<br />
reference site. ...............................................................................................................33<br />
Figure 3.12. Mean abundance (± Standard Error) of: (a) all grazers; and (b) all<br />
predators at Point Cooke, within the Point Cooke MS, and the Altona reference<br />
site. ...............................................................................................................................34<br />
Figure 3.13. Mean cover (± Standard Error) of: (a) green algae Ulva, Enteromorpha<br />
and Cladophora species; and (b) sediment at Point Cooke, in Point Cooke MS,<br />
and the Altona reference site. .......................................................................................35<br />
Figure 4.1. <strong>Intertidal</strong> reef at Jawbone Marine Sanctuary, 3 May 2007. .................................37<br />
Figure 4.2. <strong>Intertidal</strong> reef at the Williamstown reference site, 30 April 2009. .........................37<br />
Figure 4.3. Two dimensional MDS plot of invertebrate assemblages on intertidal reefs<br />
at Jawbone, within the Jawbone MS, and the Williamstown reference site. (a)<br />
Mobile Invertebrate, Krushkal stress = 0.17 and (b) Macroalgae and Aggregating<br />
Sessile Invertebrates, Krushkal stress = 0.08. The grey lines represent data from<br />
all other intertidal sites used in the MDS analysis. ........................................................39<br />
Figure 4.4. Mobile invertebrate species richness at Jawbone, within the Jawbone MS,<br />
and the Williamstown reference site. ............................................................................40<br />
Figure 4.5. Algal and aggregating sessile invertebrate species richness of intertidal<br />
sites at Jawbone, within the Jawbone MS, and the Williamstown reference site. ..........40<br />
Figure 4.6. Mobile invertebrate diversity (Hills N 2 ) of intertidal sites at Jawbone, within<br />
the Jawbone MS, and the Williamstown reference site. ................................................41<br />
Figure 4.7. Algal and aggregating sessile invertebrate diversity (Hill’s N 2 ) of intertidal<br />
sites at Jawbone, within the Jawbone MS, and the Williamstown reference site. ..........41<br />
Figure 4.8. Mean density (± Standard Error) of Neptune’s necklace Hormosira banksii<br />
at Jawbone, within the Jawbone MS, and the Williamstown reference site. ..................42<br />
Figure 4.9. Mean density (± Standard Error) of: (a) the top shell Austrocochlea porcata;<br />
and (b) the limpet Cellana tramoserica at Jawbone, within the Jawbone MS, and<br />
the Williamstown reference site. ...................................................................................44<br />
Figure 4.10. Mean sizes (± Standard Error) of: (a) the top shell Austrocochlea porcata;<br />
and (b) the limpet Cellana tramoserica at Jawbone MS, and the Williamstown<br />
reference site. ...............................................................................................................45<br />
Figure 4.11. Mean cover (± Standard Error) of: (a) all algae; (b) erect coralline algae<br />
and (c) turfing algae at Jawbone MS, and the Williamstown reference site. ..................48<br />
Figure 4.12. Mean abundance (± Standard Error) of: (a) all grazers; and (b) all<br />
predators at Jawbone, and the Williamstown reference site..........................................49<br />
Figure 4.13. Mean cover (± Standard Error) of: (a) green algae Ulva, Enteromorpha<br />
and Cladophora species; and (b) sediment at Jawbone MS, and the Williamstown<br />
reference site. ...............................................................................................................50<br />
Figure 5.1. <strong>Intertidal</strong> reef at Ricketts Point Marine Sanctuary, 28 April 2009. ........................52<br />
Figure 5.2. The intertidal reef monitoring reference site at Halfmoon Bay, 1 May 2009.<br />
The high-shore baseline is at the right of the reef. ........................................................52<br />
Figure 5.3. Two dimensional MDS plot of invertebrate assemblages on intertidal reefs<br />
at Ricketts Point, within the Ricketts Point MS, and the Half Moon Bay reference<br />
site. (a) Mobile Invertebrate, Krushkal stress = 0.17 and (b) Macroalgae and<br />
Aggregating Sessile Invertebrates, Krushkal stress = 0.08. The grey lines<br />
represent data from all other intertidal sites used in the MDS analysis. ........................54<br />
VIII
<strong>Parks</strong> <strong>Victoria</strong> Technical Series No. 70<br />
<strong>Intertidal</strong> <strong>Reef</strong> <strong>Monitoring</strong> <strong>Program</strong><br />
Figure 5.4. Mobile invertebrate species richness at Ricketts Point, within the Ricketts<br />
Point MS, and the Half Moon Bay reference site. ..........................................................55<br />
Figure 5.5. Algal and aggregating sessile invertebrate species richness of intertidal<br />
sites at Ricketts Point, within the Ricketts Point MS, and the Half Moon Bay<br />
reference site. ...............................................................................................................55<br />
Figure 5.6. Mobile invertebrate diversity (Hills N 2 ) of intertidal sites at Ricketts Point,<br />
within the Ricketts Point MS, and the Half Moon Bay reference site. ............................56<br />
Figure 5.7. Algal and aggregating sessile invertebrate diversity (Hill’s N 2 ) of intertidal<br />
sites at Ricketts Point, within the Ricketts Point MS, and the Half Moon Bay<br />
reference site. ...............................................................................................................56<br />
Figure 5.8. Mean density (± Standard Error) of Neptune’s necklace Hormosira banksii<br />
at Ricketts Point, within the Ricketts Point MS, and the Half Moon Bay reference<br />
site. ...............................................................................................................................57<br />
Figure 5.9. Mean density (± Standard Error) of: (a) the limpet Cellana tramoserica; (b)<br />
the top shell Austrocochlea porcata; and (c) the conniwink Bembicium spp. at<br />
Ricketts Point, within the Ricketts Point MS, and the Half Moon Bay reference site. .....59<br />
Figure 5.10. Mean sizes (± Standard Error) of: (a) the top shell Austrocochlea porcata;<br />
and (b) the conniwink Bembicium spp. at Ricketts Point, in Ricketts Point MS, and<br />
the Half Moon Bay reference site. .................................................................................60<br />
Figure 5.11. Mean cover (± Standard Error) of: (a) all algae; (b) erect coralline algae;<br />
and (c) turfing algae at Ricketts Point, within the Ricketts Point MS, and the Half<br />
Moon Bay reference site. ..............................................................................................62<br />
Figure 5.12. Mean abundance (± Standard Error) of: (a) all grazers; and (b) all<br />
predators at Ricketts Point, within the Ricketts Point MS, and the Half Moon Bay<br />
reference site. ...............................................................................................................63<br />
Figure 5.13. Mean cover (± Standard Error) of: (a) green algae (Ulva, Enteromorpha<br />
and Cladophora species); and (b) sediment, at Ricketts Point, in Ricketts Point<br />
MS, and the Half Moon Bay reference site. ...................................................................64<br />
Figure 6.1. <strong>Intertidal</strong> reef at Point Lonsdale, Port Phillip Heads Marine National Park,<br />
12 June 2009. ...............................................................................................................66<br />
Figure 6.2. <strong>Intertidal</strong> reef at the Cheviot Bay reference site, 22 December 2004. .................66<br />
Figure 6.3. Two dimensional MDS plot of invertebrate assemblages on intertidal reefs<br />
at Point Lonsdale, within the Port Phillip Heads MNP, and the Cheviot Bay<br />
reference site. (a) Mobile Invertebrate, Krushkal stress = 0.17 and (b) Macroalgae<br />
and Aggregating Sessile Invertebrates, Krushkal stress = 0.08. The grey lines<br />
represent data from all other intertidal sites used in the MDS analysis. ........................68<br />
Figure 6.4. Mobile invertebrate species richness at Point Lonsdale within the Port<br />
Phillip Heads MNP, and the Cheviot Bay reference site. ...............................................69<br />
Figure 6.5. Algal and aggregating sessile invertebrate species richness of intertidal<br />
sites at Point Lonsdale within the Port Phillip Heads MNP, and the Cheviot Bay<br />
reference site. ...............................................................................................................69<br />
Figure 6.6. Mobile invertebrate diversity (Hills N 2 ) of intertidal sites at Point Lonsdale<br />
within the Port Phillip Heads MNP, and the Cheviot Bay reference site. .......................70<br />
Figure 6.7. Algal and aggregating sessile invertebrate diversity (Hill’s N 2 ) of intertidal<br />
sites at Point Lonsdale within the Port Phillip Heads MNP, and the Cheviot Bay<br />
reference site. ...............................................................................................................70<br />
Figure 6.8. Mean density (± Standard Error) of Neptune’s necklace Hormosira banksii<br />
at Point Lonsdale within the Port Phillip Heads MNP, and the Cheviot Bay<br />
reference site. ...............................................................................................................71<br />
Figure 6.9. Mean density (± Standard Error) of: (a) the limpet Cellana tramoserica; and<br />
(b) the striped conniwink Bembicium spp, at Point Lonsdale within the Port Phillip<br />
Heads MNP, and the Cheviot Bay reference site. .........................................................73<br />
Figure 6.10. Mean sizes (± Standard Error) of the limpet Cellana tramoserica at Point<br />
Lonsdale within the Port Phillip Heads MNP, and the Cheviot Bay reference site. ........74<br />
IX
<strong>Parks</strong> <strong>Victoria</strong> Technical Series No. 70<br />
<strong>Intertidal</strong> <strong>Reef</strong> <strong>Monitoring</strong> <strong>Program</strong><br />
Figure 6.11. Mean cover (± Standard Error) of: (a) all algae; (b) erect coralline algae;<br />
and (c) turfing algae at Point Lonsdale within the Port Phillip Heads MNP, and the<br />
Cheviot Bay reference site. ...........................................................................................77<br />
Figure 6.12. Mean abundance (± Standard Error) of: (a) all grazers; and (b) all<br />
predators at Point Lonsdale within the Port Phillip Heads MNP, and the Cheviot<br />
Bay reference site. ........................................................................................................78<br />
Figure 6.13. Mean cover (± Standard Error) of: (a) green algae (Ulva, Enteromorpha<br />
and Cladophora species); and (b) sediment at Point Lonsdale within the Port<br />
Phillip Heads MNP, and the Cheviot Bay reference site. ...............................................79<br />
Figure 7.1. <strong>Intertidal</strong> reef at Mushroom <strong>Reef</strong> Marine Sanctuary: (a) the cobble<br />
causeway, 8 June 2004; and b-c) the reef platform, 29 May 2009. ...............................81<br />
Figure 7.2. <strong>Intertidal</strong> reef at the Flinders West reference site, 8 June 2007. .........................82<br />
Figure 7.3. Two dimensional MDS plot of invertebrate assemblages on intertidal reefs<br />
at Mushroom <strong>Reef</strong>, within the Mushroom <strong>Reef</strong> MS, and the West Flinders<br />
reference site. (a) Mobile Invertebrate, Krushkal stress = 0.2 and (b) Macroalgae<br />
and Aggregating Sessile Invertebrates, Krushkal stress = 0.08. The grey lines<br />
represent data from all other intertidal sites used in the MDS analysis. ........................84<br />
Figure 7.4. Mobile invertebrate species richness at Mushroom <strong>Reef</strong>, within the<br />
Mushroom <strong>Reef</strong> MS, and the West Flinders reference site. ..........................................85<br />
Figure 7.5. Algal and aggregating sessile invertebrate species richness of intertidal<br />
sites at Mushroom <strong>Reef</strong>, within the Mushroom <strong>Reef</strong> MS, and the West Flinders<br />
reference site. ...............................................................................................................85<br />
Figure 7.6. Mobile invertebrate diversity (Hills N 2 ) of intertidal sites at Mushroom <strong>Reef</strong>,<br />
within the Mushroom <strong>Reef</strong> MS, and the West Flinders reference site. ..........................86<br />
Figure 7.7. Algal and aggregating sessile invertebrate diversity (Hill’s N 2 ) of intertidal<br />
sites at Mushroom <strong>Reef</strong>, within the Mushroom <strong>Reef</strong> MS, and the West Flinders<br />
reference site. ...............................................................................................................86<br />
Figure 7.8. Mean density (± Standard Error) of Neptune’s necklace Hormosira banksii<br />
at Mushroom <strong>Reef</strong>, within the Mushroom <strong>Reef</strong> MS, and the West Flinders<br />
reference site. ...............................................................................................................87<br />
Figure 7.9. Mean density (± Standard Error) of: (a) the top shell Austrocochlea<br />
constricta; and (b) the striped conniwink Bembicium nanum at Mushroom <strong>Reef</strong>,<br />
within the Mushroom <strong>Reef</strong> MS, and the West Flinders reference site. ..........................89<br />
Figure 7.10. Mean sizes (± Standard Error) of: (a) the conniwink Bembicium spp. And<br />
(b) the top shell Austrocochlea constricta at Mushroom <strong>Reef</strong>, within the Mushroom<br />
<strong>Reef</strong> MS, and the West Flinders reference site. ............................................................90<br />
Figure 7.11. Mean cover (± Standard Error) of: (a) all algae; (b) erect coralline algae;<br />
and (c) turfing algae at Mushroom <strong>Reef</strong>, within the Mushroom <strong>Reef</strong> MS, and the<br />
West Flinders reference site. ........................................................................................92<br />
Figure 7.12. Mean abundance (± Standard Error) of: (a) all grazers; and (b) all<br />
predators at Mushroom <strong>Reef</strong>, within the Mushroom <strong>Reef</strong> MS, and the West<br />
Flinders reference site. .................................................................................................93<br />
Figure 7.13. Mean cover (± Standard Error) of: (a) green algae (Ulva, Enteromorpha<br />
and Cladophora species); and (b) sediment at Mushroom <strong>Reef</strong>, within the<br />
Mushroom <strong>Reef</strong> MS, and the West Flinders reference site. ..........................................94<br />
Figure 8.1. <strong>Intertidal</strong> reef at Eagles Nest, Bunurong Marine National Park, 7 June 2007. .....96<br />
Figure 8.2. <strong>Intertidal</strong> reef at the Caves reference site, 7 June 2007, showing (a) the<br />
study area and (b) the limpet Cellana tramoserica. .......................................................96<br />
Figure 8.3. Two dimensional MDS plot of invertebrate assemblages on intertidal reefs<br />
at Eagles Nest, within the Bunurong MNP, and the Caves reference site. (a)<br />
Mobile Invertebrate, Krushkal stress = 0.2 and (b) Macroalgae and Aggregating<br />
Sessile Invertebrates, Krushkal stress = 0.8. The grey lines represent data from all<br />
other intertidal sites used in the MDS analysis. .............................................................98<br />
X
<strong>Parks</strong> <strong>Victoria</strong> Technical Series No. 70<br />
<strong>Intertidal</strong> <strong>Reef</strong> <strong>Monitoring</strong> <strong>Program</strong><br />
Figure 8.4. Mobile invertebrate species richness at Eagles Nest, within the Bunurong<br />
MNP, and the Caves reference site. .............................................................................99<br />
Figure 8.5. Algal and aggregating sessile invertebrate species richness of intertidal<br />
sites at Eagles Nest, within the Bunurong MNP, and the Caves reference site. ............99<br />
Figure 8.6. Mobile invertebrate diversity (Hills N 2 ) of intertidal sites at Eagles Nest,<br />
within the Bunurong MNP, and the Caves reference site. ........................................... 100<br />
Figure 8.7. Algal and aggregating sessile invertebrate diversity (Hill’s N 2 ) of intertidal<br />
sites at Eagles Nest, within the Bunurong MNP, and the Caves reference site. .......... 100<br />
Figure 8.8. Mean density (± Standard Error) of Neptune’s necklace Hormosira banksii<br />
at Eagles Nest, within the Bunurong MNP, and the Caves reference site. .................. 101<br />
Figure 8.9. Mean density (± Standard Error) of (a) Nodilittorina unifasciata; (b) the<br />
striped conniwink Bembicium nanum; and (c) the limpet Cellana tramoserica at<br />
Eagles Nest, within the Bunurong MNP, and the Caves reference site. ...................... 103<br />
Figure 8.10. Mean sizes (± Standard Error) of the limpet Cellana tramoserica at Eagles<br />
Nest, within the Bunurong MNP, and the Caves reference site. .................................. 104<br />
Figure 8.11. Mean cover (± Standard Error) of: (a) all algae; (b) erect coralline algae;<br />
and (c) turfing algae at Eagles Nest, within the Bunurong MNP, and the Caves<br />
reference site. ............................................................................................................. 106<br />
Figure 8.12. Mean abundance (± Standard Error) of: (a) all grazers; and (b) all<br />
predators at Eagles Nest, within the Bunurong MNP, and the Caves reference<br />
site. ............................................................................................................................. 107<br />
Figure 8.13. Mean cover (± Standard Error) of: (a) green algae (Ulva, Enteromorpha<br />
and Cladophora species); and (b) sediment at Eagles Nest, within the Bunurong<br />
MNP, and the Caves reference site. ........................................................................... 108<br />
Figure 9.1. <strong>Intertidal</strong> reef at Point Addis Marine National Park, 17 December 2004. ........... 110<br />
Figure 9.2. <strong>Intertidal</strong> reef at the Winkipop reference site, 28 May 2009. ............................. 110<br />
Figure 9.3. Two dimensional MDS plot of invertebrate assemblages on intertidal reefs<br />
at Point Addis, within the Point Addis MNP, and the Winkipop reference site. (a)<br />
Mobile Invertebrate, Krushkal stress = 0.17427 and (b) Macroalgae and<br />
Aggregating Sessile Invertebrates, Krushkal stress = 0.08. The grey lines<br />
represent data from all other intertidal sites used in the MDS analysis. ...................... 112<br />
Figure 9.4. Mobile invertebrate species richness at Point Addis within the Point Addis<br />
MNP, and the Winkipop reference site. ....................................................................... 113<br />
Figure 9.5. Algal and aggregating sessile invertebrate species richness of intertidal<br />
sites at Point Addis within the Point Addis MNP, and the Winkipop reference site. ..... 113<br />
Figure 9.6. Mobile invertebrate diversity (Hills N 2 ) of intertidal sites at Point Addis within<br />
the Point Addis MNP, and the Winkipop reference site. .............................................. 114<br />
Figure 9.7. Algal and aggregating sessile invertebrate diversity (Hill’s N 2 ) of intertidal<br />
sites at Point Addis within the Point Addis MNP, and the Winkipop reference site. ..... 114<br />
Figure 9.8. Mean density (± Standard Error) of Neptune’s necklace Hormosira banksii<br />
at Point Addis within the Point Addis MNP, and the Winkipop reference site. ............. 115<br />
Figure 9.9. Mean density (± Standard Error) of: (a) the limpet Clypidina rugosa; (b) the<br />
striped conniwink Bembicium nanum; and (c) the limpet Cellana tramoserica at<br />
Point Addis within the Point Addis MNP, and the Winkipop reference site. ................. 117<br />
Figure 9.10. Mean sizes (± Standard Error) of the limpet Cellana tramoserica at Point<br />
Addis, within the Point Addis MNP, and the Winkipop reference site. ......................... 118<br />
Figure 9.11. Mean cover (± Standard Error) of: (a) all algae; (b) erect coralline algae;<br />
and (c) turfing algae at Point Addis within the Point Addis MNP, and the Winkipop<br />
reference site. ............................................................................................................. 121<br />
Figure 9.12. Mean abundance (± Standard Error) of: (a) all grazers; and (b) all<br />
predators at Point Addis within the Point Addis MNP, and the Winkipop reference<br />
site. ............................................................................................................................. 122<br />
XI
<strong>Parks</strong> <strong>Victoria</strong> Technical Series No. 70<br />
<strong>Intertidal</strong> <strong>Reef</strong> <strong>Monitoring</strong> <strong>Program</strong><br />
Figure 9.13. Mean cover (± Standard Error) of: (a) green algae (Ulva, Enteromorpha<br />
and Cladophora species); and (b) sediment at Point Addis within the Point Addis<br />
MNP, and the Winkipop reference site. ....................................................................... 123<br />
Figure 10.1. <strong>Intertidal</strong> reef at Point Danger Marine Sanctuary: (a-b) 14 January 2005;<br />
(c-d) 30 April 2009. ..................................................................................................... 125<br />
Figure 10.2. <strong>Intertidal</strong> reef at the Point Danger West reference site: (a) 17 January<br />
2005; (b) 30 April 2009. Note: sand inundation along the high shore was lower in<br />
2009, but remained higher than when the site was established. ................................. 126<br />
Figure 10.3. Two dimensional MDS plot of invertebrate assemblages on intertidal reefs<br />
at Point Danger, within the Point Danger MS, and the Point Danger West<br />
reference site. (a) Mobile Invertebrate, Krushkal stress = 0.2 and (b) Macroalgae<br />
and Aggregating Sessile Invertebrates, Krushkal stress = 0.8. The grey lines<br />
represent data from all other intertidal sites used in the MDS analysis. ...................... 128<br />
Figure 10.4. Mobile invertebrate species richness at Point Danger, within the Point<br />
Danger MS, and the Point Danger West reference site. .............................................. 129<br />
Figure 10.5. Algal and aggregating sessile invertebrate species richness of intertidal<br />
sites at Point Danger, within the Point Danger MS, and the Point Danger West<br />
reference site. ............................................................................................................. 129<br />
Figure 10.6. Mobile invertebrate diversity (Hills N 2 ) of intertidal sites at Point Danger,<br />
within the Point Danger MS, and the Point Danger West reference site. ..................... 130<br />
Figure 10.7. Algal and aggregating sessile invertebrate diversity (Hill’s N 2 ) of intertidal<br />
sites at Point Danger, within the Point Danger MS, and the Point Danger West<br />
reference site. ............................................................................................................. 130<br />
Figure 10.8. Mean Density (±Standard Error) of Neptune’s necklace Hormosira banksii<br />
at Point Danger, within the Point Danger MS, and the Point Danger West<br />
reference site. ............................................................................................................. 131<br />
Figure 10.9. Mean Density (±Standard Error) of: (a) the limpet Clypidina rugosa; (b) the<br />
striped conniwink Bembicium nanum; and (c) the limpet Cellana tramoserica at<br />
Point Danger, within the Point Danger MS, and Point Danger the West reference<br />
site. ............................................................................................................................. 133<br />
Figure 10.10. Mean sizes (± Standard Error) of the conniwink Bembicium spp. and<br />
Cellana tramoserica at Point Danger, within the Point Danger MS, and the Point<br />
Danger West reference site. ....................................................................................... 134<br />
Figure 10.11. Mean cover (± Standard Error) of: (a) all algae; (b) erect coralline algae;<br />
and (c) turfing algae at Point Danger, within the Point Danger MS, and Point<br />
Danger the West reference site. ................................................................................. 137<br />
Figure 10.12. Mean abundance (± Standard Error) of: (a) all grazers; and (b) all<br />
predators at Point Danger, within the Point Danger MS, and Point Danger the<br />
West reference site. .................................................................................................... 138<br />
Figure 10.13. Mean cover (± Standard Error) of: (a) green algae (Ulva, Enteromorpha<br />
and Cladophora species); and (b) sediment at Point Danger, within the Point<br />
Danger MS, and Point Danger the West reference site. .............................................. 139<br />
Figure 11.1. <strong>Intertidal</strong> reef at Barwon Bluff Marine Sanctuary: (a) 30 November 2005;<br />
and (b) 1 May 2009..................................................................................................... 142<br />
Figure 11.2. Two dimensional MDS plot of invertebrate assemblages on intertidal reefs<br />
at Barwon Bluff, within the Barwon Bluff MS, and the reference Barwon Bluff site.<br />
(a) Mobile Invertebrate, Krushkal stress = 0.17 and (b) Macroalgae and<br />
Aggregating Sessile Invertebrates, Krushkal stress = 0.08. The grey lines<br />
represent data from all other intertidal sites used in the MDS analysis. ...................... 144<br />
Figure 11.3. Mobile invertebrate species richness at Barwon Bluff within the Barwon<br />
Bluff MS, and the Barwon Beach reference site. ......................................................... 145<br />
Figure 11.4. Algal and aggregating sessile invertebrate species richness of intertidal<br />
sites at Barwon Bluff within the Barwon Bluff MS, and the Barwon Beach<br />
reference site. ............................................................................................................. 145<br />
XII
<strong>Parks</strong> <strong>Victoria</strong> Technical Series No. 70<br />
<strong>Intertidal</strong> <strong>Reef</strong> <strong>Monitoring</strong> <strong>Program</strong><br />
Figure 11.5. Mobile invertebrate diversity (Hills N 2 ) of intertidal sites at Barwon Bluff<br />
within the Barwon Bluff MS, and the Barwon Beach reference site. ............................ 146<br />
Figure 11.6. Algal and aggregating sessile invertebrate diversity (Hill’s N 2 ) of intertidal<br />
sites at Barwon Bluff within the Barwon Bluff MS, and the Barwon Beach<br />
reference site. ............................................................................................................. 146<br />
Figure 11.7. Mean percent cover (± Standard Error) of Neptune’s necklace Hormosira<br />
banksii at Barwon Bluff within the Barwon Bluff MS, and the Barwon Beach<br />
reference site. ............................................................................................................. 147<br />
Figure 11.8. Mean Density (±Standard Error) of: (a) Nodilittorina acutispira; (b) the<br />
limpet Clypidina rugosa; and (c) the limpet Cellana tramoserica at Barwon Bluff<br />
within the Barwon Bluff MS, and the Barwon Beach reference site. ............................ 149<br />
Figure 11.9. Mean sizes (± Standard Error) of the limpet Cellana tramoserica at<br />
Barwon Bluff, within the Barwon Bluff MS, and the Barwon Beach reference site. ...... 150<br />
Figure 11.10. Mean cover (± Standard Error) of: (a) all algae; (b) erect coralline algae;<br />
and (c) turfing algae at Barwon Bluff within the Barwon Bluff MS, and the Barwon<br />
Beach reference site. .................................................................................................. 153<br />
Figure 11.11. Mean abundance (± Standard Error) of: (a) all grazers; and (b) all<br />
predators at Barwon Bluff within the Barwon Bluff MS, and the Barwon Beach<br />
reference site. ............................................................................................................. 154<br />
Figure 11.12. Mean cover (± Standard Error) of: (a) green algae (Ulva, Enteromorpha<br />
and Cladophora species); and (b) sediment at Barwon Bluff within the Barwon<br />
Bluff MS, and the Barwon Beach reference site. ......................................................... 155<br />
TABLES<br />
Table 2.1. <strong>Intertidal</strong> reef monitoring sites. Coordinates in Map Grid of Australia (Zone<br />
55). ................................................................................................................................ 6<br />
Table 2.2. Survey periods of intertidal monitoring sites. ......................................................... 7<br />
Table 2.3. <strong>Intertidal</strong> species in south eastern Australia surveyed using Methods A<br />
and B. ...........................................................................................................................13<br />
XIII
<strong>Parks</strong> <strong>Victoria</strong> Technical Series No. 70<br />
<strong>Intertidal</strong> <strong>Reef</strong> <strong>Monitoring</strong> <strong>Program</strong><br />
1 INTRODUCTION<br />
1.1 <strong>Intertidal</strong> <strong>Reef</strong> Ecosystems<br />
Rocky intertidal reefs are restricted to a narrow fringe between fully terrestrial environments<br />
on land and fully submerged subtidal environments further offshore. <strong>Intertidal</strong> reefs in <strong>Victoria</strong><br />
are generally restricted to headlands and points and are often isolated from each other by<br />
stretches of sandy beach. <strong><strong>Victoria</strong>n</strong> intertidal reefs vary in structure from steep sloping rock<br />
faces to relatively flat or gently sloping boulder fields and rock platforms. Weathering creates<br />
features on intertidal reefs including cobble fields, vertical steps, undulations in the reef,<br />
crevices, patches of sand and rock pools. The influence of the regular tidal cycle is the most<br />
important determinant of the types of biota inhabiting rocky reefs. <strong>Intertidal</strong> reefs tend to<br />
experience rapid changes and extremes in environmental conditions including temperature,<br />
salinity and exposure to air causing desiccation stress.<br />
Typical algal species on protected intertidal reefs include the mat forming brown algae<br />
Neptune’s necklace Hormosira banksii and the green algae sea lettuce Ulva spp and<br />
Enteromorpha spp. Other small turfing species are also often present. Less conspicuous is a<br />
thin layer of microscopic algae growing directly on the surface of the reef, which is an<br />
important food source for species of grazing molluscs.<br />
Molluscs tend to be the dominant faunal component on intertidal reefs. Herbivorous species<br />
include the limpet Cellana tramoserica, as well as other species such as top shells<br />
Austrocochlea spp and conniwinks Bembicium spp. Molluscan predators include Cominella<br />
lineolata and Lepsiella vinosa. The small mussel Xenostrobus pulex and tubeworms such as<br />
Galeolaria caespitosa create encrusting mats on the surface of the reef. Other invertebrates<br />
on intertidal reefs include small crustaceans such as crabs, as well as sessile animals<br />
including anemones. Fishes move in over the reef as the tide rises and can be important<br />
structuring components of intertidal reef communities.<br />
<strong>Intertidal</strong> reefs are the most accessible component of marine environments and consequently<br />
these habitats have important social and cultural values. Due to their accessibility, intertidal<br />
reefs are sometimes subject to human pressures, including collection of animals for food and<br />
fishing bait, trampling and pollution from catchment discharges. To effectively manage and<br />
conserve these habitats, the <strong><strong>Victoria</strong>n</strong> Government, through <strong>Parks</strong> <strong>Victoria</strong>, has established<br />
the <strong>Intertidal</strong> <strong>Reef</strong> <strong>Monitoring</strong> <strong>Program</strong> (IRMP).<br />
I1
<strong>Parks</strong> <strong>Victoria</strong> Technical Series No. 70<br />
<strong>Intertidal</strong> <strong>Reef</strong> <strong>Monitoring</strong> <strong>Program</strong><br />
1.2 <strong>Intertidal</strong> <strong>Reef</strong> <strong>Monitoring</strong> <strong>Program</strong><br />
1.2.1 Objectives<br />
An important aspect in the management and conservation of <strong><strong>Victoria</strong>n</strong> marine natural<br />
resources and assets is assessing the condition of the ecosystem and how this changes over<br />
time. Combined with an understanding of ecosystem processes, this information can be used<br />
to manage threats or pressures on the environment to ensure ecosystem sustainability.<br />
Consequently, <strong>Parks</strong> <strong>Victoria</strong> established a long-term <strong>Intertidal</strong> <strong>Reef</strong> <strong>Monitoring</strong> <strong>Program</strong><br />
(IRMP). The primary objective of the IRMP is to provide information on the status of <strong><strong>Victoria</strong>n</strong><br />
reef flora and fauna. This includes monitoring the nature and magnitude of trends in species<br />
abundances, species diversity and community structure. This will be achieved through<br />
regular surveys at locations throughout <strong>Victoria</strong>, encompassing both representative and<br />
unique habitats and communities.<br />
Information from the IRMP is allowing managers to better understand and interpret long-term<br />
changes in the population and community dynamics of <strong>Victoria</strong>’s reef flora and fauna. As a<br />
longer time series of data is collected, the IRMP will allow managers to:<br />
• compare changes in the status of species populations and biological communities<br />
between highly protected marine national parks and marine sanctuaries and other<br />
<strong><strong>Victoria</strong>n</strong> reefs;<br />
• determine associations among species and between species and environmental<br />
parameters (e.g. exposure, reef topography) and assess how these associations vary<br />
through space and time;<br />
• provide benchmarks for assessing the effectiveness of management actions, in<br />
accordance with international best practice for quality environmental management<br />
systems; and<br />
• provide baseline data to detect the responses of species and communities to unforeseen<br />
and unpredictable events such as marine pest invasions, mass mortality events, oil<br />
spills, severe storm events and climate change.<br />
A monitoring survey gives an estimate of population abundance and community structure<br />
from a small window in time. Patterns seen in data from periodic surveys are unlikely to<br />
exactly match changes in the real populations over time or definitively predict the size and<br />
nature of future variation. Plots of changes over time are unlikely to match the changes in<br />
real populations because changes over shorter time periods and actual minima and maxima<br />
may not be adequately sampled (Figure 1.1). Furthermore, because the nature and<br />
I2
<strong>Parks</strong> <strong>Victoria</strong> Technical Series No. 70<br />
<strong>Intertidal</strong> <strong>Reef</strong> <strong>Monitoring</strong> <strong>Program</strong><br />
magnitude of environmental variation is different over different time scales, variation over<br />
long periods may not be adequately predicted from shorter-term data. Sources of<br />
environmental variation can operate at the scale of months (e.g. seasonal variation), years<br />
(e.g. El Niño), decades (e.g. extreme storm events) or even centuries (e.g. global warming).<br />
Other studies indicate this monitoring program will begin to adequately reflect average trends<br />
and patterns as the surveys continue over longer periods (multiple years to decades).<br />
Results always need to be interpreted within the context of the time scale over which they<br />
have been measured.<br />
Parameter<br />
Time<br />
Figure 1.1. An example plot depicting change in an environmental, population or community variable<br />
over time (days, months or years). The black circles denote examples of monitoring times. Note how<br />
data from these times may not necessarily reflect patterns over shorter time periods, or true maxima or<br />
minima over longer time periods. Note further how data from any window of 2 or 3 consecutive<br />
monitoring times fails to adequately estimate the patterns or variation over the longer time period.<br />
I3
<strong>Parks</strong> <strong>Victoria</strong> Technical Series No. 70<br />
<strong>Intertidal</strong> <strong>Reef</strong> <strong>Monitoring</strong> <strong>Program</strong><br />
1.2.2 <strong>Monitoring</strong> Protocols and Locations<br />
The IRMP was initiated in April 2003 with 14 sites established on intertidal reef habitats<br />
inside and outside the following marine protected areas:<br />
Point Addis Marine National Park;<br />
Point Danger Marine Sanctuary;<br />
Barwon Heads Marine Sanctuary;<br />
Point Cooke Marine Sanctuary;<br />
Jawbone Marine Sanctuary;<br />
Ricketts Point Marine Sanctuary; and<br />
Mushroom <strong>Reef</strong> Marine Sanctuary.<br />
The intertidal reef monitoring program uses standardised visual census methods for<br />
surveying invertebrates and macroalgae on intertidal reefs. The initial round of surveys was<br />
done using a draft Standard Operating Procedure (Edmunds and Hart 2003; Edmunds et al.<br />
2004). These Standard Operating Procedures (SOP) were peer reviewed after the first<br />
survey. The SOP was modified in consultation with <strong>Parks</strong> <strong>Victoria</strong> and according to<br />
recommendations made during the peer review process. Details of the updated standard<br />
operational procedures (SOP) and quality control protocols are described in Hart and<br />
Edmunds (2005).<br />
Existing monitoring sites in Port Phillip Bay and at the Mushroom <strong>Reef</strong> Marine Sanctuary<br />
were resurveyed in 2004 using the revised standard operating procedures (Hart and<br />
Edmunds 2005). At Barwon Heads Marine Sanctuary only Barwon Bluff (Site 4004) was<br />
surveyed during Survey 2, May 2004. Weather, tide and logistical limitations prevented the<br />
survey of Barwon Beach during this survey.All monitoring sites were then surveyed in the<br />
summer of 2004/2005. In addition, new sites were established and surveyed inside and<br />
outside:<br />
Bunurong Marine National Park; and<br />
Port Phillip Heads Marine National Park.<br />
Sites along the central <strong><strong>Victoria</strong>n</strong> coast, excluding those within Port Phillip Bay, were surveyed<br />
in summer 2005/2006. All monitoring sites were surveyed again in: autumn 2007; autumn to<br />
early winter in 2009; and autumn 2010.<br />
I4
<strong>Parks</strong> <strong>Victoria</strong> Technical Series No. 70<br />
<strong>Intertidal</strong> <strong>Reef</strong> <strong>Monitoring</strong> <strong>Program</strong><br />
Figure 1.2. <strong>Parks</strong> <strong>Victoria</strong> Ranger Mr Dale Appleton working with marine biologist during intertidal reef<br />
monitoring surveys.<br />
1.2.3 <strong>Monitoring</strong> Central <strong><strong>Victoria</strong>n</strong> Marine Protected Areas<br />
This report describes the intertidal reef monitoring program and results from surveys, done in<br />
April to June 2009, in the following marine protected areas (and corresponding reference<br />
sites) in central <strong>Victoria</strong>:<br />
Point Cooke Marine Sanctuary;<br />
Jawbone Marine Sanctuary;<br />
Ricketts Point Marine Sanctuary;<br />
Port Phillip Heads Marine National Park;<br />
Mushroom <strong>Reef</strong> Marine Sanctuary;<br />
Bunurong Marine National Park;<br />
Point Addis Marine National Park;<br />
Point Danger Marine Sanctuary; and<br />
Barwon Heads Marine Sanctuary.<br />
I5
<strong>Parks</strong> <strong>Victoria</strong> Technical Series No. 70<br />
<strong>Intertidal</strong> <strong>Reef</strong> <strong>Monitoring</strong> <strong>Program</strong><br />
The objectives of this report were to:<br />
1. provide an overview of the methods used for the IRMP;<br />
2. provide general descriptions of the biological communities and species populations at<br />
each monitoring site;<br />
3. describe changes and trends that have occurred over the monitoring period;<br />
4. identify any unusual biological phenomena, interesting or unique communities or<br />
species; and<br />
5. identify any introduced species detected during monitoring.<br />
I6
<strong>Parks</strong> <strong>Victoria</strong> Technical Series No. 70<br />
<strong>Intertidal</strong> <strong>Reef</strong> <strong>Monitoring</strong> <strong>Program</strong><br />
2 METHODS<br />
2.1 Site Selection and Survey Times<br />
<strong>Intertidal</strong> survey sites were established on intertidal reefs in nine marine protected areas in<br />
the Central <strong><strong>Victoria</strong>n</strong> and <strong><strong>Victoria</strong>n</strong> Embayments Bioregions. These were:<br />
• northern Port Phillip Bay (Figure 2.1): – Point Cooke Marine Sanctuary;<br />
– Jawbone Marine Sanctuary;<br />
– Ricketts Point Marine Sanctuary;<br />
• central coast of central <strong>Victoria</strong> (Figure 2.2): – Port Phillip Heads Marine National Park;<br />
– Mushroom <strong>Reef</strong> Marine Sanctuary;<br />
• eastern coast of central <strong>Victoria</strong> (Figure 2.3): – Bunurong Marine National Park;<br />
• western coast of central <strong>Victoria</strong> (Figure 2.4): – Point Addis Marine National Park;<br />
– Point Danger Marine Sanctuary; and<br />
– Barwon Heads Marine Sanctuary.<br />
Two sites were surveyed in each area, one inside and one outside the MPA.<br />
Each site was assigned a number in accordance with the <strong>Parks</strong> <strong>Victoria</strong> (PV) and<br />
Department of Sustainability and Environment (DSE) database system for marine monitoring<br />
(Table 2.1). Survey dates are shown in Table 2.2. A description of each intertidal reef and<br />
sampling considerations at each site is given separately for each marine sanctuary in<br />
Appendix A – Site Details.<br />
1
<strong>Parks</strong> <strong>Victoria</strong> Technical Series No. 70<br />
<strong>Intertidal</strong> <strong>Reef</strong> <strong>Monitoring</strong> <strong>Program</strong><br />
Figure 2.1. Location of intertidal monitoring sites in northern Port Phillip Bay. Marine Sanctuary areas<br />
are indicated by grey shading.<br />
2
<strong>Parks</strong> <strong>Victoria</strong> Technical Series No. 70<br />
<strong>Intertidal</strong> <strong>Reef</strong> <strong>Monitoring</strong> <strong>Program</strong><br />
Figure 2.2. Location of intertidal monitoring sites along the coastline of central <strong>Victoria</strong>. Marine<br />
protected areas are indicated by grey shading.<br />
3
<strong>Parks</strong> <strong>Victoria</strong> Technical Series No. 70<br />
<strong>Intertidal</strong> <strong>Reef</strong> <strong>Monitoring</strong> <strong>Program</strong><br />
Figure 2.3. Location of intertidal monitoring sites at Bunurong Marine National Park. Marine National<br />
Park areas are indicated by grey shading.<br />
4
<strong>Parks</strong> <strong>Victoria</strong> Technical Series No. 70<br />
<strong>Intertidal</strong> <strong>Reef</strong> <strong>Monitoring</strong> <strong>Program</strong><br />
Figure 2.4. Location of intertidal monitoring sites along the western coastline of central <strong>Victoria</strong>.<br />
Marine protected areas’ boundaries are indicated by grey shading.<br />
5
<strong>Parks</strong> <strong>Victoria</strong> Technical Series No. 70<br />
<strong>Intertidal</strong> <strong>Reef</strong> <strong>Monitoring</strong> <strong>Program</strong><br />
Table 2.1. <strong>Intertidal</strong> reef monitoring sites. Coordinates in Map Grid of Australia (Zone 55).<br />
Site Number Site Name Status<br />
Point Cooke MS<br />
Jawbone MS<br />
Easting<br />
(MGA)<br />
Northing<br />
(MGA)<br />
4107 Point Cooke Marine Sanctuary 305876 5799893<br />
4108 Altona Reference 310020 5806233<br />
4109 Jawbone Marine Sanctuary 313062 5807137<br />
4110 Williamstown Reference 315545 5806228<br />
Ricketts Point MS<br />
4111 Ricketts Point Marine Sanctuary 327001 5792953<br />
4112 Halfmoon Bay Reference 325118 5795723<br />
Port Phillip Heads MNP<br />
2823 Pt Lonsdale Marine National Park 291321 5759033<br />
2824 Cheviot Bay Reference 295939 5756879<br />
Mushroom <strong>Reef</strong> MS<br />
2907 Mushroom <strong>Reef</strong> Marine Sanctuary 327050 5738412<br />
2908 West Flinders Reference 326497 5739009<br />
Bunurong MNP<br />
3020 Eagles Nest Marine National Park 384362 5719082<br />
3021 Caves Reference 385203 5719868<br />
Point Addis MNP<br />
3901 Point Addis Marine National Park 260162 5746979<br />
3902 Winkipop Reference 262913 5750014<br />
Point Danger MS<br />
4002 Point Danger Marine Sanctuary 266413 5753027<br />
4001 Pt Danger West Reference 266093 5752959<br />
Barwon Bluff MS<br />
4004 Barwon Bluff Marine Sanctuary 281293 5758960<br />
4003 Barwon Beach Reference 280828 5759028<br />
6
<strong>Parks</strong> <strong>Victoria</strong> Technical Series No. 70<br />
<strong>Intertidal</strong> <strong>Reef</strong> <strong>Monitoring</strong> <strong>Program</strong><br />
Table 2.2. Survey periods of intertidal monitoring sites.<br />
Survey Period Sites<br />
1 April - July 2003 4107; 4108; 4109; 4110; 4111; 4112; 2907; 2908;<br />
4001; 4002; 4003; 4004.<br />
2 May - June 2004 4107; 4108; 4109; 4110; 4111; 4112; 2907; 2908;<br />
4004.<br />
3 December 2004 - April 2005 4107; 4108; 4109; 4110; 4111; 4112; 2823; 2824;<br />
2907; 2908; 3020; 3021; 3901; 3902; 4001; 4002;<br />
4003; 4004.<br />
4 September 2005- January 2006 2823; 2824; 2907; 2908; 3020; 3021; 3901; 3902;<br />
4001; 4002; 4003; 4004.<br />
5 May - June 2007 4107; 4108; 4109; 4110; 4111; 4112; 2823; 2824;<br />
2907; 2908; 3020; 3021; 3901; 3902; 4001; 4002;<br />
4003; 4004.<br />
6 April - June 2009 4107; 4108; 4109; 4110; 4111; 4112; 2823; 2824;<br />
2907; 2908; 3020; 3021; 3901; 3902; 4001; 4002;<br />
4003; 4004.<br />
7 March - May 2010 4107; 4108; 4109; 4110; 4111; 4112; 2823; 2824;<br />
2907; 2908; 3020; 3021; 3901; 3902; 4001; 4002;<br />
4003; 4004.<br />
7
<strong>Parks</strong> <strong>Victoria</strong> Technical Series No. 70<br />
<strong>Intertidal</strong> <strong>Reef</strong> <strong>Monitoring</strong> <strong>Program</strong><br />
2.1.1 General Survey Technique<br />
Each site is surveyed during a single low tide. Surveys target the predominant substratum<br />
type at each intertidal reef (e.g. basalt boulder field, flat sandstone reef, basalt reef). The<br />
maximum along-shore distance that is practical to sample in a single tide using this method<br />
is 100 m.<br />
Within the area to be surveyed, the high and low shore boundaries are identified. On<br />
vertically sloping shores, the high shore boundary generally approximates the mean high<br />
water level. On relatively flat shores with little variation in vertical height across the shore, the<br />
high shore is at the landward edge and the low shore is at the seaward edge of the flat area.<br />
A weighted tape measure or numbered transect line is placed along the high shore,<br />
beginning at the right hand side of the shore when looking towards the sea. This is the highshore<br />
baseline (A-B, Figure 2.5). Similarly, a low shore baseline is established by placing a<br />
transect line along the low shore. The positions of each end of both baselines are recorded<br />
using dGPS and photographed (C-D, Figure 2.5).<br />
Five fixed transects, each running from high to low shore, are positioned across the intertidal<br />
area to be surveyed (Figure 2.5). Transect 1 is furthest to the right-hand side (looking<br />
seaward) and Transect 5 to the left-hand side of the reef when looking out to sea. Each<br />
transect runs between points on the high and low shore baselines. Adjacent transects are<br />
roughly equidistant from each other.<br />
The biota are surveyed using 0.5 x 0.5 m quadrats, randomly placed within 2 x 2 m areas at<br />
at five fixed sampling along each transect (Figure 2.6). The fixed sampling points are<br />
equidistant along each transect (Figure 2.6).<br />
8
<strong>Parks</strong> <strong>Victoria</strong> Technical Series No. 70<br />
<strong>Intertidal</strong> <strong>Reef</strong> <strong>Monitoring</strong> <strong>Program</strong><br />
A<br />
high-shore baseline<br />
B<br />
S1<br />
T1 T2 T3 T4 T5<br />
S2<br />
S3<br />
S4<br />
S5<br />
C<br />
low-shore baseline<br />
D<br />
Figure 2.5. Example layout of high and low shore baselines and transects on an intertidal reef.<br />
Transects (T1-T5) run across the shore from right to left when looking towards the water. Endpoints of<br />
each transect are equidistant along each of the baselines. Sampling locations (S1-S5) are arranged<br />
down shore along each transect and encompass differences in substratum height down the shore.<br />
(-1, -1)<br />
2 m<br />
(0,0)<br />
2 m<br />
(1, 1)<br />
Transect Line<br />
Figure 2.6. Configuration of a sampling location along a transect. Each 2 x 2 m sampling location is<br />
centred on a point along the transect line. A quadrat is placed randomly within the sampling location<br />
using random x- and y-coordinates between -1 and 1.<br />
9
<strong>Parks</strong> <strong>Victoria</strong> Technical Series No. 70<br />
<strong>Intertidal</strong> <strong>Reef</strong> <strong>Monitoring</strong> <strong>Program</strong><br />
2.2 Visual Census Techniques<br />
2.2.1 Method A – Mobile Invertebrates<br />
The density of non-sessile invertebrates, such as gastropods and sea stars, is measured by<br />
counting individuals within the 0.5 x 0.5 m quadrats (Figures 2.7 and 2.8; Table 2.3). All<br />
observable individuals on the rock surface or within crevices and algal fronds are counted.<br />
To ensure the monitoring has minimal impact over time, rocks are not overturned or<br />
disturbed. Selected specimens are collected for identification and preservation in a reference<br />
collection.<br />
The Bembicium populations are likely to comprise of three separate species: Bembicium<br />
nanum; B. melanostomum; and B. auratum. Anderson (1958) concluded these species could<br />
only be separated with difficulty in the field. This problem was compounded with the small<br />
sizes and heavy shell erosion of many individuals surveyed. As such, the species were<br />
grouped at genus level. Similarly, species from the genus Siphonaria were often too small to<br />
identify reliably in the field and were grouped as Siphonaria spp. Species were identified<br />
where possible.<br />
The shell length of 50-100 individuals of abundant species of gastropod are measured at<br />
each site. This is done to identify changes in the size structure of commonly collected<br />
species over time, which may indicate changes in population dynamics and/or impacts on<br />
populations because of illegal shellfish collection. The species selected for measurement<br />
were those that are commonly collected on intertidal shores for bait or food, such as Cellana<br />
tramoserica and Austrocochlea spp as well as non-collected but abundant species, including<br />
Siphonaria spp, Cominella lineolata and Bembicium spp. Individuals are selected<br />
haphazardly by measuring the first five individuals of each species encountered within each<br />
quadrat location. If necessary, at the end of the quadrat sampling, additional size<br />
measurements are taken from all individuals within aggregations nearest to the observer.<br />
2.2.2 Method B – Macroalgae and Sessile Invertebrates<br />
The abundance of algae and highly aggregated sessile invertebrates, such as tubeworms<br />
and mussels, is measured as proportional cover of the substratum. This is done using a<br />
points-intersection method. The 0.5 x 0.5 m quadrat is divided into a grid of 7 x 7<br />
perpendicular wires, giving 50 regularly spaced points (including one corner). Cover is<br />
estimated by the number of points directly above each species (Figures 2.7). Selected<br />
specimens are collected for identification and preservation in a reference collection.<br />
Some species respond to changes in nutrient and freshwater inputs on <strong><strong>Victoria</strong>n</strong> intertidal<br />
reefs (e.g. Fox et al. 2000). Fluctuations in the population status of these species may<br />
10
<strong>Parks</strong> <strong>Victoria</strong> Technical Series No. 70<br />
<strong>Intertidal</strong> <strong>Reef</strong> <strong>Monitoring</strong> <strong>Program</strong><br />
indicate changes in nutrient loadings affecting MPAs or other intertidal areas. Species that<br />
may respond include the algae Ulva spp, Cladophora subsimplex, Capreolia implexia,<br />
Ceramium flaccidum, Corallina officinalis, Hormosira banksii and the tubeworm Boccardia<br />
proboscidea. The presence/absence of these species within each quadrat is recorded (if<br />
present and not detected under any points). Species recorded as present, but not recorded<br />
under any points, are only included in the analysis of species richness.<br />
2.2.3 Video/Photo Quadrats<br />
During initial surveys, a photograph was taken of the substratum and biota at each quadrat<br />
position. This was done to provide a permanent qualitative record of the biota and<br />
microhabitat conditions. The photograph was taken such that the minimum dimension is 50<br />
cm (i.e. at the scale of a quadrat). This method was not employed during recent surveys.<br />
2.2.4 Qualitative Observations<br />
At each site, observers record general observations of topography, reef structure (rugosity,<br />
relief, boulder sizes, etc.), biogenic habitat structure (Hormosira, algal turfs) and a general<br />
description of the flora and fauna. Video and photographic records are also taken at each<br />
site.<br />
For each quadrat, the substratum microhabitats present are recorded. These are classified<br />
as:<br />
(h) horizontal surface, flat, rock top;<br />
(p) rock pool;<br />
(r) rocky rubble or cobble;<br />
(s) sand; or<br />
(v) vertical surface, rock side, crevice.<br />
11
<strong>Parks</strong> <strong>Victoria</strong> Technical Series No. 70<br />
<strong>Intertidal</strong> <strong>Reef</strong> <strong>Monitoring</strong> <strong>Program</strong><br />
Figure 2.7. Quadrat with the alga Hormosira banksii and snail Bembicium nanum. The abundance of<br />
each gastropod is counted within the quadrat. The cover of macrophytes and highly aggregated<br />
animals is measured by the number of points intersecting each species on the quadrat grid.<br />
Figure 2.8. Marine biologists counting invertebrates within quadrats during intertidal reef monitoring<br />
surveys at Halfmoon Bay (Site 4112), May 2009.<br />
12
<strong>Parks</strong> <strong>Victoria</strong> Technical Series No. 70<br />
<strong>Intertidal</strong> <strong>Reef</strong> <strong>Monitoring</strong> <strong>Program</strong><br />
Table 2.3. <strong>Intertidal</strong> species in south eastern Australia surveyed using Methods A and B.<br />
Algae Sessile Invertebrates Mobile Invertebrates<br />
Algal Turf Tube Worms Limpets<br />
Galeolaria caespitosa Clypidina rugosa<br />
Blue-Green Algae<br />
Patella chapmani<br />
Rivularia sp.<br />
Cellana tramoserica<br />
Symploca sp.<br />
Patelloida alticostata<br />
Barnacles<br />
Patelloida insignis<br />
Green Algae Catomerus polymerus Patelloida latistrigata<br />
Cladophora prolifera Chthamalus antennatus Notoacmea mayi<br />
Cladophora subsimplex Chaemosipho tasmanica Notoacmea petterdi<br />
Codium spp Tesseropora rosea Notoacmea spp.<br />
Enteromorpha spp Tetraclitella purpurascens Siphonaria spp.<br />
Dictyosphaeria serica<br />
Ulva spp<br />
Snails<br />
Caulerpa spp. Bivalves Austrocochlea constricta<br />
Chaetomorpha coliformis Xenostrobus pulex Austrocochlea porcata<br />
Brachidontes rostratus Austrocochlea odontis<br />
Brown Algae Mytilus galloprovincialis Austrocochlea concamerata<br />
Chordaria cladosiphon<br />
Turbo undulatus<br />
Colpomenia sinuosa<br />
Nerita atramentosa<br />
Hormosira banksii Anemones Bembicium nanum<br />
Leathesia difformis Actinia tenebrosa Bembicium spp.<br />
Notheia anomala Aulactinia veratra Bembicium melanostomum<br />
Scytosiphon lomentaria Anthothoe albocincta Nodilittorina unifasciata<br />
Lobophora veriegata Oulactis muscosa Nodilittorina acutispira<br />
Cladostephus spongiosus<br />
Dicathais orbita<br />
Notheia anomala<br />
Lepsiella vinosa<br />
Sargassum spp.<br />
Cominella lineolata<br />
Cystophora spp<br />
Calliostoma armillata<br />
Zonaria turneriana<br />
Mitra glabra<br />
Halopteris spp<br />
Haustrum baileyanum<br />
Ectocarpus spp<br />
Phasianotrochus eximius<br />
Acrocarpia paniculata<br />
Pterynotus triformis<br />
Lobophora variegata<br />
Cypraea angustata<br />
Padina sp.<br />
Batillaria australis<br />
Red Algae<br />
Corallina officinalis<br />
Gracilaria spp.<br />
Laurencia spp.<br />
Encrusting coraline algae<br />
Erect coralline algae<br />
Jania spp.<br />
Haliptilon roseum<br />
Echinothamnion sp.<br />
Heterosiphonia muelleri<br />
Caulocystis cephalornithos<br />
Seagrass<br />
Heterozostera nigricaulis<br />
Zostera meulleri<br />
Amphibolis antarctica<br />
Sarcocornia quinqueflora<br />
Sea stars<br />
Parvulastra exigua<br />
Meridiastra calcar<br />
Tosia australis<br />
Coscinasterias muricata<br />
Sea Slugs<br />
Onchidella patelloides<br />
Sea Hares<br />
Aplysia gigantea<br />
Crabs<br />
Cyclograpsus granulosus<br />
Paragrapsus gaimardii<br />
Plagusia chabrus<br />
Nudibranchs<br />
Pteraeolidia ianthina<br />
13
<strong>Parks</strong> <strong>Victoria</strong> Technical Series No. 70<br />
<strong>Intertidal</strong> <strong>Reef</strong> <strong>Monitoring</strong> <strong>Program</strong><br />
a. b.<br />
c. d.<br />
e. f.<br />
Figure 2.9. Examples of typical flora and fauna on intertidal reefs: (a) the brown alga Hormosira<br />
banksii; (b) the common limpet Cellana tramoserica; (c) the limpets Siphonaria spp (centre) and<br />
Notoacmea mayi; (d) the gastropods Bembicium nanum (bottom) and Austrocochlea constricta; (e) the<br />
gastropods Cominella lineolata (top) and Dicathais orbita; and (f) the anemone Aulactinia veratra and<br />
the green alga Ulva spp in standing water.<br />
14
<strong>Parks</strong> <strong>Victoria</strong> Technical Series No. 70<br />
<strong>Intertidal</strong> <strong>Reef</strong> <strong>Monitoring</strong> <strong>Program</strong><br />
2.3 Data Analysis<br />
2.3.1 Community Structure<br />
Community structure is a multivariate function of both the type of species present and the<br />
abundance of each species. The community structure between pairs of samples was<br />
compared using the Bray-Curtis dissimilarity coefficient. This index compares the abundance<br />
of each species between two samples to give a single value of the difference between the<br />
samples, expressed as a percentage (Faith et al. 1987; Clarke 1993).<br />
Following Sweatman (2000), the counts data were log transformed and percent cover values<br />
were transformed using the empirical logit transformation (McCullagh and Nelder 1989).<br />
The multivariate information in the dissimilarity matrix was simplified and depicted using nonmetric<br />
multidimensional scaling (MDS; Clarke 1993). This ordination method finds the<br />
representation in fewer dimensions that best depicts the actual patterns in higher<br />
dimensions. The MDS results were then depicted graphically to show differences between<br />
the replicates at each location. The distance between points on the MDS plot is<br />
representative of the relative difference in community structure. Data for all intertidal sites<br />
and times were included to put relative changes within sites into perspective of all observed<br />
changes.<br />
Kruskall stress is an indicator statistic calculated during the ordination process and indicates<br />
the degree of disparity between the reduced dimensional data set and the original hyperdimensional<br />
data set. A guide to interpreting the Kruskal stress indicator is given by Clarke<br />
(1993): (< 0.1) a good ordination with no real risk of drawing false inferences; (< 0.2) can<br />
lead to a usable picture, although for values at the upper end of this range there is potential<br />
to mislead; and (> 0.2) likely to yield plots which can be dangerous to interpret.<br />
2.3.2 Species Diversity<br />
Species diversity involves the consideration of two components: species richness and<br />
evenness. Species richness is the number of species present in the community while<br />
evenness is the degree of similarity of abundances between species. If all species in a<br />
community have similar abundances, then the community has a high degree of evenness. If<br />
a community has most of the individuals belonging to one species, it has low evenness.<br />
Species diversity is a combination of species richness and the relative abundance of each<br />
species, and is often referred to as species heterogeneity. Measures of diversity give an<br />
indication of the likelihood that two individuals selected at random from a community are<br />
different species.<br />
15
<strong>Parks</strong> <strong>Victoria</strong> Technical Series No. 70<br />
<strong>Intertidal</strong> <strong>Reef</strong> <strong>Monitoring</strong> <strong>Program</strong><br />
Species richness (S) was enumerated by the total species count per site, including both the<br />
abundance data and the presence data. Species richness from just the abundance data was<br />
used for calculation of evenness and heterogeneity statistics. Species diversity (i.e.<br />
heterogeneity among species) was described using the reciprocal of Simpson’s index<br />
(1/D Simpson = Hill’s N 2 ). This index provides more weighting for common species, as opposed<br />
to the weighting of rarer species such as by the Shannon-Weiner Index (Krebs 1999). The<br />
weighting of common species was considered more appropriate for this study, with the<br />
sampling being directed more towards the enumeration of common species rather than rarer<br />
ones.<br />
2.3.3 Species Populations<br />
The abundances of each species were summarised by calculating the mean density per<br />
quadrat (0.25 m -2 ) for each site and survey. The abundance of common species, such as<br />
Austrocochlea spp and Cellana tramoserica, were examined using time series plots.<br />
Abundance was not compared for the initial survey because of differences in survey<br />
methods. The sizes of common species were assessed using time series plots of mean<br />
lengths.<br />
2.4 Condition Indicators<br />
The monitoring data were used in various ways to provide indicators of reef quality. The<br />
development of condition indicators followed the approaches of Stuart-Smith et al. (2008)<br />
and Porter and Wescott (in press). The indicators are grouped into the categories:<br />
biodiversity; introduced species; ecosystem function; climate change; fishing and harvesting;<br />
trampling; and environment.<br />
Biodiversity<br />
Biodiversity was indicated by community structure; species richness and species diversity, as<br />
described in the previous sections.<br />
Introduced Species<br />
Indicators of introduced species were:<br />
the percentage of species that are introduced;<br />
the percentage of the total abundance of introduced species; and<br />
the presence of selected invasive pest species.<br />
No introduced species have been observed during the IRMP surveys.<br />
16
<strong>Parks</strong> <strong>Victoria</strong> Technical Series No. 70<br />
<strong>Intertidal</strong> <strong>Reef</strong> <strong>Monitoring</strong> <strong>Program</strong><br />
Ecosystem Function and Processes<br />
Biogenic habitat and standing stocks of primary producers was indicated by the average<br />
percent cover of the seaweeds:<br />
Hormosira banksii;<br />
erect coralline algae; and<br />
algal turfs.<br />
Ecosystem function was also indicated by abundances of other trophic groups:<br />
the total abundance of grazers; and<br />
the total abundance of predators.<br />
Other indicators of ecosystem function, including habitat height zonation indices, are being<br />
developed.<br />
Climate Change<br />
In <strong>Victoria</strong>, it is predicted that climate change will cause an influx of species associated with<br />
strengthening of warmer current flows, such as the East Australia Current and the Leeuwin<br />
Current (which becomes the South Australia Current). Indicators of the effects of climate<br />
change were:<br />
the percentage of species at the site that were typically from adjacent bioregions; and<br />
the percentage of total abundance of species that were typically from adjacent<br />
bioregions.<br />
No species typically of adjacent bioregions were detected during this survey.<br />
Climate change is also likely to influence the height zonation of habitats. Indices for this<br />
component are being developed.<br />
Fishing and Harvesting<br />
On intertidal rocky shores, gastropods are harvested for food, bait and other uses.<br />
Harvesting may reduce abundances and may also change the size distribution of a<br />
population, through the selective collection of larger individuals.<br />
Indicators of harvesting were the abundances and sizes (mean and proportion of large<br />
individuals) of gastropod species targeted by collectors (Porter and Wescott, in press):<br />
variegated limpet Cellana tramoserica;<br />
ribbed top snail Austrocochlea constricta;<br />
zebra top snail Austrocochlea porcata;<br />
17
<strong>Parks</strong> <strong>Victoria</strong> Technical Series No. 70<br />
<strong>Intertidal</strong> <strong>Reef</strong> <strong>Monitoring</strong> <strong>Program</strong><br />
warrener Turbo undulatus; and<br />
cart-rut whelk Dicathais orbita.<br />
Environment<br />
Indicators of environment quality were:<br />
ratio of algae cover to grazer abundance;<br />
the total abundance of species indicative of nutrient loading (i.e. Ulva, Enteromorpha and<br />
Cladophora species);<br />
percentage cover of sediment; and.<br />
the height zonation of habitats (this Indicator is being developed).<br />
18
<strong>Parks</strong> <strong>Victoria</strong> Technical Series No. 70<br />
<strong>Intertidal</strong> <strong>Reef</strong> <strong>Monitoring</strong> <strong>Program</strong><br />
3 POINT COOKE MARINE SANCTUARY<br />
3.1 Site Description and Transect Layout<br />
3.1.1 Point Cooke Marine Sanctuary (Site 4107)<br />
The intertidal area at Point Cooke is an extensive basalt rock platform and basalt boulder<br />
and cobble field. The Point Cooke Marine Sanctuary also forms part of a RAMSAR site and<br />
contributes habitat for migratory shorebirds. The intertidal area is 300-400 m long, extending<br />
from just north of Point Cooke to the south and west. Patches of sand and intertidal seagrass<br />
Zostera muelleri occur predominantly across the north-eastern section of the intertidal area,<br />
with more continuous patches of reef occurring further south and west. The intertidal reef is<br />
generally flat. However, small undulations across the reef mean that tidal inundation does not<br />
occur evenly across the reef. Strong southerly winds often cause large amounts of subtidal<br />
drift algae to be washed onto the intertidal reef area.<br />
The survey site was established on the largest continuous area of reef to the west of Point<br />
Cooke (Figure 3.1). Both the high-shore and low-shore baselines were 100 m long and were<br />
approximately parallel. During the second survey (May 2004), a large amount of drift algae<br />
was present along the high shore covering a substantial area of intertidal reef. The five<br />
transects between the baselines and were between 30 m and 35 m long.<br />
3.1.2 Altona Reference (Site 4108)<br />
A nearby reference site, with intertidal habitat similar to that at Point Cooke could not be<br />
found. The intertidal area at Altona was established in 2003 as a reference site for Point<br />
Cooke Marine Sanctuary. The intertidal monitoring site at Williamstown (Site 4110; Section<br />
4.1.2) may also be used as a long-term reference site for Point Cooke.<br />
The intertidal area at Altona consists of basalt reef and boulder fields interspersed with sand<br />
and seagrass flats (Figure 3.2). The survey site was established on a relatively large and<br />
continuous area of solid basalt reef and basalt boulders directly adjacent to large patches of<br />
sand and seagrass. The intertidal reef is generally flat with most variation in substratum<br />
height occurring at the level of individual boulders rather than across the shore. Most<br />
boulders in the survey area are substantially bigger (approximately 20-40 cm diameter) than<br />
those occurring at Point Cooke. Consequently, there are a large number of crevices and a<br />
substantial area of vertical substratum on the sides of boulders. The survey site has an<br />
estuarine influence because of its proximity to Kororoit Creek.<br />
19
<strong>Parks</strong> <strong>Victoria</strong> Technical Series No. 70<br />
<strong>Intertidal</strong> <strong>Reef</strong> <strong>Monitoring</strong> <strong>Program</strong><br />
a.<br />
b.<br />
Figure 3.1. <strong>Intertidal</strong> reef habitat at Point Cooke Marine Sanctuary: (a) 1 June 2007; and (b) 29 April<br />
2009.<br />
20
<strong>Parks</strong> <strong>Victoria</strong> Technical Series No. 70<br />
<strong>Intertidal</strong> <strong>Reef</strong> <strong>Monitoring</strong> <strong>Program</strong><br />
Figure 3.2. <strong>Intertidal</strong> reef at the Altona reference site, 27 April 2009.<br />
21
<strong>Parks</strong> <strong>Victoria</strong> Technical Series No. 70<br />
<strong>Intertidal</strong> <strong>Reef</strong> <strong>Monitoring</strong> <strong>Program</strong><br />
3.2 Community Structure<br />
The mobile invertebrate community at Point Cooke (4107) was dominated by herbivorous<br />
gastropods, particularly the top snail Austrocochlea porcata and conniwink Bembicium spp.<br />
Commonly found species at the reference Altona site (Site 4108) were A. porcata and limpet<br />
Cellana tramoserica<br />
The MDS analysis of mobile invertebrate communities showed similar variation through time<br />
at Point Cooke and Altona. The communities at these two sites were more similar to each<br />
other than they were to sites on the open coast, but relatively dissimilar to each other<br />
compared to other sites in northern Port Phillip Bay (Figure 3.3a). Their separation may<br />
reflect the relatively low abundance of C. tramoserica at Point Cooke.<br />
The algal and aggregating sessile invertebrate community at Point Cooke was largely<br />
composed of green algae Ulva spp and seagrass Zostera muelleri, with filamentous red<br />
algae also being common. At Altona, the community was composed of similar species: Ulva<br />
spp; Symploca; and calcareous tube-worm Galeolaria caespitosa. No seagrass was present<br />
within the study area at Altona.<br />
The MDS analysis of percent cover showed relatively slight variation through time at Point<br />
Cooke. The Altona reference site had higher temporal variation, which was related to an<br />
ephemeral coverage of sea lettuce Ulva spp and the green alga Enteromorpha spp . The<br />
algal communities at these sites were generally more similar to each other than to other sites<br />
in Central <strong>Victoria</strong> (Figure 3.3b).<br />
22
<strong>Parks</strong> <strong>Victoria</strong> Technical Series No. 70<br />
<strong>Intertidal</strong> <strong>Reef</strong> <strong>Monitoring</strong> <strong>Program</strong><br />
a. Point Cooke MS<br />
Sanctuary<br />
Reference<br />
b. Point Cooke MS<br />
Sanctuary<br />
Reference<br />
Figure 3.3. Two dimensional MDS plot of invertebrate assemblages on intertidal reefs at Point Cooke,<br />
within the Point Cooke MS, and the Altona reference site. (a) Mobile Invertebrates, Kruskal<br />
stress = 0.17 and (b) Macroalgae and Aggregating Sessile Invertebrates, Kruskal stress = 0.08. The<br />
grey lines represent data from all other intertidal sites used in the MDS analysis.<br />
23
<strong>Parks</strong> <strong>Victoria</strong> Technical Series No. 70<br />
<strong>Intertidal</strong> <strong>Reef</strong> <strong>Monitoring</strong> <strong>Program</strong><br />
3.3 Diversity<br />
Mobile invertebrate species richness at Point Cooke MS (Site 4107) was highest in 2009,<br />
increasing from 7 to 15 species, before returning to 8 in 2010 (Figure 3.4). Mobile<br />
invertebrate species richness was relatively stable at the reference site Altona (Site 4108;<br />
Figure 3.4).<br />
Algal and aggregating sessile invertebrate species richness ranged between 7 and 11<br />
species at Point Cooke (Site 4107; Figure 3.5). Species richness at Altona (Site 4108) was<br />
much more variable over time, varying between 1 and 13 species over the monitoring period<br />
(Figure 3.5).<br />
Mobile Invertebrate species diversity at Point Cooke (Site 4107) and the reference site<br />
Altona (Site 4108) remained relatively stable throughout the monitoring period (Figure 3.6).<br />
Algal and aggregating sessile invertebrate species diversity was also generally stable during<br />
the monitoring period with the exception of a decrease at Altona in 2009, when only one<br />
species was observed (Figure 3.7).<br />
Species richness and diversity levels during 2009 were among the highest observed during<br />
the monitoring period.<br />
24
<strong>Parks</strong> <strong>Victoria</strong> Technical Series No. 70<br />
<strong>Intertidal</strong> <strong>Reef</strong> <strong>Monitoring</strong> <strong>Program</strong><br />
Mobile Invertebrate Species Richness<br />
Species Count<br />
0 5 10 15<br />
MS<br />
Reference<br />
2004 2005 2006 2007 2008 2009 2010 2011<br />
Year<br />
Figure 3.4. Mobile invertebrate species richness at Point Cooke, within the Point Cooke MS, and<br />
Altona reference site.<br />
Algal and Aggregating Sessile Invertebrate Species Richness<br />
Species Count<br />
0 2 4 6 8 10<br />
MS<br />
Reference<br />
2004 2005 2006 2007 2008 2009 2010 2011<br />
Year<br />
Figure 3.5. Algal and aggregating sessile invertebrate species richness of intertidal sites at Point<br />
Cooke, within the Point Cooke MS, and the Altona reference site.<br />
25
<strong>Parks</strong> <strong>Victoria</strong> Technical Series No. 70<br />
<strong>Intertidal</strong> <strong>Reef</strong> <strong>Monitoring</strong> <strong>Program</strong><br />
Mobile Invertebrate Species Diversity<br />
Hills N2 N2<br />
0.0 0.5 1.0 1.5<br />
MS<br />
Reference<br />
2004 2005 2006 2007 2008 2009 2010 2011<br />
Year<br />
Figure 3.6. Mobile invertebrate diversity (Hills N 2 ) of intertidal sites at Point Cooke, within the Point<br />
Cooke MS, and the Altona reference site.<br />
Algal and Aggregating Sessile Invertebrate Species Diversity<br />
Hills N2 N2<br />
0.0 1.0 2.0 3.0<br />
MS<br />
Reference<br />
2004 2005 2006 2007 2008 2009 2010 2011<br />
Year<br />
Figure 3.7. Algal and aggregating sessile invertebrate diversity (Hill’s N 2 ) of intertidal sites at Point<br />
Cooke, within the Point Cooke MS, and the Altona reference site.<br />
26
<strong>Parks</strong> <strong>Victoria</strong> Technical Series No. 70<br />
<strong>Intertidal</strong> <strong>Reef</strong> <strong>Monitoring</strong> <strong>Program</strong><br />
3.4 Macroalgae and Aggregating Sessile Invertebrates<br />
In April 2005, a large proportion (nearly 60 %) of the Point Cooke intertidal reef was covered<br />
with Ulva spp, evenly spread across the survey area (Figure 3.8). Coverage in subsequent<br />
surveys was 3-12 % (Figure 3.8). Enteromorpha spp was recorded in moderate quantities<br />
(15 %) in 2005, but has not been observed since. A previously small patch of sand and<br />
Zostera muelleri seagrass has gradually extended across a wide band of the reef and<br />
Z. muelleri covered 12 % of the study area in April 2009, increasing to more than 16% in<br />
2010. The coverage of filamentous red algae, which increased from none to almost 9 % in<br />
2007, was 3 % in 2009. Filamentous red algae were not observed during the 2010 survey.<br />
High amounts of drift macroalgae were observed in 2004, but were not seen during<br />
subsequent surveys.<br />
Altona had much less macroalgal cover than Point Cooke. No algae were recorded in the<br />
study area in May 2004. In April 2005 Ulva spp and Enteromorpha spp each covered nearly<br />
10 %, although this had disappeared by May 2007. Enteromorpha spp was not observed<br />
during subsequent surveys. Ulva spp was recorded at almost 13 % during 2009, but was not<br />
present during the 2010 survey (Figure 3.8). A low coverage of coralline algal species was<br />
also observed in the 2005, 2007 and 2010 surveys.<br />
Aggregating sessile invertebrates did not contribute greatly to the structure of either reef,<br />
although there were small patches of Galeolaria caespitosa on the low shoreline. The blue<br />
mussel Mytilis galloprovincialis was at Point Cooke in low coverage during early surveys,<br />
although it has not been recorded since 2005.<br />
Waves and currents can deposit and erode sand and shell material in the intertidal zone,<br />
periodically inundating and exposing areas of the reefs. The amount of sand inundation was<br />
similar at both sites to 2004, increasing at Point Cooke during subsequent surveys.<br />
27
<strong>Parks</strong> <strong>Victoria</strong> Technical Series No. 70<br />
<strong>Intertidal</strong> <strong>Reef</strong> <strong>Monitoring</strong> <strong>Program</strong><br />
Ulva Ulva<br />
spp.<br />
spp<br />
Percent Cover<br />
0 10 30 50<br />
MS<br />
Reference<br />
2004 2005 2006 2007 2008 2009 2010 2011<br />
Year<br />
Figure 3.8 Mean density (± Standard Error) of Ulva spp. at Point Cooke, within the Point Cooke MS,<br />
and the Altona reference site.<br />
3.5 Mobile Invertebrates<br />
Mobile invertebrates were consistently lower in density at Point Cooke than Altona. Most<br />
mobile invertebrates occurred in greater abundances in the lower areas of the shore.<br />
The herbivorous gastropod Austrocochlea porcata was the most abundant invertebrate at<br />
both sites. Initially, A. porcata occurred at much higher densities at Altona, however, there<br />
have been consistent and substantial increases in its abundance at Point Cooke over time<br />
and more recent increase at Altona (Figure 3.9a). Abundances of A. porcata were at their<br />
highest at both sites during 2009 and 2010.<br />
The conniwink Bembicium spp were consistently present in low densities at Altona and only<br />
sporadically present at Point Cooke. There were marked increases in 2010, with a four-fold<br />
increase at Altona (Figure 3.9b).<br />
The limpet Cellana tramoserica was only recorded at Point Cooke during the 2007 survey,<br />
but has been consistently present at Altona in low abundances. Higher densities were<br />
present at Altona in 2004 and 2010 (Figure 3.9c).<br />
A slight declining trend in mean size of Austrocochlea porcata was apparent for Point Cooke<br />
and Altona (Figure 3.10a), however these have not been tested statistically. The mean size<br />
of Cellana tramoserica was relatively constant at both sites up to 2009. In 2009, size<br />
increased slightly at Point Cooke in 2010 but had declined markedly at Altona (Figure 3.10b).<br />
28
<strong>Parks</strong> <strong>Victoria</strong> Technical Series No. 70<br />
<strong>Intertidal</strong> <strong>Reef</strong> <strong>Monitoring</strong> <strong>Program</strong><br />
The warrener Turbo undulatus was recorded in low densities on the low shore at Point<br />
Cooke. Turbo undulatus was only recorded at Altona, at low density, in 2005.<br />
The carnivorous gastropods Cominella lineolata and Lepsiella vinosa occurred at Altona in<br />
similar densities to those found at Point Cooke. Densities of C. lineolata were higher at Point<br />
Cooke, although still recorded at low densities. Lepsiella vinosa was absent during 2009 at<br />
both sites, occurring again in low numbers during the 2010 survey.<br />
The seastar Parvulastra exigua occurred on the seaward edge of the intertidal reef at Altona<br />
in low densities during surveys 2004 and 2005. The abundance of Parvulastra exigua<br />
increased substantially at Altona between 2005 and 2007, with a decreasing trend to 2009<br />
and 2010. This species was not recorded at Point Cooke during any of the surveys.<br />
29
<strong>Parks</strong> <strong>Victoria</strong> Technical Series No. 70<br />
<strong>Intertidal</strong> <strong>Reef</strong> <strong>Monitoring</strong> <strong>Program</strong><br />
a.<br />
Austrocochlea porcata<br />
Density (per quadrat)<br />
0 10 20 30 40 50<br />
MS<br />
Reference<br />
b.<br />
2004 2005 2006 2007 2008 2009 2010 2011<br />
Year<br />
Bembicium Bembicium spp.<br />
spp.<br />
Density (per quadrat)<br />
0 2 4 6<br />
MS<br />
Reference<br />
c.<br />
2004 2005 2006 2007 2008 2009 2010 2011<br />
Year<br />
Cellana tramoserica<br />
Density (per quadrat)<br />
0 1 2 3 4<br />
MS<br />
Reference<br />
2004 2005 2006 2007 2008 2009 2010 2011<br />
Year<br />
Figure 3.9. Mean density (± Standard Error) of: (a) the top shell Austrocochlea porcata; (b) the<br />
conniwink Bembicium spp.; and (c) the limpet Cellana tramoserica at Point Cooke, within the Point<br />
Cooke MS, and the Altona reference site.<br />
30
<strong>Parks</strong> <strong>Victoria</strong> Technical Series No. 70<br />
<strong>Intertidal</strong> <strong>Reef</strong> <strong>Monitoring</strong> <strong>Program</strong><br />
a.<br />
Austrocochlea porcata<br />
Length (mm)<br />
0 5 10 15 20<br />
MS<br />
Reference<br />
b.<br />
2004 2005 2006 2007 2008 2009 2010 2011<br />
Year<br />
Cellana tramoserica<br />
Length (mm)<br />
0 10 20 30 40 50<br />
MS<br />
Reference<br />
2004 2005 2006 2007 2008 2009 2010 2011<br />
Year<br />
Figure 3.10. Mean sizes (± Standard Error) of: (a) the top shell Austrocochlea constricta; and (b) the<br />
limpet Cellana tramoserica at Point Cooke, and the Altona reference site.<br />
3.6 Condition Indicators<br />
Biodiversity<br />
Community composition was within the range of states and changes previously observed.<br />
Species richness and diversity levels were among the highest recorded for the monitoring<br />
program.<br />
Introduced Species<br />
There were no introduced species detected for these sites.<br />
31
<strong>Parks</strong> <strong>Victoria</strong> Technical Series No. 70<br />
<strong>Intertidal</strong> <strong>Reef</strong> <strong>Monitoring</strong> <strong>Program</strong><br />
Ecosystem Function<br />
Total algal cover has been low and relatively steady for the past three surveys at both sites<br />
(Figure 3.11a). Erect coralline algal cover and turfing algae were low and variable in cover<br />
over the monitoring period (Figure 3.11b and 3.11c). The total abundance of grazers and<br />
predators increased to 2009 and remained high to 2010 (Figure 3.12a and 3.12b). There was<br />
no apparent relationship between plant cover and grazer density.<br />
Climate Change<br />
There were no new species detected that were typically from adjacent bioregions.<br />
Harvesting<br />
Densities of Austrocochlea porcata have been increasing at both sites. A slight declining<br />
trend in mean size of Austrocochlea porcata was apparent for Point Cooke and Altona,<br />
however these have not been tested statistically. The mean size of Cellana tramoserica was<br />
relatively constant until a slight increase at Point Cooke and marked decline at Altona in<br />
2010. These results did not provide clear indications of changes in harvesting pressure.<br />
Trampling<br />
The Hormosira banksii is naturally low in cover at these sites.<br />
Environment<br />
The cover of green algal species indicative of nutrient loading was relatively low from 2007 to<br />
2010 (Figure 3.13a). As noted above, there was a bloom of Ulva at Point Cooke during 2005.<br />
Sediment cover has been considerably higher at Point Cooke during the last three surveys<br />
and similar levels were observed at Altona during the last two surveys (Figure 3.13b).<br />
32
<strong>Parks</strong> <strong>Victoria</strong> Technical Series No. 70<br />
<strong>Intertidal</strong> <strong>Reef</strong> <strong>Monitoring</strong> <strong>Program</strong><br />
a.<br />
Total Algae Cover<br />
Percent Cover<br />
0 20 40 60 80<br />
MS<br />
Reference<br />
b.<br />
2004 2005 2006 2007 2008 2009 2010 2011<br />
Year<br />
Erect Coralline Algae Cover<br />
Percent Cover<br />
0.0 0.5 1.0 1.5<br />
MS<br />
Reference<br />
c.<br />
2004 2005 2006 2007 2008 2009 2010 2011<br />
Year<br />
Turf Algae Cover<br />
Percent Cover<br />
0.0 0.5 1.0 1.5 2.0<br />
MS<br />
Reference<br />
2004 2005 2006 2007 2008 2009 2010 2011<br />
Year<br />
Figure 3.11. Mean cover (± Standard Error) of: (a) all algae; (b) erect coralline algae; and (c) turfing<br />
algae at Point Cooke, within the Point Cooke MS, and the Altona reference site.<br />
33
<strong>Parks</strong> <strong>Victoria</strong> Technical Series No. 70<br />
<strong>Intertidal</strong> <strong>Reef</strong> <strong>Monitoring</strong> <strong>Program</strong><br />
a.<br />
Total Grazers<br />
Density (per quadrat)<br />
0 10 20 30 40 50 60<br />
MS<br />
Reference<br />
b.<br />
2004 2005 2006 2007 2008 2009 2010 2011<br />
Year<br />
Total Predators<br />
Density (per quadrat)<br />
0.0 0.5 1.0 1.5<br />
MS<br />
Reference<br />
2004 2005 2006 2007 2008 2009 2010 2011<br />
Year<br />
Figure 3.12. Mean abundance (± Standard Error) of: (a) all grazers; and (b) all predators at Point<br />
Cooke, within the Point Cooke MS, and the Altona reference site.<br />
34
<strong>Parks</strong> <strong>Victoria</strong> Technical Series No. 70<br />
<strong>Intertidal</strong> <strong>Reef</strong> <strong>Monitoring</strong> <strong>Program</strong><br />
a.<br />
Green Algae Cover<br />
Percent Cover<br />
0 20 40 60 80<br />
MS<br />
Reference<br />
b.<br />
2004 2005 2006 2007 2008 2009 2010 2011<br />
Year<br />
Sediment Cover<br />
Percent Cover<br />
0 10 20 30 40<br />
MS<br />
Reference<br />
2004 2005 2006 2007 2008 2009 2010 2011<br />
Year<br />
Figure 3.13. Mean cover (± Standard Error) of: (a) green algae Ulva, Enteromorpha and Cladophora<br />
species; and (b) sediment at Point Cooke, in Point Cooke MS, and the Altona reference site.<br />
35
<strong>Parks</strong> <strong>Victoria</strong> Technical Series No. 70<br />
<strong>Intertidal</strong> <strong>Reef</strong> <strong>Monitoring</strong> <strong>Program</strong><br />
4 JAWBONE MARINE SANCTUARY<br />
4.1 Site Description and Transect Layout<br />
4.1.1 Jawbone Marine Sanctuary (Site 4109)<br />
There is an extensive area of fractured basalt reef and boulder field at Jawbone Marine<br />
Sanctuary (Site 4109). The reef forms a band up to 30 m wide and extends for several<br />
hundred metres from the point at Jawbone, to the southwest boundary of the Sanctuary. The<br />
large basalt boulders create medium to high relief intertidal reef with considerable habitat<br />
structure because of the large amount of vertical substratum and crevices (Figure 4.1). The<br />
intertidal reef at Jawbone Marine Sanctuary has a large estuarine influence because of the<br />
proximity of Kororoit Creek and there is an area of mangrove and salt marsh habitat at the<br />
eastern end of the sanctuary. This area is also a RAMSAR site and is an important habitat<br />
for migratory shorebirds.<br />
The survey site was established on a continuous area of reef. The high-shore and low-shore<br />
baselines were 100 m in length and were parallel to shore. The five transects placed<br />
between the baselines were 6-18 m in length.<br />
4.1.2 Williamstown Reference (Site 4110)<br />
The reference site for the Jawbone Marine Sanctuary was intertidal reef at Point Gellibrand,<br />
Williamstown (site 4110). As at the Jawbone Marine Sanctuary, the intertidal area is a<br />
fractured basalt reef and boulder field. However, the boulders were smaller at Williamstown<br />
and consequently there was less vertical structure and fewer crevices (Figure 4.2). The<br />
intertidal reef has a south-westerly aspect.<br />
The high-shore baseline was 62 m. The low-shore baseline was 100 m in length. The five<br />
transects established were 30-44 m in length.<br />
36
<strong>Parks</strong> <strong>Victoria</strong> Technical Series No. 70<br />
<strong>Intertidal</strong> <strong>Reef</strong> <strong>Monitoring</strong> <strong>Program</strong><br />
Figure 4.1. <strong>Intertidal</strong> reef at Jawbone Marine Sanctuary, 3 May 2007.<br />
Figure 4.2. <strong>Intertidal</strong> reef at the Williamstown reference site, 30 April 2009.<br />
37
<strong>Parks</strong> <strong>Victoria</strong> Technical Series No. 70<br />
<strong>Intertidal</strong> <strong>Reef</strong> <strong>Monitoring</strong> <strong>Program</strong><br />
4.2 Community Structure<br />
The mobile invertebrate community at Jawbone (4109) was largely composed of the top snail<br />
Austrocochlea porcata and limpet Cellana tramoserica. Commonly founds species at the<br />
reference Williamstown (Site 4110) were Austrocochlea porcata and conniwink Bembicium<br />
spp. The MDS analysis showed similar variation throughout time at both Jawbone and the<br />
reference Williamstown site (Figure 4.3a).<br />
The algal and aggregating sessile invertebrate community structure differed at Jawbone and<br />
the reference Williamstown site. The Jawbone assemblage consisted of predominantly green<br />
algae Ulva spp, algal turf and the calcareous tube-worm Galeolaria caespitose. In contrast,<br />
the cover at Williamstown was mostly the plant Hormosira banksii. The MDS analysis<br />
reflected the differences in these sites, placing the two sites in different clusters (Figure<br />
4.3b). The Jawbone site had greater variation throughout the monitoring period.<br />
4.3 Diversity<br />
The species richness of mobile invertebrate species was relatively stable at Jawbone and<br />
more variable over time at Williamstown (Figure 4.4). Species richness at Jawbone was<br />
higher in 2010 than previously recorded.<br />
Algal and aggregating sessile invertebrate species richness at Jawbone (Site 4009) has<br />
steadily increased from 6 species per site from the first survey in 2004 to 14 species in 2010<br />
(Figure 4.5b). Species richness at Williamstown was highly variable (Figure 4.5).<br />
Mobile invertebrate species diversity, in terms of Hills N 2 , was relatively constant at both<br />
sites, with levels consistently higher at Jawbone than Williamstown (Figure 4.6).<br />
Algal and aggregating sessile invertebrate species diversity was relatively stable and similar<br />
between sites up to 2007. In 2009 and 2010 there was a distinct upward trend at Jawbone<br />
and a decrease at Williamstown (Figure 4.7).<br />
38
<strong>Parks</strong> <strong>Victoria</strong> Technical Series No. 70<br />
<strong>Intertidal</strong> <strong>Reef</strong> <strong>Monitoring</strong> <strong>Program</strong><br />
a. Jawbone MS<br />
Sanctuary<br />
Reference<br />
b. Jawbone MS<br />
Sanctuary<br />
Reference<br />
Figure 4.3. Two dimensional MDS plot of invertebrate assemblages on intertidal reefs at Jawbone,<br />
within the Jawbone MS, and the Williamstown reference site. (a) Mobile Invertebrate, Krushkal stress<br />
= 0.17 and (b) Macroalgae and Aggregating Sessile Invertebrates, Krushkal stress = 0.08. The grey<br />
lines represent data from all other intertidal sites used in the MDS analysis.<br />
39
<strong>Parks</strong> <strong>Victoria</strong> Technical Series No. 70<br />
<strong>Intertidal</strong> <strong>Reef</strong> <strong>Monitoring</strong> <strong>Program</strong><br />
Mobile Invertebrate Species Richness<br />
Species Count<br />
0 2 4 6 8 10<br />
MS<br />
Reference<br />
2004 2005 2006 2007 2008 2009 2010 2011<br />
Year<br />
Figure 4.4. Mobile invertebrate species richness at Jawbone, within the Jawbone MS, and the<br />
Williamstown reference site.<br />
Algal and Aggregating Sessile Invertebrate Species Richness<br />
Species Count<br />
0 2 4 6 8 10 14<br />
MS<br />
Reference<br />
2004 2005 2006 2007 2008 2009 2010 2011<br />
Year<br />
Figure 4.5. Algal and aggregating sessile invertebrate species richness of intertidal sites at Jawbone,<br />
within the Jawbone MS, and the Williamstown reference site.<br />
40
<strong>Parks</strong> <strong>Victoria</strong> Technical Series No. 70<br />
<strong>Intertidal</strong> <strong>Reef</strong> <strong>Monitoring</strong> <strong>Program</strong><br />
Mobile Invertebrate Species Diversity<br />
Hills N2<br />
Hills N2<br />
0.0 1.0 2.0 3.0<br />
MS<br />
Reference<br />
2004 2005 2006 2007 2008 2009 2010 2011<br />
Year<br />
Figure 4.6. Mobile invertebrate diversity (Hills N 2 ) of intertidal sites at Jawbone, within the Jawbone<br />
MS, and the Williamstown reference site.<br />
Algal and Aggregating Sessile Invertebrate Species Diversity<br />
Hills N2<br />
0 1 2 3 4<br />
MS<br />
Reference<br />
2004 2005 2006 2007 2008 2009 2010 2011<br />
Year<br />
Figure 4.7. Algal and aggregating sessile invertebrate diversity (Hill’s N 2 ) of intertidal sites at<br />
Jawbone, within the Jawbone MS, and the Williamstown reference site.<br />
41
<strong>Parks</strong> <strong>Victoria</strong> Technical Series No. 70<br />
<strong>Intertidal</strong> <strong>Reef</strong> <strong>Monitoring</strong> <strong>Program</strong><br />
4.4 Macroalgae and Aggregating Sessile Invertebrates<br />
The abundance of macroalgae and sessile invertebrates was very low at the Jawbone (Site<br />
4109). The calcareous tube-worm Galeolaria caespitosa was present at low densities, low in<br />
the intertidal zone. Turfing and coralline algae, the green algae sea lettuce Ulva spp and<br />
Codium fragile and the seagrass Zostera muelleri were present close tot he subtidal zone, at<br />
the eastern end of the study area.<br />
Macroalgal cover at Williamstown (Site 4110) was predominantly the brown alga Neptune’s<br />
necklace Hormosira banksii, which occurred in patches on the lower region of the shore. The<br />
abundance of H. banksii steadily increased at Williamstown between 2004 and 2009, from 7<br />
% to 27 % cover (Figure 4.8). Abundance remained high, but slightly lower, in 2010. Turfing<br />
algae had low coverage during 2004 to 2007, with 4 % coverage in 2010.<br />
Hormosira banksii<br />
Percent Cover<br />
0 5 10 20 30<br />
MS<br />
Reference<br />
2004 2005 2006 2007 2008 2009 2010 2011<br />
Year<br />
Figure 4.8. Mean density (± Standard Error) of Neptune’s necklace Hormosira banksii at Jawbone,<br />
within the Jawbone MS, and the Williamstown reference site.<br />
42
<strong>Parks</strong> <strong>Victoria</strong> Technical Series No. 70<br />
<strong>Intertidal</strong> <strong>Reef</strong> <strong>Monitoring</strong> <strong>Program</strong><br />
4.5 Mobile Invertebrates<br />
The mobile invertebrate population structure at Jawbone was dominated by the top shell<br />
Austrocochlea porcata, the conniwink Bembicium spp, the black nerite Nerita atramentosa<br />
and the variegated limpet Cellana tramoserica. At Williamstown, the dominant invertebrates<br />
were the herbivorous gastropods Bembicium spp and Austrocochlea porcata.<br />
Densities of Austrocochlea porcata varied slightly at Jawbone with slightly lower densities in<br />
2009 and 2010 (Figure 4.9). Densities were more variable between years at Williamstown<br />
and were at the highest recorded densities during the last two surveys (Figure 4.9a).<br />
Cellana tramoserica was consistently higher in abundance at Jawbone than Williamstown,<br />
with both sites having a near-linear decline in density from 2004 to 2009 (Figure 4.9). In<br />
2010, There was a marked increase in density at Jawbone, to highest recorded levels, but<br />
there was not an equivalent increase at Williamstown.<br />
The mean size of Austrocochlea porcata was slightly lower and more variable at Jawbone<br />
than Williamstown, however there were no major trends through time (Figure 4.10a). Mean<br />
size of Cellana tramoserica was similar between sites and constant through time (Figure<br />
3.10b).<br />
43
<strong>Parks</strong> <strong>Victoria</strong> Technical Series No. 70<br />
<strong>Intertidal</strong> <strong>Reef</strong> <strong>Monitoring</strong> <strong>Program</strong><br />
a.<br />
Austrocochlea porcata<br />
Density (per quadrat)<br />
0 5 10 15<br />
MS<br />
Reference<br />
b.<br />
2004 2005 2006 2007 2008 2009 2010 2011<br />
Year<br />
Cellana tramoserica<br />
Density (per quadrat)<br />
0 2 4 6 8 10<br />
MS<br />
Reference<br />
2004 2005 2006 2007 2008 2009 2010 2011<br />
Year<br />
Figure 4.9. Mean density (± Standard Error) of: (a) the top shell Austrocochlea porcata; and (b) the<br />
limpet Cellana tramoserica at Jawbone, within the Jawbone MS, and the Williamstown reference site.<br />
44
<strong>Parks</strong> <strong>Victoria</strong> Technical Series No. 70<br />
<strong>Intertidal</strong> <strong>Reef</strong> <strong>Monitoring</strong> <strong>Program</strong><br />
a.<br />
Austrocochlea porcata<br />
Length (mm)<br />
0 5 10 15 20<br />
MS<br />
Reference<br />
b.<br />
2004 2005 2006 2007 2008 2009 2010 2011<br />
Year<br />
Cellana tramoserica<br />
Length (mm)<br />
0 10 20 30 40<br />
MS<br />
Reference<br />
2004 2005 2006 2007 2008 2009 2010 2011<br />
Year<br />
Figure 4.10. Mean sizes (± Standard Error) of: (a) the top shell Austrocochlea porcata; and (b) the<br />
limpet Cellana tramoserica at Jawbone MS, and the Williamstown reference site.<br />
45
<strong>Parks</strong> <strong>Victoria</strong> Technical Series No. 70<br />
<strong>Intertidal</strong> <strong>Reef</strong> <strong>Monitoring</strong> <strong>Program</strong><br />
4.6 Condition Indicators<br />
Biodiversity<br />
Community composition was within the range of states and changes previously observed.<br />
Species richness and diversity levels were among the highest recorded for the monitoring<br />
program.<br />
Introduced Species<br />
There were no introduced species detected for these sites.<br />
Ecosystem Function<br />
Total algal cover has increased considerably at Williamstown with the increase in Hormosira<br />
banksii cover. There was an increase in total algal cover at Jawbone in recent years (Figure<br />
4.11a). Erect coralline algal cover and turfing algae were low and variable in cover over the<br />
monitoring period at both sites (Figure 4.11b and 4.11c). An exception was a spike in turfing<br />
cover (13 %) at Williamstown during 2007.<br />
The total abundance of grazers and predators had overlapping ranges of variation at both<br />
sites with no clear patterns or trends (Figure 4.12a and 4.12b). There was no apparent<br />
relationship between plant cover and grazer density.<br />
Climate Change<br />
There were no new species detected that were typically from adjacent bioregions.<br />
Harvesting<br />
The declining densities of C. tramoserica indicated there may have been harvesting at<br />
Jawbone and Williamstown until 2009, however this evidence is inconclusive and the<br />
declines may have been for other reasons. The subsequent increase to high densities at<br />
Jawbone indicated either improved conditions or a recruitment spike. There were no<br />
indications of increasing harvesting pressure based on mean sizes.<br />
Trampling<br />
The increase in cover of Hormosira banksii at Williamstown indicates trampling is not a<br />
constraining factor to the population.<br />
Environment<br />
The cover of green algal species indicative of nutrient loading was relatively low, < 2 %<br />
cover, at both sites during all surveys (Figure 3.13a). There was a spike in sediment cover at<br />
46
<strong>Parks</strong> <strong>Victoria</strong> Technical Series No. 70<br />
<strong>Intertidal</strong> <strong>Reef</strong> <strong>Monitoring</strong> <strong>Program</strong><br />
both sites during 2007 and coverage in 2009 and 2010 was higher than in years prior to the<br />
2007 spike (Figure 3.13b).<br />
47
<strong>Parks</strong> <strong>Victoria</strong> Technical Series No. 70<br />
<strong>Intertidal</strong> <strong>Reef</strong> <strong>Monitoring</strong> <strong>Program</strong><br />
a.<br />
Total Algae Cover<br />
Percent Cover<br />
0 5 10 20 30<br />
MS<br />
Reference<br />
b.<br />
2004 2005 2006 2007 2008 2009 2010 2011<br />
Year<br />
Erect Coralline Algae Cover<br />
Percent Cover<br />
0.0 0.5 1.0 1.5 2.0<br />
MS<br />
Reference<br />
c.<br />
2004 2005 2006 2007 2008 2009 2010 2011<br />
Year<br />
Turf Algae Cover<br />
Percent Cover<br />
0 5 10 15<br />
MS<br />
Reference<br />
2004 2005 2006 2007 2008 2009 2010 2011<br />
Year<br />
Figure 4.11. Mean cover (± Standard Error) of: (a) all algae; (b) erect coralline algae and (c) turfing<br />
algae at Jawbone MS, and the Williamstown reference site.<br />
48
<strong>Parks</strong> <strong>Victoria</strong> Technical Series No. 70<br />
<strong>Intertidal</strong> <strong>Reef</strong> <strong>Monitoring</strong> <strong>Program</strong><br />
a.<br />
Total Grazers<br />
Density (per quadrat)<br />
0 5 10 15 20<br />
MS<br />
Reference<br />
b.<br />
2004 2005 2006 2007 2008 2009 2010 2011<br />
Year<br />
Total Predators<br />
Density (per quadrat)<br />
0.00 0.10 0.20<br />
MS<br />
Reference<br />
2004 2005 2006 2007 2008 2009 2010 2011<br />
Year<br />
Figure 4.12. Mean abundance (± Standard Error) of: (a) all grazers; and (b) all predators at Jawbone,<br />
and the Williamstown reference site.<br />
49
<strong>Parks</strong> <strong>Victoria</strong> Technical Series No. 70<br />
<strong>Intertidal</strong> <strong>Reef</strong> <strong>Monitoring</strong> <strong>Program</strong><br />
a.<br />
Green Algae Cover<br />
Percent Cover<br />
0.0 1.0 2.0 3.0<br />
MS<br />
Reference<br />
b.<br />
2004 2005 2006 2007 2008 2009 2010 2011<br />
Year<br />
Sediment Cover<br />
Percent Cover<br />
0 2 4 6 8 10<br />
MS<br />
Reference<br />
2004 2005 2006 2007 2008 2009 2010 2011<br />
Year<br />
Figure 4.13. Mean cover (± Standard Error) of: (a) green algae Ulva, Enteromorpha and Cladophora<br />
species; and (b) sediment at Jawbone MS, and the Williamstown reference site.<br />
50
<strong>Parks</strong> <strong>Victoria</strong> Technical Series No. 70<br />
<strong>Intertidal</strong> <strong>Reef</strong> <strong>Monitoring</strong> <strong>Program</strong><br />
5 RICKETTS POINT MARINE SANCTUARY<br />
5.1 Site description and Transect layout<br />
5.1.1 Ricketts Point Marine Sanctuary (Site 4111)<br />
There are several sections of intertidal reef in the Ricketts Point Marine Sanctuary. The main<br />
intertidal reef is an extension of the Ricketts Point headland. This reef is approximately 60 x<br />
70 m and encompasses several different habitat types, including fractured basalt reef with<br />
outcrops and steps, cobble field habitat and areas of intertidal mud and seagrass (Figure<br />
6.1).<br />
The central region of the platform at Ricketts Point is solid basalt reef that is above the high<br />
tide mark and supports patches of the beaded glasswort Sarcocornia quinqueflora. There are<br />
also small rock pools in this central area. To the north and south of the central region are<br />
cobble field and sediment habitats. The seaward edge of the platform is fractured basalt with<br />
small boulders. Across the intertidal area there are low basalt protrusions which provide<br />
some vertical structure.<br />
The main difficulties in establishing a monitoring site at Ricketts Point were: (1) determining<br />
which of cobble field or solid basalt reef was the predominant habitat type; and (2) the<br />
irregularity in height across the intertidal platform. The monitoring site was placed on solid<br />
basalt reef at the western seaward edge of the intertidal area. The high shore baseline was<br />
40 m long and ran north-south above a rock step. Below the rock step the shore sloped away<br />
gradually. The low shore baseline was 40 m long, traversing Neptune’s necklace Hormosira<br />
banksii habitat and some shallow rock pools. There were also small basalt boulders towards<br />
the low tide mark. The five transects were between the baselines and were approximately<br />
18 m long and 7 m apart.<br />
5.1.2 Halfmoon Bay Reference (Site 4112)<br />
The reference site for Ricketts Point Marine Sanctuary was on a small area of intertidal reef<br />
at Halfmoon Bay (Site 4112). The main section of this reef is relatively flat basalt extending<br />
20 m north from a high-relief basalt outcrop. This tongue of reef is surrounded by water on<br />
three sides. The high shore baseline was placed along the eastern edge of the platform<br />
which is slightly higher than the western edge. The upper baseline was 25 m long and was<br />
laid parallel to the 30 m long lower baseline. Transects running between the baselines were<br />
approximately 10 m long and 5 m apart (Figure 6.2).<br />
51
<strong>Parks</strong> <strong>Victoria</strong> Technical Series No. 70<br />
<strong>Intertidal</strong> <strong>Reef</strong> <strong>Monitoring</strong> <strong>Program</strong><br />
Figure 5.1. <strong>Intertidal</strong> reef at Ricketts Point Marine Sanctuary, 28 April 2009.<br />
Figure 5.2. The intertidal reef monitoring reference site at Halfmoon Bay, 1 May 2009. The high-shore<br />
baseline is at the right of the reef.<br />
52
<strong>Parks</strong> <strong>Victoria</strong> Technical Series No. 70<br />
<strong>Intertidal</strong> <strong>Reef</strong> <strong>Monitoring</strong> <strong>Program</strong><br />
5.2 Community Structure<br />
The mobile invertebrate community at Ricketts Point (Site 4111) largely composed of the<br />
herbivorous gastropod Austrocochlea porcata and conniwink Bembicium spp. Commonly<br />
found species at the reference Half Moon Bay (Site 4112) were the limpet Cellana<br />
tramoserica, Patelloida alticostata and the carnivorous gastropods Lepsiella vinosa. These<br />
two sites differed in mobile invertebrate assemblage structure. Ricketts Point was closely<br />
related to other sites within Port Phillip Bay, while Half Moon Bay had affinities with both the<br />
Port Phillip Bay and the open coast sites (Figure 5.3a). The MDS analysis showed a similar<br />
amount of variation through time at both Ricketts Point and the reference Half Moon Bay site.<br />
The algal and aggregating sessile invertebrate community structure also differed between<br />
Ricketts Point and Half Moon Bay (Figure 5.3b). The Ricketts point assemblage largely<br />
consisted of the brown algae Neptune’s necklace Hormosira banksii, calcareous tube-worm<br />
Galeolaria caespitosa, Symploca and algal turf. The cover at Half Moon Bay was mainly<br />
composed of Galeolaria caespitosa, Ulva spp. and algal turf. Half Moon Bay had a greater<br />
variation throughout time than Ricketts Point (Figure 5.3b).<br />
5.3 Diversity<br />
Mobile invertebrate species richness was consistently lower at Ricketts Point than Halfmoon<br />
Bay and the temporal variations were very similar until 2009 (Figure 5.4). This pattern was<br />
different in 2010, with species richness at Ricketts Point increasing between 2009 and 2010<br />
and decreasing at Halfmoon Bay, to that of Ricketts Point (Figure 5.4).<br />
Algal and aggregating sessile invertebrate species richness was very similar at both sites for<br />
most times. The exception was in 2009, when there was a spike at Halfmoon Bay (Figure<br />
5.5).<br />
Mobile invertebrate species diversity, Hill’s N 2 , was relatively constant over time at Ricketts<br />
Point. Diversity was consistently higher at Halfmoon Bay with a decreasing and then<br />
increasing trend (Figure 5.6).<br />
Half Moon Bay (Site 4112) had dropped in 2005 after the first survey in 2004, then continued<br />
to then increase during surveys till 2010 (Figure 5.6). Species diversity at Ricketts Point (Site<br />
4111) was lower than at the reference Half Moon Bay. Diversity at Ricketts Point remained<br />
stable over time.<br />
Algal and aggregating sessile invertebrate diversity was similar in range and variability<br />
between Ricketts Point and Halfmoon Bay. (Figure 5.7).<br />
53
<strong>Parks</strong> <strong>Victoria</strong> Technical Series No. 70<br />
<strong>Intertidal</strong> <strong>Reef</strong> <strong>Monitoring</strong> <strong>Program</strong><br />
a. Ricketts MS<br />
Sanctuary<br />
Reference<br />
b. Ricketts Point MS<br />
Sanctuary<br />
Reference<br />
Figure 5.3. Two dimensional MDS plot of invertebrate assemblages on intertidal reefs at Ricketts<br />
Point, within the Ricketts Point MS, and the Half Moon Bay reference site. (a) Mobile Invertebrate,<br />
Krushkal stress = 0.17 and (b) Macroalgae and Aggregating Sessile Invertebrates, Krushkal stress =<br />
0.08. The grey lines represent data from all other intertidal sites used in the MDS analysis.<br />
54
<strong>Parks</strong> <strong>Victoria</strong> Technical Series No. 70<br />
<strong>Intertidal</strong> <strong>Reef</strong> <strong>Monitoring</strong> <strong>Program</strong><br />
Mobile Invertebrate Species Richness<br />
Species Count<br />
0 5 10 15 20<br />
MS<br />
Reference<br />
2004 2005 2006 2007 2008 2009 2010 2011<br />
Year<br />
Figure 5.4. Mobile invertebrate species richness at Ricketts Point, within the Ricketts Point MS, and<br />
the Half Moon Bay reference site.<br />
Algal and Aggregating Sessile Invertebrate Species Richness<br />
Species Count<br />
0 5 10 15<br />
MS<br />
Reference<br />
2004 2005 2006 2007 2008 2009 2010 2011<br />
Year<br />
Figure 5.5. Algal and aggregating sessile invertebrate species richness of intertidal sites at Ricketts<br />
Point, within the Ricketts Point MS, and the Half Moon Bay reference site.<br />
55
<strong>Parks</strong> <strong>Victoria</strong> Technical Series No. 70<br />
<strong>Intertidal</strong> <strong>Reef</strong> <strong>Monitoring</strong> <strong>Program</strong><br />
Mobile Invertebrate Species Diversity<br />
Hills N2<br />
0 2 4 6<br />
MS<br />
Reference<br />
2004 2005 2006 2007 2008 2009 2010 2011<br />
Year<br />
Figure 5.6. Mobile invertebrate diversity (Hills N 2 ) of intertidal sites at Ricketts Point, within the<br />
Ricketts Point MS, and the Half Moon Bay reference site.<br />
Algal and Aggregating Sessile Invertebrate Species Diversity<br />
Hills N2<br />
Hills N2<br />
0 1 2 3<br />
MS<br />
Reference<br />
2004 2005 2006 2007 2008 2009 2010 2011<br />
Year<br />
Figure 5.7. Algal and aggregating sessile invertebrate diversity (Hill’s N 2 ) of intertidal sites at Ricketts<br />
Point, within the Ricketts Point MS, and the Half Moon Bay reference site.<br />
56
<strong>Parks</strong> <strong>Victoria</strong> Technical Series No. 70<br />
<strong>Intertidal</strong> <strong>Reef</strong> <strong>Monitoring</strong> <strong>Program</strong><br />
5.4 Macroalgae and Aggregating Sessile Invertebrates<br />
The high shore area of the Ricketts Point site is exposed for long times between high tide<br />
periods resulting in a low algal coverage of the area. Macroalgal cover along the seaward<br />
edge of the Ricketts Point platform was predominantly the brown alga Neptune’s necklace<br />
Hormosira banksii. Hormosira banksii had relatively high coverage at the start of the<br />
monitoring in 2004 and during the last survey in 2010, with lower coverage in the intervening<br />
period (Figure 5.8). Small patches of the calcareous tube-worm Galeolaria caespitosa were<br />
present, occurring in higher abundance near the subtidal zone.<br />
Halfmoon Bay had less than 1 % coverage of H. banksii recorded during 2009 and no<br />
presence at other times (Figure 5.8). A patch of the blue-green algae Symploca sp. was<br />
present in 2007, although has not been recorded in subsequent surveys. The filter-feeding<br />
polychaete Galeolaria caespitosa was abundant at Halfmoon Bay from 2004 to 2007, forming<br />
patches the low shore region.<br />
Hormosira banksii<br />
Percent Cover<br />
0 5 10 15 20<br />
MS<br />
Reference<br />
2004 2005 2006 2007 2008 2009 2010 2011<br />
Year<br />
Figure 5.8. Mean density (± Standard Error) of Neptune’s necklace Hormosira banksii at Ricketts<br />
Point, within the Ricketts Point MS, and the Half Moon Bay reference site.<br />
57
<strong>Parks</strong> <strong>Victoria</strong> Technical Series No. 70<br />
<strong>Intertidal</strong> <strong>Reef</strong> <strong>Monitoring</strong> <strong>Program</strong><br />
5.5 Mobile Invertebrates<br />
At Ricketts Point (Site 4111), the limpet Cellana tramoserica was very low in abundance at<br />
all times (< 1 per quadrat; Figure 5.9a). Densities were comparatively higher at Halfmoon<br />
Bay during most surveys, however there was a rapid decline between 2009 and 2010, when<br />
densities dropped to those similar to Ricketts Point (Figure 5.8a).<br />
The gastropod Austrocochlea porcata was the most abundant mobile invertebrate at Ricketts<br />
Point, where there was a gradual decreasing trend over the monitoring period (Figure 5.8b)<br />
Abundances at Halfmoon Bay were similar in 2004 and 2005, but increased markedly to<br />
2007 and stayed relatively high thereafter (Figure 5.9b).<br />
The densities of Bembicium spp were very similar at Ricketts Point and Halfmoon Bay, with<br />
the same pattern of temporal variation (Figure 5.9c). Densities in 2010 at both sites were<br />
among the highest observed during the monitoring program.<br />
The mean size of Austrocochlea porcata was relatively constant between 2005 and 2009,<br />
with a distinct decline from 2009 to 2010 (Figure 5.12a). There was a decreasing trend in<br />
size of A. porcata at Halfmoon Bay to 2009 with a subsequent increase to 2010 (Figure<br />
5.12a).<br />
The mean size of Bembicium spp had similar patterns of temporal variation at both sites;<br />
mean sizes in 2010 were at the lower end of the range for each site in 2010 (Figure 5.12).<br />
Anemones, such as Aulactinia veratra and Actinia tenebrosa and seastars Tosia australis<br />
Meridiastra calcar and Coscinasterias muricata were present at Halfmoon Bay in small rock<br />
pools on the seaward edge of the intertidal reef.<br />
58
<strong>Parks</strong> <strong>Victoria</strong> Technical Series No. 70<br />
<strong>Intertidal</strong> <strong>Reef</strong> <strong>Monitoring</strong> <strong>Program</strong><br />
a.<br />
Cellana tramoserica<br />
Density (per quadrat)<br />
0 2 4 6 8 10 14<br />
MS<br />
Reference<br />
2004 2005 2006 2007 2008 2009 2010 2011<br />
Year<br />
b.<br />
Austrocochlea porcata<br />
Density (per quadrat)<br />
0 10 20 30 40 50<br />
MS<br />
Reference<br />
c.<br />
2004 2005 2006 2007 2008 2009 2010 2011<br />
Year<br />
Bembicium spp.<br />
Density (per quadrat)<br />
0 1 2 3 4 5 6<br />
MS<br />
Reference<br />
2004 2005 2006 2007 2008 2009 2010 2011<br />
Year<br />
Figure 5.9. Mean density (± Standard Error) of: (a) the limpet Cellana tramoserica; (b) the top shell<br />
Austrocochlea porcata; and (c) the conniwink Bembicium spp. at Ricketts Point, within the Ricketts<br />
Point MS, and the Half Moon Bay reference site.<br />
59
<strong>Parks</strong> <strong>Victoria</strong> Technical Series No. 70<br />
<strong>Intertidal</strong> <strong>Reef</strong> <strong>Monitoring</strong> <strong>Program</strong><br />
a.<br />
Austrocochlea porcata<br />
Length (mm)<br />
0 5 10 15 20<br />
MS<br />
Reference<br />
b.<br />
2004 2005 2006 2007 2008 2009 2010 2011<br />
Year<br />
Bembicium<br />
Bembicium spp.<br />
spp.<br />
Length (mm)<br />
0 5 10 15 20<br />
MS<br />
Reference<br />
2004 2005 2006 2007 2008 2009 2010 2011<br />
Year<br />
Figure 5.10. Mean sizes (± Standard Error) of: (a) the top shell Austrocochlea porcata; and (b) the<br />
conniwink Bembicium spp. at Ricketts Point, in Ricketts Point MS, and the Half Moon Bay reference<br />
site.<br />
5.6 Condition Indicators<br />
Biodiversity<br />
Community composition was within the range of states and changes previously observed.<br />
Species richness and diversity levels were among the highest recorded for the monitoring<br />
program, excepting species richness of mobile invertebrates at Halfmoon Bay (which was at<br />
its lowest).<br />
Introduced Species<br />
There were no introduced species detected for these sites.<br />
60
<strong>Parks</strong> <strong>Victoria</strong> Technical Series No. 70<br />
<strong>Intertidal</strong> <strong>Reef</strong> <strong>Monitoring</strong> <strong>Program</strong><br />
Ecosystem Function<br />
Total algal cover has generally increased at both sites from 2005 to 2010 (Figure 5.11a).<br />
Erect coralline algal cover also increased at both sites during recent years, although the<br />
coverage at both sites was very low (Figure 5.11b). Turfing algae had contrary trends<br />
between the two sites: Ricketts Point increased from low coverage between 2009 and 2010<br />
while coverage at Halfmoon Bay decreased (Figure 5.11c).<br />
The temporal variations of total grazers was similar at both sites during the first few years of<br />
monitoring. The density of grazers was relatively low at Halfmoon Bay in 2010 and relatively<br />
high at Ricketts Point (Figure 5.12a). The pattern of temporal variations was also similar<br />
between sites for predators, although predator abundance was consistently higher at<br />
Halfmoon Bay than Ricketts Point (Figure 5.12b). Predator abundances in 2010 were at<br />
levels frequently observed in previous years for each site (excepting the 2007 spike).<br />
Climate Change<br />
There were no new species detected that were typically from adjacent bioregions.<br />
Harvesting<br />
The densities of the gastropod Austrocochlea porcata and limpet Cellana tramoserica did not<br />
provide any indications of increased harvesting pressure at Ricketts Point. There were<br />
declines in density of both species at Halfmoon Bay, particularly Cellana tramoserica. The<br />
temporal patterns of mean sizes provided no indications of changes in harvesting pressure.<br />
Trampling<br />
The increase in cover of Hormosira banksii at Ricketts Point to 2010 indicates trampling is<br />
not presently a constraining factor to the population.<br />
Environment<br />
The cover of green algal species, potentially indicative of nutrient loading, was relatively low,<br />
< 2 % cover, at both sites during 2010 (Figure 5.13a). This index has been considerably<br />
variable in previous years but coverage has always been below 5 %. Sediment cover was<br />
relatively low during the monitoring period for both sites (< 2 %) throughout the monitoring<br />
period (Figure 5.13b).<br />
61
<strong>Parks</strong> <strong>Victoria</strong> Technical Series No. 70<br />
<strong>Intertidal</strong> <strong>Reef</strong> <strong>Monitoring</strong> <strong>Program</strong><br />
a.<br />
Total Algae Cover<br />
Percent Cover<br />
0 10 20 30 40<br />
MS<br />
Reference<br />
b.<br />
2004 2005 2006 2007 2008 2009 2010 2011<br />
Year<br />
Erect Coralline Algae Cover<br />
Percent Cover<br />
0.0 0.5 1.0 1.5 2.0<br />
MS<br />
Reference<br />
c.<br />
2004 2005 2006 2007 2008 2009 2010 2011<br />
Year<br />
Turf Algae Cover<br />
Percent Cover<br />
0 5 10 15 20 25<br />
MS<br />
Reference<br />
2004 2005 2006 2007 2008 2009 2010 2011<br />
Year<br />
Figure 5.11. Mean cover (± Standard Error) of: (a) all algae; (b) erect coralline algae; and (c) turfing<br />
algae at Ricketts Point, within the Ricketts Point MS, and the Half Moon Bay reference site.<br />
62
<strong>Parks</strong> <strong>Victoria</strong> Technical Series No. 70<br />
<strong>Intertidal</strong> <strong>Reef</strong> <strong>Monitoring</strong> <strong>Program</strong><br />
a.<br />
Total Grazers<br />
Density (per quadrat)<br />
0 10 30 50 70<br />
MS<br />
Reference<br />
2004 2005 2006 2007 2008 2009 2010 2011<br />
Year<br />
b.<br />
Total Predators<br />
Density (per quadrat)<br />
0 2 4 6 8<br />
MS<br />
Reference<br />
2004 2005 2006 2007 2008 2009 2010 2011<br />
Year<br />
Figure 5.12. Mean abundance (± Standard Error) of: (a) all grazers; and (b) all predators at Ricketts<br />
Point, within the Ricketts Point MS, and the Half Moon Bay reference site.<br />
63
<strong>Parks</strong> <strong>Victoria</strong> Technical Series No. 70<br />
<strong>Intertidal</strong> <strong>Reef</strong> <strong>Monitoring</strong> <strong>Program</strong><br />
a.<br />
Green Algae Cover<br />
Percent Cover<br />
0 1 2 3 4 5 6<br />
MS<br />
Reference<br />
2004 2005 2006 2007 2008 2009 2010 2011<br />
Year<br />
b.<br />
Sediment Cover<br />
Percent Cover<br />
0.0 0.5 1.0 1.5 2.0<br />
MS<br />
Reference<br />
2004 2005 2006 2007 2008 2009 2010 2011<br />
Year<br />
Figure 5.13. Mean cover (± Standard Error) of: (a) green algae (Ulva, Enteromorpha and Cladophora<br />
species); and (b) sediment, at Ricketts Point, in Ricketts Point MS, and the Half Moon Bay reference<br />
site.<br />
64
<strong>Parks</strong> <strong>Victoria</strong> Technical Series No. 70<br />
<strong>Intertidal</strong> <strong>Reef</strong> <strong>Monitoring</strong> <strong>Program</strong><br />
6 PORT PHILLIP HEADS MARINE NATIONAL PARK<br />
6.1 Site Description and Transect Layout<br />
6.1.1 Point Lonsdale (Site 2823)<br />
The intertidal reef surveyed for the Port Phillip Heads Marine National Park was located at<br />
Point Lonsdale, is on the western side of Port Phillip Heads. The extensive, triangularly<br />
shaped intertidal platform projecting south and eastwards from the Point Lonsdale headland.<br />
The calcarenite reef is predominantly very low relief, with some uneven patches as a result of<br />
exposure to strong weather and wave action. The intertidal platform is subject to a high level<br />
of trampling by the public.<br />
The survey area is on the southern expanse of reef, exposed to swell and wind from the<br />
prevailing southern quarter. Both high and low shore baselines were 100 m long, The five<br />
transects between the baselines were 50-60 m long and approximately 17 m apart.<br />
6.1.2 Cheviot Bay Reference (Site 2824)<br />
The intertidal reef is less extensive than at Point Lonsdale and is interrupted by large rock<br />
pools and tidal channels. The reef at this site is exposed to the prevailing south-westerly<br />
weather and sub-maximal wave conditions. The low relief survey area is located immediately<br />
to the east of the Point Nepean section of the Port Phillips Heads Marine National Park, with<br />
the western end of Cheviot Beach being included within the Marine Park Boundary. Special<br />
permission from the management authority (<strong>Parks</strong> <strong>Victoria</strong>) is required to access the area<br />
because of unexploded ordinance in the vicinity. The intertidal platform is consequently<br />
protected from the high levels of human trampling that occur at Point Lonsdale.<br />
The high shore baseline of the survey area followed the contour of the shore for 85 m. The<br />
low shore baseline was 100 m long and was run at a slight angle giving Transect 1 a length<br />
of 35 m compared to 52 m for Transect 5.<br />
65
<strong>Parks</strong> <strong>Victoria</strong> Technical Series No. 70<br />
<strong>Intertidal</strong> <strong>Reef</strong> <strong>Monitoring</strong> <strong>Program</strong><br />
Figure 6.1. <strong>Intertidal</strong> reef at Point Lonsdale, Port Phillip Heads Marine National Park, 12 June 2009.<br />
Figure 6.2. <strong>Intertidal</strong> reef at the Cheviot Bay reference site, 22 December 2004.<br />
66
<strong>Parks</strong> <strong>Victoria</strong> Technical Series No. 70<br />
<strong>Intertidal</strong> <strong>Reef</strong> <strong>Monitoring</strong> <strong>Program</strong><br />
6.2 Community Structure<br />
The mobile invertebrate communities at Point Lonsdale (2823) and the Cheviot Bay<br />
reference site (Site 2824) were similar (Figure 6.3a). The slit limpet Clypidina rugosa and<br />
false limpet Siphonaria spp. were prevalent at both sites. Other limpets Cellana tramoserica,<br />
Patelloida alticostata and Notoacmea spp. were also common. The conniwink Bembicium<br />
spp. was abundant at Point Lonsdale., The MDS analysis showed a similar amount of<br />
variation through time at Point Lonsdale and Cheviot Bay (Figure 6.3a).<br />
The algal and aggregating sessile invertebrate community structure was similar at Point<br />
Lonsdale and Cheviot Bay. The brown algae Neptune’s necklace Hormosira banksii was the<br />
dominant cover, with some Corallina officinalis, Ulva spp. and algal turf also present. The<br />
mat forming mussel Xenostrobus pulex occurred at low density at Point Lonsdale and was<br />
recorded infrequently at Cheviot Bay. The MDS analysis reflected the similarity in these sites,<br />
situating them close together within the same cluster. Both sites showed a similar amount of<br />
variation throughout the monitoring period (Figure 6.3b).<br />
6.3 Diversity<br />
Species richness of mobile invertebrates was relatively stable at both Pt Lonsdale (Site<br />
2823) and the reference Cheviot Bay (Site 2824; Figure 6.4).<br />
Algal and sessile invertebrate species richness at both sites increased sharply during 2005 to<br />
25 and 22 species per site respectively, before subsequently declining. Species richness at<br />
Cheviot Bay was lower in 2010 than previously recorded.<br />
Mobile invertebrate species diversity, in terms of Hills N 2 , has co-varied at Pt Lonsdale (Site<br />
2823) and Cheviot Bay (Site 2824) since the 2005 survey (Figure 6.6). The species diversity<br />
of the algal and aggregating sessile invertebrate community was low, between 1 and 2,<br />
reflecting the dominance of Hormosira banksii at these sites (Figure 6.7).<br />
67
<strong>Parks</strong> <strong>Victoria</strong> Technical Series No. 70<br />
<strong>Intertidal</strong> <strong>Reef</strong> <strong>Monitoring</strong> <strong>Program</strong><br />
a. Port Phillip Heads MNP<br />
National Park<br />
Reference<br />
b. Port Phillip Heads MNP<br />
National Park<br />
Reference<br />
Figure 6.3. Two dimensional MDS plot of invertebrate assemblages on intertidal reefs at Point<br />
Lonsdale, within the Port Phillip Heads MNP, and the Cheviot Bay reference site. (a) Mobile<br />
Invertebrate, Krushkal stress = 0.17 and (b) Macroalgae and Aggregating Sessile Invertebrates,<br />
Krushkal stress = 0.08. The grey lines represent data from all other intertidal sites used in the MDS<br />
analysis.<br />
68
<strong>Parks</strong> <strong>Victoria</strong> Technical Series No. 70<br />
<strong>Intertidal</strong> <strong>Reef</strong> <strong>Monitoring</strong> <strong>Program</strong><br />
Mobile Invertebrate Species Richness<br />
Species Count<br />
0 5 10 15<br />
MNP<br />
Reference<br />
2004 2005 2006 2007 2008 2009 2010 2011<br />
Year<br />
Figure 6.4. Mobile invertebrate species richness at Point Lonsdale within the Port Phillip Heads MNP,<br />
and the Cheviot Bay reference site.<br />
Algal and Aggregating Sessile Invertebrate Species Richness<br />
Species Count<br />
0 5 10 15 20 25<br />
MNP<br />
Reference<br />
2004 2005 2006 2007 2008 2009 2010 2011<br />
Year<br />
Figure 6.5. Algal and aggregating sessile invertebrate species richness of intertidal sites at Point<br />
Lonsdale within the Port Phillip Heads MNP, and the Cheviot Bay reference site.<br />
69
<strong>Parks</strong> <strong>Victoria</strong> Technical Series No. 70<br />
<strong>Intertidal</strong> <strong>Reef</strong> <strong>Monitoring</strong> <strong>Program</strong><br />
Mobile Invertebrate Species Diversity<br />
Hills N2<br />
0 1 2 3 4 5<br />
MNP<br />
Reference<br />
2004 2005 2006 2007 2008 2009 2010 2011<br />
Year<br />
Figure 6.6. Mobile invertebrate diversity (Hills N 2 ) of intertidal sites at Point Lonsdale within the Port<br />
Phillip Heads MNP, and the Cheviot Bay reference site.<br />
Algal and Aggregating Sessile Invertebrate Species Diversity<br />
Hills N2 N2<br />
0.0 0.5 1.0 1.5 2.0<br />
MNP<br />
Reference<br />
2004 2005 2006 2007 2008 2009 2010 2011<br />
Year<br />
Figure 6.7. Algal and aggregating sessile invertebrate diversity (Hill’s N 2 ) of intertidal sites at Point<br />
Lonsdale within the Port Phillip Heads MNP, and the Cheviot Bay reference site.<br />
70
<strong>Parks</strong> <strong>Victoria</strong> Technical Series No. 70<br />
<strong>Intertidal</strong> <strong>Reef</strong> <strong>Monitoring</strong> <strong>Program</strong><br />
6.4 Macroalgae and Aggregating Sessile Invertebrates<br />
The small change in shore height across the reef platforms at both sites, and the low relief of<br />
the reefs, resulted in a macroalgal community dominated by Neptune’s necklace Hormosira<br />
banksii. Since 2005, the cover of H. banksii was usually around 10 % higher at Point<br />
Lonsdale than Cheviot Bay; however, in 2010 cover at both sites was approximately the<br />
same, at 70 % (Figure 6.8). Coralline and turfing algae were consistently more abundant at<br />
Cheviot Bay, although they were present at only low densities, generally less than 5 %.<br />
Sand inundation was similar at these sites, generally covering between 5 % and 10 % of the<br />
reef.<br />
Hormosira banksii<br />
Percent Cover<br />
0 20 40 60 80<br />
MNP<br />
Reference<br />
2004 2005 2006 2007 2008 2009 2010 2011<br />
Year<br />
Figure 6.8. Mean density (± Standard Error) of Neptune’s necklace Hormosira banksii at Point<br />
Lonsdale within the Port Phillip Heads MNP, and the Cheviot Bay reference site.<br />
71
<strong>Parks</strong> <strong>Victoria</strong> Technical Series No. 70<br />
<strong>Intertidal</strong> <strong>Reef</strong> <strong>Monitoring</strong> <strong>Program</strong><br />
6.5 Mobile Invertebrates<br />
The invertebrate community at Point Lonsdale (Site 2823) and the reference Cheviot Bay<br />
(Site 2824) was largely composed of the slit limpet Clypidina rugosa, false limpet Siphonaria<br />
spp. variegated limpet Cellana tramoserica and conniwink Bembicium spp.<br />
Clypidina rugosa was the most abundant mobile invertebrate species at both Point Lonsdale<br />
and Cheviot Bay. Abundance of C. rugosa peaked at 51 per 0.25m 2 at Cheviot Bay in 2007.<br />
In 2010 there were 22 C. rugosa per 0.25m 2 at Cheviot Bay and 31 per 0.25m 2 at Point<br />
Lonsdale, the highest abundance recorded at this site. Siphonaria spp abundance was<br />
higher at Cheviot Bay than Point Lonsdale.<br />
The mean density of Cellana tramoserica at Point Lonsdale decreased from 15 per 0.25 m 2<br />
in 2004 to 5 per 0.25 m 2 in 2005 and has remained relatively stable since. Cheviot Bay<br />
generally had lower abundances of C. tramoserica (Figure 6.9).<br />
The conniwink Bembicium spp was more common at Point Lonsdale than Cheviot Bay.<br />
Abundance has consistently declined at Cheviot Bay since monitoring began in 2004 (Figure<br />
6.10).<br />
The mean length of Cellana tramoserica has steadily increased at Point Lonsdale over the<br />
monitoring period to a similar size at Cheviot Bay during the 2010 survey (Figure 6.10).<br />
72
<strong>Parks</strong> <strong>Victoria</strong> Technical Series No. 70<br />
<strong>Intertidal</strong> <strong>Reef</strong> <strong>Monitoring</strong> <strong>Program</strong><br />
a.<br />
Cellana tramoserica<br />
Density (per quadrat)<br />
0 5 10 15<br />
MNP<br />
Reference<br />
2004 2005 2006 2007 2008 2009 2010 2011<br />
Year<br />
b.<br />
Bembicium spp.<br />
Density (per quadrat)<br />
0 5 10 15 20 25<br />
MNP<br />
Reference<br />
2004 2005 2006 2007 2008 2009 2010 2011<br />
Year<br />
Figure 6.9. Mean density (± Standard Error) of: (a) the limpet Cellana tramoserica; and (b) the striped<br />
conniwink Bembicium spp, at Point Lonsdale within the Port Phillip Heads MNP, and the Cheviot Bay<br />
reference site.<br />
73
<strong>Parks</strong> <strong>Victoria</strong> Technical Series No. 70<br />
<strong>Intertidal</strong> <strong>Reef</strong> <strong>Monitoring</strong> <strong>Program</strong><br />
Cellana tramoserica<br />
Length (mm)<br />
0 5 10 20 30<br />
MS<br />
Reference<br />
2004 2005 2006 2007 2008 2009 2010 2011<br />
Year<br />
Figure 6.10. Mean sizes (± Standard Error) of the limpet Cellana tramoserica at Point Lonsdale within<br />
the Port Phillip Heads MNP, and the Cheviot Bay reference site.<br />
74
<strong>Parks</strong> <strong>Victoria</strong> Technical Series No. 70<br />
<strong>Intertidal</strong> <strong>Reef</strong> <strong>Monitoring</strong> <strong>Program</strong><br />
6.6 Condition Indicators<br />
Biodiversity<br />
Community composition was within the range of states and changes previously observed.<br />
Mobile invertebrate species richness was within the range previously observed. Algal and<br />
sessile invertebrate species richness was low at both the marine national park and reference<br />
sites. Mobile invertebrate diversity was also low, while algal and sessile invertebrate diversity<br />
was within the previously observed range.<br />
Introduced Species<br />
There were no introduced species detected for these sites.<br />
Ecosystem Function<br />
Total algae cover increased at both sites to 2010 after slight but steady declines since<br />
December 2004 (Figure 6.11a). Erect coralline algae and turfing algae cover were low and<br />
variable at Cheviot Bay and almost non-existent at Point Lonsdale (Figure 6.11b and 6.11c).<br />
The total abundance of grazers at Point Lonsdale was within the range previously observed.<br />
The abundance of predators was higher than previously observed.<br />
There was no apparent relationship between plant cover and grazer density.<br />
Climate Change<br />
There were no new species detected that were typically from adjacent bioregions.<br />
Harvesting<br />
Densities of Cellana tramoserica have been relatively stable at both sites since 2005. Fewer<br />
large C. tramoserica (30 mm to 50 mm) were measured in 2010 compared to 2009. This<br />
may indicate harvesting pressure on larger individuals; however it may also have arisen due<br />
to other factors, including observer error<br />
Trampling<br />
There is restricted access to the Cheviot Bay reference site and trampling pressure is<br />
negligible. Point Lonsdale is a popular location amongst the general public and there is likely<br />
to be some trampling pressure, particularly over holiday periods. However, there was no<br />
apparent impact of this trampling on the survey area, as the cover of H. banksii was<br />
generally higher at Point Lonsdale than Cheviot Bay and showed similar variation through<br />
time.<br />
75
<strong>Parks</strong> <strong>Victoria</strong> Technical Series No. 70<br />
<strong>Intertidal</strong> <strong>Reef</strong> <strong>Monitoring</strong> <strong>Program</strong><br />
Environment<br />
The cover of green algal species indicative of nutrient loading was relatively low at these<br />
sites (Figure 6.13a).<br />
Sediment cover at Point Lonsdale steadily increased from 2 % to 11 % between 2005 and<br />
2009, before dropping to 5 % to 2010 (Figure 6.13b). Sediment cover has been highly<br />
variable at the reference site (Figure 6.13b).<br />
76
<strong>Parks</strong> <strong>Victoria</strong> Technical Series No. 70<br />
<strong>Intertidal</strong> <strong>Reef</strong> <strong>Monitoring</strong> <strong>Program</strong><br />
a.<br />
Total Algae Cover<br />
Percent Cover<br />
0 20 40 60 80<br />
MNP<br />
Reference<br />
b.<br />
2004 2005 2006 2007 2008 2009 2010 2011<br />
Year<br />
Erect Coralline Algae Cover<br />
Percent Cover<br />
0 2 4 6 8<br />
MNP<br />
Reference<br />
c.<br />
2004 2005 2006 2007 2008 2009 2010 2011<br />
Year<br />
Turf Algae Cover<br />
Percent Cover<br />
0 5 10 15<br />
MNP<br />
Reference<br />
2004 2005 2006 2007 2008 2009 2010 2011<br />
Year<br />
Figure 6.11. Mean cover (± Standard Error) of: (a) all algae; (b) erect coralline algae; and (c) turfing<br />
algae at Point Lonsdale within the Port Phillip Heads MNP, and the Cheviot Bay reference site.<br />
77
<strong>Parks</strong> <strong>Victoria</strong> Technical Series No. 70<br />
<strong>Intertidal</strong> <strong>Reef</strong> <strong>Monitoring</strong> <strong>Program</strong><br />
a.<br />
Total Grazers<br />
Density (per quadrat)<br />
0 50 100 150<br />
MNP<br />
Reference<br />
b.<br />
2004 2005 2006 2007 2008 2009 2010 2011<br />
Year<br />
Total Predators<br />
Density (per quadrat)<br />
0.0 0.5 1.0 1.5 2.0<br />
MNP<br />
Reference<br />
2004 2005 2006 2007 2008 2009 2010 2011<br />
Year<br />
Figure 6.12. Mean abundance (± Standard Error) of: (a) all grazers; and (b) all predators at Point<br />
Lonsdale within the Port Phillip Heads MNP, and the Cheviot Bay reference site.<br />
78
<strong>Parks</strong> <strong>Victoria</strong> Technical Series No. 70<br />
<strong>Intertidal</strong> <strong>Reef</strong> <strong>Monitoring</strong> <strong>Program</strong><br />
a.<br />
Green Algae Cover<br />
Percent Cover<br />
0 2 4 6<br />
MNP<br />
Reference<br />
b.<br />
2004 2005 2006 2007 2008 2009 2010 2011<br />
Year<br />
Sediment Cover<br />
Percent Cover<br />
0 5 10 15<br />
MNP<br />
Reference<br />
2004 2005 2006 2007 2008 2009 2010 2011<br />
Year<br />
Figure 6.13. Mean cover (± Standard Error) of: (a) green algae (Ulva, Enteromorpha and Cladophora<br />
species); and (b) sediment at Point Lonsdale within the Port Phillip Heads MNP, and the Cheviot Bay<br />
reference site.<br />
79
<strong>Parks</strong> <strong>Victoria</strong> Technical Series No. 70<br />
<strong>Intertidal</strong> <strong>Reef</strong> <strong>Monitoring</strong> <strong>Program</strong><br />
7 MUSHROOM REEF MARINE SANCTUARY<br />
7.1 Site Description and Transect Layout<br />
7.1.1 Mushroom <strong>Reef</strong> Marine Sanctuary (Site 2907)<br />
Mushroom <strong>Reef</strong> is a basalt intertidal reef in the shape of a mushroom when observed from<br />
the air. There is a large intertidal isthmus (the stem of the mushroom) that is composed of<br />
basalt pebbles and boulders (Figure 7.1a). Sections of the isthmus tend to inundate with<br />
water soon after the tide begins to rise. The head of the mushroom is low-relief but uneven<br />
basalt reef with some pebbles and boulders (Figure 7.1b). The highest section of the reef is<br />
the centre of the head of the mushroom. This area slopes away gently to the subtidal at its<br />
outer edge. Mushroom <strong>Reef</strong> is exposed on all sides, but is protected from large swell by a<br />
shallow reef further offshore.<br />
The survey site at Mushroom <strong>Reef</strong> was positioned at the south eastern side of the head of<br />
the mushroom as this is representative of the predominant intertidal habitat. The baselines<br />
were 100 m long and parallel to shore. Transects were 40-45 m long and separated by 25 m.<br />
7.1.2 Flinders West Reference (Site 2908)<br />
The reference site for Mushroom <strong>Reef</strong> was on the nearest intertidal platform to the west of<br />
the marine sanctuary. The intertidal area at Flinders West is a low-relief gently sloping basalt<br />
reef with occasional small steps and boulder outcrops (Figure 7.2). Patches of sand covered<br />
areas at the lowest reef extent. As with Mushroom <strong>Reef</strong>, Flinders West has a south-easterly<br />
aspect and is moderately sheltered from wind and waves from the southwest. It is also<br />
protected from large swell by a shallow reef further offshore.<br />
Baselines were run on the eastern side of the reef and were fanned out across the<br />
triangularly shaped intertidal platform. The high shore baseline was approximately 55 m long<br />
while the low shore baseline was approximately 70 m long. Transects increase in length<br />
along these baselines with Transect 1 measuring 27 m and Transect 5 measuring 62 m.<br />
80
<strong>Parks</strong> <strong>Victoria</strong> Technical Series No. 70<br />
<strong>Intertidal</strong> <strong>Reef</strong> <strong>Monitoring</strong> <strong>Program</strong><br />
a.<br />
b. c.<br />
Figure 7.1. <strong>Intertidal</strong> reef at Mushroom <strong>Reef</strong> Marine Sanctuary: (a) the cobble causeway, 8 June<br />
2004; and b-c) the reef platform, 29 May 2009.<br />
81
<strong>Parks</strong> <strong>Victoria</strong> Technical Series No. 70<br />
<strong>Intertidal</strong> <strong>Reef</strong> <strong>Monitoring</strong> <strong>Program</strong><br />
Figure 7.2. <strong>Intertidal</strong> reef at the Flinders West reference site, 8 June 2007.<br />
82
<strong>Parks</strong> <strong>Victoria</strong> Technical Series No. 70<br />
<strong>Intertidal</strong> <strong>Reef</strong> <strong>Monitoring</strong> <strong>Program</strong><br />
7.2 Community Structure<br />
The mobile invertebrate community at Mushroom <strong>Reef</strong> (Site 2907) was dominated by the top<br />
shell Austrocochlea constricta, conniwink Bembicium spp., and carnivorous gastropod<br />
Lepsiella vinosa. Commonly found species at the reference West Flinders site (Site 2908)<br />
were the top shell A. constricta, L. vinosa, the black nerite Nerita atramentosa and<br />
Siphonaria spp. The MDS analysis showed similar variation through time at both Mushroom<br />
<strong>Reef</strong> and West Flinders. There is no distinction between these two sites (Figure 7.3a).<br />
The algal and aggregating sessile invertebrate community structure was consistent between<br />
Mushroom <strong>Reef</strong> and the reference West Flinders site. The assemblage consisted of<br />
predominantly the brown algae Neptune’s necklace Hormosira banksii, Corallina officinalis,<br />
encrusting corallines and algal turf. The MDS analysis showed West Flinders had greater<br />
variation in community structure through time. There is no distinction between these two sites<br />
(Figure 7.3b).<br />
7.3 Diversity<br />
The species richness of mobile invertebrate species was relatively stable at Mushroom <strong>Reef</strong><br />
(Site 2907) and the reference West Flinders site (Site 2908) through time (Figure 7.4).<br />
Algal and aggregating sessile invertebrate species richness at both sites showed fluctuations<br />
through time with no apparent trends (Figure 7.5).<br />
Mobile invertebrate species diversity, in terms of Hills N 2 was relatively stable at Mushroom<br />
and more variable at West Flinders (Figure 7.6). Since the 2007 survey species diversity at<br />
both sites has decreased, a more substantial decrease at West Flinders.<br />
Algal and aggregating sessile invertebrate species diversity followed similar patterns at both<br />
sites. There was a peak during the 2009 surveys that was more pronounced at the West<br />
Flinders site.<br />
83
<strong>Parks</strong> <strong>Victoria</strong> Technical Series No. 70<br />
<strong>Intertidal</strong> <strong>Reef</strong> <strong>Monitoring</strong> <strong>Program</strong><br />
a. Mushroom <strong>Reef</strong> MS<br />
Sanctuary<br />
Reference<br />
b. Mushroom <strong>Reef</strong> MS<br />
Sanctuary<br />
Reference<br />
Figure 7.3. Two dimensional MDS plot of invertebrate assemblages on intertidal reefs at Mushroom<br />
<strong>Reef</strong>, within the Mushroom <strong>Reef</strong> MS, and the West Flinders reference site. (a) Mobile Invertebrate,<br />
Krushkal stress = 0.2 and (b) Macroalgae and Aggregating Sessile Invertebrates, Krushkal stress =<br />
0.08. The grey lines represent data from all other intertidal sites used in the MDS analysis.<br />
84
<strong>Parks</strong> <strong>Victoria</strong> Technical Series No. 70<br />
<strong>Intertidal</strong> <strong>Reef</strong> <strong>Monitoring</strong> <strong>Program</strong><br />
Mobile Invertebrate Species Richness<br />
Species Count<br />
0 5 10 15 20<br />
MS<br />
Reference<br />
2004 2005 2006 2007 2008 2009 2010 2011<br />
Year<br />
Figure 7.4. Mobile invertebrate species richness at Mushroom <strong>Reef</strong>, within the Mushroom <strong>Reef</strong> MS,<br />
and the West Flinders reference site.<br />
Algal and Aggregating Sessile Invertebrate Species Richness<br />
Species Count<br />
0 5 10 15 20<br />
MS<br />
Reference<br />
2004 2005 2006 2007 2008 2009 2010 2011<br />
Year<br />
Figure 7.5. Algal and aggregating sessile invertebrate species richness of intertidal sites at Mushroom<br />
<strong>Reef</strong>, within the Mushroom <strong>Reef</strong> MS, and the West Flinders reference site.<br />
85
<strong>Parks</strong> <strong>Victoria</strong> Technical Series No. 70<br />
<strong>Intertidal</strong> <strong>Reef</strong> <strong>Monitoring</strong> <strong>Program</strong><br />
Mobile Invertebrate Species Diversity<br />
Hills N2 N2<br />
0 1 2 3 4 5<br />
MS<br />
Reference<br />
2004 2005 2006 2007 2008 2009 2010 2011<br />
Year<br />
Figure 7.6. Mobile invertebrate diversity (Hills N 2 ) of intertidal sites at Mushroom <strong>Reef</strong>, within the<br />
Mushroom <strong>Reef</strong> MS, and the West Flinders reference site.<br />
Algal and Aggregating Sessile Invertebrate Species Diversity<br />
Hills N2 N2<br />
0 1 2 3 4 5<br />
MS<br />
Reference<br />
2004 2005 2006 2007 2008 2009 2010 2011<br />
Year<br />
Figure 7.7. Algal and aggregating sessile invertebrate diversity (Hill’s N 2 ) of intertidal sites at<br />
Mushroom <strong>Reef</strong>, within the Mushroom <strong>Reef</strong> MS, and the West Flinders reference site.<br />
86
<strong>Parks</strong> <strong>Victoria</strong> Technical Series No. 70<br />
<strong>Intertidal</strong> <strong>Reef</strong> <strong>Monitoring</strong> <strong>Program</strong><br />
7.4 Macroalgae and Aggregating Sessile Invertebrates<br />
The abundance of macroalgal and sessile invertebrate cover was relatively low at Mushroom<br />
<strong>Reef</strong> (Site 2907). Neptune’s necklace Hormosira banksii and crustose coralline algae were<br />
the dominant species, with Enteromorpha spp, and the mat forming mussel Xenostrobus<br />
pulex occurring in low densities. The cover of H. banksii was variable, ranging between 13<br />
and less than 1 % cover over time (Figure 7.8). The sea lettuce Ulva spp was present in low<br />
densities, less than 7 % up to 2005, it was not recorded during subsequent surveys.<br />
Macroalgal cover at West Flinders (Site 2908) was variable through surveys. Cover of H.<br />
banksii appears to be increasing from the 2007 survey after a substantial decrease between<br />
2005 and 2007 (Figure 7.8). The cover of the seagrass Zostera muelleri, has been recorded<br />
on and off at Flinders West since 2004, in low densities.<br />
Hormosira banksii<br />
Percent Cover<br />
0 5 10 15 20 25<br />
MS<br />
Reference<br />
2004 2005 2006 2007 2008 2009 2010 2011<br />
Year<br />
Figure 7.8. Mean density (± Standard Error) of Neptune’s necklace Hormosira banksii at Mushroom<br />
<strong>Reef</strong>, within the Mushroom <strong>Reef</strong> MS, and the West Flinders reference site.<br />
87
<strong>Parks</strong> <strong>Victoria</strong> Technical Series No. 70<br />
<strong>Intertidal</strong> <strong>Reef</strong> <strong>Monitoring</strong> <strong>Program</strong><br />
7.5 Mobile Invertebrates<br />
The mobile invertebrate population structure at both Mushroom <strong>Reef</strong> (Site 2907) and the<br />
reference West Flinders site (Site 2908) was dominated by the top shell Austrocochlea<br />
constricta, occurring in dense patches across the shoreline. Other species contributing to the<br />
communities were the striped conniwink Bembicium nanum, black nerite Nerita atrimentosa<br />
and the pulmonate limpet Siphonaria spp. The seastar Meridiastra exigua was common in<br />
shallow stands of water on the reef.<br />
Densities of A. constricta was consistently higher at Mushroom <strong>Reef</strong> (Figure 7.9a).<br />
Abundances had peaked in 2007 to 27 individuals 0.25 m -2 decreasing during subsequent<br />
surveys to 12 individuals 0.25 m -2 in 2010. Densities at West Flinders were relatively stable<br />
over time (Figure 7.9a).<br />
Bembicium nanum trends were relatively consistent over sites. Densities at Mushroom <strong>Reef</strong><br />
were higher than at the reference site (Figure 7.9b).<br />
The mean size of Bembicium nanum followed similar patterns through time at both sites, the<br />
mean size recorded at either site during 2010 is almost the same. The mean size remained<br />
relatively stable ranging from 6 mm to 10 mm (Figure 7.10a).<br />
The mean size of A. constricta was variable through time showing no clear patterns (Figure<br />
7.10b).<br />
88
<strong>Parks</strong> <strong>Victoria</strong> Technical Series No. 70<br />
<strong>Intertidal</strong> <strong>Reef</strong> <strong>Monitoring</strong> <strong>Program</strong><br />
a.<br />
Austrocochlea constricta<br />
Density (per quadrat)<br />
0 5 10 20 30<br />
MS<br />
Reference<br />
2004 2005 2006 2007 2008 2009 2010 2011<br />
Year<br />
b.<br />
Bembicium nanum<br />
Density (per quadrat)<br />
0 5 10 15 20<br />
MS<br />
Reference<br />
2004 2005 2006 2007 2008 2009 2010 2011<br />
Year<br />
Figure 7.9. Mean density (± Standard Error) of: (a) the top shell Austrocochlea constricta; and (b) the<br />
striped conniwink Bembicium nanum at Mushroom <strong>Reef</strong>, within the Mushroom <strong>Reef</strong> MS, and the West<br />
Flinders reference site.<br />
89
<strong>Parks</strong> <strong>Victoria</strong> Technical Series No. 70<br />
<strong>Intertidal</strong> <strong>Reef</strong> <strong>Monitoring</strong> <strong>Program</strong><br />
Bembicium spp.<br />
a.<br />
Length (mm)<br />
0 2 4 6 8 10 12<br />
MS<br />
Reference<br />
b.<br />
2004 2005 2006 2007 2008 2009 2010 2011<br />
Year<br />
Austrocochlea constricta<br />
Length (mm)<br />
0 5 10 15 20<br />
MS<br />
Reference<br />
2004 2005 2006 2007 2008 2009 2010 2011<br />
Year<br />
Figure 7.10. Mean sizes (± Standard Error) of: (a) the conniwink Bembicium spp. And (b) the top shell<br />
Austrocochlea constricta at Mushroom <strong>Reef</strong>, within the Mushroom <strong>Reef</strong> MS, and the West Flinders<br />
reference site.<br />
90
<strong>Parks</strong> <strong>Victoria</strong> Technical Series No. 70<br />
<strong>Intertidal</strong> <strong>Reef</strong> <strong>Monitoring</strong> <strong>Program</strong><br />
7.6 Condition Indicators<br />
Biodiversity<br />
Community composition was within the range of states and changes previously observed.<br />
Species diversity levels had decreased in 2010 for both mobile invertebrate and algal and<br />
other sessile invertebrates.<br />
Introduced Species<br />
There were no introduced species observed during the intertidal reef surveys in this area.<br />
Ecosystem Function<br />
The cover of Total Algae, encrusting corallines and algal turf followed similar patterns. The<br />
Mushroom <strong>Reef</strong> site was more stable compared to the variability at West Flinders (Figure<br />
7.11a-c). Cover was consistently higher at West Flinders over surveys (Figure 7.11a- c).<br />
The total abundance of grazers was predominantly greater at Mushroom <strong>Reef</strong>, with the<br />
exception of 2010. Densities of grazers at this site have been decreasing since the 2005<br />
survey (Figure 7.12a). Total abundance of predators was variable at both sites. Densities<br />
were greater at Mushroom <strong>Reef</strong> following the 2005 survey (Figure 7.12b).<br />
Climate Change<br />
There were no new species detected that were typically from adjacent bioregions.<br />
Harvesting<br />
Densities of Bembicium spp. have followed similar patterns at both Mushroom <strong>Reef</strong> and<br />
West Flinders (Figure 7.10a). The mean size decreased between 2004 and 2005 then<br />
increasing over subsequent surveys. The mean size of Austrocochlea porcata was relatively<br />
constant at Mushroom <strong>Reef</strong> compared to the variable West Flinders site (Figure 7.10b).<br />
These results did not provide clear indications of changes in harvesting pressure.<br />
Trampling<br />
The fluctuation of Hormosira banksii densities indicating trampling is not presently a<br />
constraining factor to the population.<br />
Environment<br />
The cover of green algal species indicative of nutrient loading was relatively low,
<strong>Parks</strong> <strong>Victoria</strong> Technical Series No. 70<br />
<strong>Intertidal</strong> <strong>Reef</strong> <strong>Monitoring</strong> <strong>Program</strong><br />
a.<br />
Total Algae Cover<br />
Percent Cover<br />
0 10 20 30 40 50 60<br />
MS<br />
Reference<br />
b.<br />
2004 2005 2006 2007 2008 2009 2010 2011<br />
Year<br />
Erect Coralline Algae Cover<br />
Percent Cover<br />
0 5 10 20 30<br />
MS<br />
Reference<br />
c.<br />
2004 2005 2006 2007 2008 2009 2010 2011<br />
Year<br />
Turf Algae Cover<br />
Percent Cover<br />
0 10 20 30<br />
MS<br />
Reference<br />
2004 2005 2006 2007 2008 2009 2010 2011<br />
Year<br />
Figure 7.11. Mean cover (± Standard Error) of: (a) all algae; (b) erect coralline algae; and (c) turfing<br />
algae at Mushroom <strong>Reef</strong>, within the Mushroom <strong>Reef</strong> MS, and the West Flinders reference site.<br />
92
<strong>Parks</strong> <strong>Victoria</strong> Technical Series No. 70<br />
<strong>Intertidal</strong> <strong>Reef</strong> <strong>Monitoring</strong> <strong>Program</strong><br />
a.<br />
Total Grazers<br />
Density (per quadrat)<br />
0 20 40 60 80<br />
MS<br />
Reference<br />
2004 2005 2006 2007 2008 2009 2010 2011<br />
Year<br />
b.<br />
Total Predators<br />
Density (per quadrat)<br />
0 1 2 3<br />
MS<br />
Reference<br />
2004 2005 2006 2007 2008 2009 2010 2011<br />
Year<br />
Figure 7.12. Mean abundance (± Standard Error) of: (a) all grazers; and (b) all predators at Mushroom<br />
<strong>Reef</strong>, within the Mushroom <strong>Reef</strong> MS, and the West Flinders reference site.<br />
93
<strong>Parks</strong> <strong>Victoria</strong> Technical Series No. 70<br />
<strong>Intertidal</strong> <strong>Reef</strong> <strong>Monitoring</strong> <strong>Program</strong><br />
a.<br />
Green Algae Cover<br />
Percent Cover<br />
0 2 4 6 8 10<br />
MS<br />
Reference<br />
b.<br />
2004 2005 2006 2007 2008 2009 2010 2011<br />
Year<br />
Sediment Cover<br />
Percent Cover<br />
0 1 2 3<br />
MS<br />
Reference<br />
2004 2005 2006 2007 2008 2009 2010 2011<br />
Year<br />
Figure 7.13. Mean cover (± Standard Error) of: (a) green algae (Ulva, Enteromorpha and Cladophora<br />
species); and (b) sediment at Mushroom <strong>Reef</strong>, within the Mushroom <strong>Reef</strong> MS, and the West Flinders<br />
reference site.<br />
94
<strong>Parks</strong> <strong>Victoria</strong> Technical Series No. 70<br />
<strong>Intertidal</strong> <strong>Reef</strong> <strong>Monitoring</strong> <strong>Program</strong><br />
8 BUNURONG MARINE NATIONAL PARK<br />
8.1 Site Description and Transect Layout<br />
8.1.1 Eagles Nest (Site 3020)<br />
There were many potential intertidal reefs within the Bunurong Marine National Park that<br />
could have been monitored. The mudstone reefs of the area form large intertidal platforms.<br />
Located on the eastern side of the Eagles Nest headland, Site 3020 was selected as being<br />
representative of the predominant habitat type of the area. Keough and King (1991) studied<br />
visitor traffic to the Bunurong area and found the intertidal reefs at Eagles Nest had the<br />
highest visitation rates. Combined with easy access from the Eagles Nest carpark, this site<br />
was the most suitable for long-term intertidal studies.<br />
The site is on the eastern side of the Marine National Park. It has an east facing aspect with<br />
the Eagles Nest headland sheltering it from the north and west. It is exposed to swells from<br />
the southeast, but not directly exposed to the prevailing south and southwest swell. The reef<br />
platform is relatively flat with little relief (Figure 8.1).<br />
High and low shore baselines were 56 m and 48 m, respectively. The transects range in<br />
length from 25 m at Transect 1 to 50 m at Transect 5.<br />
8.1.2 Caves Reference (Site 3021)<br />
The reference site is at the Caves (Site 3021), located to the east of Bunurong Marine<br />
National Park. The site is situated directly below the access stairs from the Caves carpark.<br />
As with Eagles Nest, the reef substratum is mudstone, has a southeast facing aspect and is<br />
sheltered from the north and west by the Caves headland. The reef is exposed to southeast<br />
and southerly swell but is more sheltered from direct exposure to the prevailing southwest<br />
swell. There is a large area platform at this site, with little rugose structure or relief (Figure<br />
8.2). On the eastern end of the survey area (Transect 5), there is more structure with large<br />
rocky outcrops towards the high shore level. Baselines were 48 m long and transects ranged<br />
from 80 m in length at Transect 1 to 100 m in length at Transect 5.<br />
95
<strong>Parks</strong> <strong>Victoria</strong> Technical Series No. 70<br />
<strong>Intertidal</strong> <strong>Reef</strong> <strong>Monitoring</strong> <strong>Program</strong><br />
Figure 8.1. <strong>Intertidal</strong> reef at Eagles Nest, Bunurong Marine National Park, 7 June 2007.<br />
a. b.<br />
Figure 8.2. <strong>Intertidal</strong> reef at the Caves reference site, 7 June 2007, showing (a) the study area and (b)<br />
the limpet Cellana tramoserica.<br />
96
<strong>Parks</strong> <strong>Victoria</strong> Technical Series No. 70<br />
<strong>Intertidal</strong> <strong>Reef</strong> <strong>Monitoring</strong> <strong>Program</strong><br />
8.2 Community Structure<br />
The mobile invertebrate community structure at Eagles Nest (3020) and the reference Caves<br />
(Site 3021) is similar. The communities was largely composed of the conniwink Bembicium<br />
spp., periwinkles Nodilittorina acutispira and Nodilittorina unifasciata, and Siphonaria spp.<br />
The MDS analysis of mobile invertebrate communities showed Eagles Nest to have greater<br />
assemblage stability over time compared with the Caves site (Figure 8.3a).<br />
The algal and aggregating sessile invertebrate community structure was also consistent<br />
between Eagles Nest and the Caves. The community was dominanted by the mat forming<br />
mussel Xenostrobus pulex, the brown algae Neptune’s necklace Hormosira banksii, and<br />
algal turf. The MDS analysis showed similar variation between survey times for both Eagles<br />
Nest and the reference Caves site. There is no distinction between the two sites (Figure<br />
8.3b).<br />
8.3 Diversity<br />
Mobile invertebrate species richness at Eagles Nest has steadily decreased from 20 species<br />
per site from the first survey in 2004 to 13 species in 2010. Species richness at the Caves<br />
was more variable through time (Figure 8.4).<br />
Algal and sessile invertebrate species richness was consistently similar between sites, with<br />
the exception of the first survey in 2004. Trends were variable at over time ranging between<br />
13 and 19 species per site (Figure 8.5).<br />
Mobile invertebrate species diversity, in terms of Hills N 2 was relatively stable at Eagles Nest<br />
and more variable at the Caves over time. Species diversity was higher at the Caves site in<br />
2010 than previously recorded (Figure 8.6).<br />
Algal and sessile invertebrate species diversity showed consistent patterns at both sites, with<br />
the exception of the 2009 survey. In 2009 Eagles Nest dropped whilst the reference Caves<br />
site increased to the highest level recorded (Figure 8.7).<br />
97
<strong>Parks</strong> <strong>Victoria</strong> Technical Series No. 70<br />
<strong>Intertidal</strong> <strong>Reef</strong> <strong>Monitoring</strong> <strong>Program</strong><br />
a. Bunurong MNP<br />
National Park<br />
Reference<br />
a. Bunurong MNP<br />
National Park<br />
Reference<br />
Figure 8.3. Two dimensional MDS plot of invertebrate assemblages on intertidal reefs at Eagles Nest,<br />
within the Bunurong MNP, and the Caves reference site. (a) Mobile Invertebrate, Krushkal stress = 0.2<br />
and (b) Macroalgae and Aggregating Sessile Invertebrates, Krushkal stress = 0.8. The grey lines<br />
represent data from all other intertidal sites used in the MDS analysis.<br />
98
<strong>Parks</strong> <strong>Victoria</strong> Technical Series No. 70<br />
<strong>Intertidal</strong> <strong>Reef</strong> <strong>Monitoring</strong> <strong>Program</strong><br />
Mobile Invertebrate Species Richness<br />
Species Count<br />
0 5 10 15 20<br />
MNP<br />
Reference<br />
2004 2005 2006 2007 2008 2009 2010 2011<br />
Year<br />
Figure 8.4. Mobile invertebrate species richness at Eagles Nest, within the Bunurong MNP, and the<br />
Caves reference site.<br />
Algal and Aggregating Sessile Invertebrate Species Richness<br />
Species Count<br />
0 5 10 15<br />
MNP<br />
Reference<br />
2004 2005 2006 2007 2008 2009 2010 2011<br />
Year<br />
Figure 8.5. Algal and aggregating sessile invertebrate species richness of intertidal sites at Eagles<br />
Nest, within the Bunurong MNP, and the Caves reference site.<br />
99
<strong>Parks</strong> <strong>Victoria</strong> Technical Series No. 70<br />
<strong>Intertidal</strong> <strong>Reef</strong> <strong>Monitoring</strong> <strong>Program</strong><br />
Mobile Invertebrate Species Diversity<br />
Hills N2<br />
Hills N2<br />
0 1 2 3 4<br />
MNP<br />
Reference<br />
2004 2005 2006 2007 2008 2009 2010 2011<br />
Year<br />
Figure 8.6. Mobile invertebrate diversity (Hills N 2 ) of intertidal sites at Eagles Nest, within the<br />
Bunurong MNP, and the Caves reference site.<br />
Algal and Aggregating Sessile Invertebrate Species Diversity<br />
Hills N2<br />
Hills N2<br />
0 1 2 3 4<br />
MNP<br />
Reference<br />
2004 2005 2006 2007 2008 2009 2010 2011<br />
Year<br />
Figure 8.7. Algal and aggregating sessile invertebrate diversity (Hill’s N 2 ) of intertidal sites at Eagles<br />
Nest, within the Bunurong MNP, and the Caves reference site.<br />
100
<strong>Parks</strong> <strong>Victoria</strong> Technical Series No. 70<br />
<strong>Intertidal</strong> <strong>Reef</strong> <strong>Monitoring</strong> <strong>Program</strong><br />
8.4 Macroalgae and Aggregating Sessile Invertebrates<br />
The species abundances of macroalgae and sessile organisms was generally similar<br />
between the two sites.<br />
The cover of the brown algae Neptune’s necklace Hormosira banksii was relatively stable<br />
through time with consistently low cover (Figure 8.8). The mat forming mussel Xenostrobus<br />
pulex steadily increased at both sites between 2007 and 2010, again in low densities. Sand<br />
cover at both sites had been variable through time with no consistent patterns.<br />
Hormosira banksii<br />
Percent Cover<br />
0 5 10 15<br />
MNP<br />
Reference<br />
2004 2005 2006 2007 2008 2009 2010 2011<br />
Year<br />
Figure 8.8. Mean density (± Standard Error) of Neptune’s necklace Hormosira banksii at Eagles Nest,<br />
within the Bunurong MNP, and the Caves reference site.<br />
101
<strong>Parks</strong> <strong>Victoria</strong> Technical Series No. 70<br />
<strong>Intertidal</strong> <strong>Reef</strong> <strong>Monitoring</strong> <strong>Program</strong><br />
8.5 Mobile Invertebrates<br />
The species composition of the mobile invertebrates at Eagles Nest (Site 3020) and the<br />
reference Caves (Site 3021) was similar. The community was dominated by the conniwink<br />
Bembicium nanum, Nodilittorina acutispira, Nodilittorina unifasciata and limpet Cellana<br />
tramoserica. The snail Austrocochlea constricta, and limpets Notoacmea mayi and Patelloida<br />
alticostata were also common.<br />
The mean density of Nodilittorina unifasciata at Eagles Nest followed a similar pattern to the<br />
Caves site. The abundance increased at both sites during 2010, to the highest recorded for<br />
Eagles Nest (Figure 8.9a). This coincided with a significant decrease in species Nodilittorina<br />
acutispira at both sites. It is worth noting there were no N. acutispira individuals recorded at<br />
the Caves during the 2010 survey.<br />
Densities of B. nanum at Eagles Nest remained stale except for the last year. At Eagles Nest<br />
abundances increased 4 fold from 55 to 241 individuals per 0.25 m -2 (Figure 8.9b). C.<br />
tramoserica consistently present at these two sites in low densities (Figure 8.9c).<br />
There were no apparent trends in the mean size of C. tramoserica, although it did increase at<br />
both sites during 2010 (Figure 8.10).<br />
102
<strong>Parks</strong> <strong>Victoria</strong> Technical Series No. 70<br />
<strong>Intertidal</strong> <strong>Reef</strong> <strong>Monitoring</strong> <strong>Program</strong><br />
a.<br />
Nodilittorina unifasciata<br />
Density (per quadrat)<br />
0 50 100 200<br />
MNP<br />
Reference<br />
b.<br />
2004 2005 2006 2007 2008 2009 2010 2011<br />
Year<br />
Bembicium spp.<br />
spp.<br />
Density (per quadrat)<br />
0 50 150 250<br />
MNP<br />
Reference<br />
c.<br />
2004 2005 2006 2007 2008 2009 2010 2011<br />
Year<br />
Cellana tramoserica<br />
Density (per quadrat)<br />
0.0 1.0 2.0 3.0<br />
MNP<br />
Reference<br />
2004 2005 2006 2007 2008 2009 2010 2011<br />
Year<br />
Figure 8.9. Mean density (± Standard Error) of (a) Nodilittorina unifasciata; (b) the striped conniwink<br />
Bembicium nanum; and (c) the limpet Cellana tramoserica at Eagles Nest, within the Bunurong MNP,<br />
and the Caves reference site.<br />
103
<strong>Parks</strong> <strong>Victoria</strong> Technical Series No. 70<br />
<strong>Intertidal</strong> <strong>Reef</strong> <strong>Monitoring</strong> <strong>Program</strong><br />
Cellana tramoserica<br />
Length (mm)<br />
0 10 20 30<br />
MNP<br />
Reference<br />
2004 2005 2006 2007 2008 2009 2010 2011<br />
Year<br />
Figure 8.10. Mean sizes (± Standard Error) of the limpet Cellana tramoserica at Eagles Nest, within<br />
the Bunurong MNP, and the Caves reference site.<br />
104
<strong>Parks</strong> <strong>Victoria</strong> Technical Series No. 70<br />
<strong>Intertidal</strong> <strong>Reef</strong> <strong>Monitoring</strong> <strong>Program</strong><br />
8.6 Condition Indicators<br />
Biodiversity<br />
Community composition was within the range of sites and changes previously observed.<br />
Introduced Species<br />
There were no introduced species observed during the intertidal reef surveys in this area.<br />
Ecosystem Function<br />
Total algal cover and erect coralline algae cover had overlapping ranges of variation at both<br />
sites with no clear patterns or trends (Figure 8.11a and 8.11b). A drop in the cover of turfing<br />
algal at both sites during 2010 interrupted an increasing trend (Figure 8.11c).<br />
The total abundance of grazers and predators has been variable over time. Abundances<br />
remained stable after a peak during the 2007 survey (Figure 8.12a and 8.12b).<br />
Climate Change<br />
There were no species typically of adjacent bioregions observed during the intertidal reef<br />
surveys in this area.<br />
Harvesting<br />
There were three main size cohorts of Cellana tramoserica during 2009 and 2010 at Eagles<br />
Nest, the Caves having two main size groups. The mean size had increased from 2009 to<br />
2010 by 10 cm at both sitesn (Figure 8.10). The temporal patterns of mean sizes provide no<br />
clear indications of changes in harvesting pressure.<br />
Trampling<br />
The fluctuation of Hormosira banksii densities (FIgure 8.8) indicating trampling is not<br />
presently a constraining factor to the population.<br />
Environment<br />
The mean cover of green algal species indicative of nutrient loading was relatively low,
<strong>Parks</strong> <strong>Victoria</strong> Technical Series No. 70<br />
<strong>Intertidal</strong> <strong>Reef</strong> <strong>Monitoring</strong> <strong>Program</strong><br />
a.<br />
Total Algae Cover<br />
Percent Cover<br />
0 5 10 15 20 25<br />
MNP<br />
Reference<br />
2004 2005 2006 2007 2008 2009 2010 2011<br />
Year<br />
b.<br />
Erect Coralline Algae Cover<br />
Percent Cover<br />
0.0 0.2 0.4 0.6 0.8 1.0<br />
MNP<br />
Reference<br />
2004 2005 2006 2007 2008 2009 2010 2011<br />
Year<br />
c.<br />
Turf Algae Cover<br />
Percent Cover<br />
0 2 4 6 8 10 12<br />
MNP<br />
Reference<br />
2004 2005 2006 2007 2008 2009 2010 2011<br />
Year<br />
Figure 8.11. Mean cover (± Standard Error) of: (a) all algae; (b) erect coralline algae; and (c) turfing<br />
algae at Eagles Nest, within the Bunurong MNP, and the Caves reference site.<br />
106
<strong>Parks</strong> <strong>Victoria</strong> Technical Series No. 70<br />
<strong>Intertidal</strong> <strong>Reef</strong> <strong>Monitoring</strong> <strong>Program</strong><br />
a.<br />
Total Grazers<br />
Density (per quadrat)<br />
0 200 600 1000<br />
MNP<br />
Reference<br />
2004 2005 2006 2007 2008 2009 2010 2011<br />
Year<br />
b.<br />
Total Predators<br />
Density (per quadrat)<br />
0.0 0.4 0.8 1.2<br />
MNP<br />
Reference<br />
2004 2005 2006 2007 2008 2009 2010 2011<br />
Year<br />
Figure 8.12. Mean abundance (± Standard Error) of: (a) all grazers; and (b) all predators at Eagles<br />
Nest, within the Bunurong MNP, and the Caves reference site.<br />
107
<strong>Parks</strong> <strong>Victoria</strong> Technical Series No. 70<br />
<strong>Intertidal</strong> <strong>Reef</strong> <strong>Monitoring</strong> <strong>Program</strong><br />
a.<br />
Green Algae Cover<br />
Percent Cover<br />
0.0 0.2 0.4 0.6 0.8<br />
MNP<br />
Reference<br />
2004 2005 2006 2007 2008 2009 2010 2011<br />
Year<br />
b.<br />
Sediment Cover<br />
Percent Cover<br />
0 5 10 15<br />
MNP<br />
Reference<br />
2004 2005 2006 2007 2008 2009 2010 2011<br />
Year<br />
Figure 8.13. Mean cover (± Standard Error) of: (a) green algae (Ulva, Enteromorpha and Cladophora<br />
species); and (b) sediment at Eagles Nest, within the Bunurong MNP, and the Caves reference site.<br />
108
<strong>Parks</strong> <strong>Victoria</strong> Technical Series No. 70<br />
<strong>Intertidal</strong> <strong>Reef</strong> <strong>Monitoring</strong> <strong>Program</strong><br />
9 POINT ADDIS MARINE NATIONAL PARK<br />
9.1 Site Description and Transect Layout<br />
9.1.1 Point Addis Marine National Park (Site 3901)<br />
The main intertidal reef at Point Addis is a large and prominent tongue of intertidal platform<br />
that extends east from the base of cliffs northeast of Point Addis. This reef is long and is<br />
undulating in places. The platform is relatively low and large areas of this reef remain<br />
inundated during some tidal cycles. It is relatively exposed to wave action. The survey site is<br />
on a smaller patch of reef that fringes the coastal cliffs. It is a low-relief, uneven reef that<br />
drops steeply at the seaward edge into subtidal habitat (Figure 10.1). Undulations in the reef<br />
caused by weathering create patches of standing water.<br />
The intertidal reefs are exposed to the south and east. The Point Addis headland provides<br />
some protection from southwest winds and swell, although large waves from the southwest<br />
can wrap around Point Addis onto these reefs.<br />
The survey area bridges a large channel that intersects the baselines. Additional coordinates<br />
of this were recorded and the affected transects shifted appropriately. The high and low<br />
baselines were 74 m and 81 m in length respectively. Transects range in length from 16 m at<br />
Transect 1 to 22 m at Transect 5.<br />
9.1.2 Winkipop Reference (Site 3902)<br />
The reference site for Point Addis Marine National Park was located to the east of the park at<br />
Winkipop reef. The intertidal area at Winkipop is a very low-relief, gently sloping reef<br />
(Figure 10.2). The area exposed at low tide is 30 to 50 m wide. This area is exposed to large<br />
southerly swell. There is a narrow band of sandy beach on the landward side of the reef. As<br />
at Point Addis, pools of standing water were common in undulations in the reef surface. This<br />
reef may be periodically subject to some sand inundation. Baselines were run parallel to<br />
shore and were 100 m long. Transects were evenly spaced every 25 m and each was<br />
approximately 35 m in length.<br />
109
<strong>Parks</strong> <strong>Victoria</strong> Technical Series No. 70<br />
<strong>Intertidal</strong> <strong>Reef</strong> <strong>Monitoring</strong> <strong>Program</strong><br />
Figure 9.1. <strong>Intertidal</strong> reef at Point Addis Marine National Park, 17 December 2004.<br />
Figure 9.2. <strong>Intertidal</strong> reef at the Winkipop reference site, 28 May 2009.<br />
110
<strong>Parks</strong> <strong>Victoria</strong> Technical Series No. 70<br />
<strong>Intertidal</strong> <strong>Reef</strong> <strong>Monitoring</strong> <strong>Program</strong><br />
9.2 Community Structure<br />
The mobile invertebrate community was more species rich at Winkipop than Point Addis. The<br />
false limpet Siphonaria spp. was abundant at both sites. True limpets, such as Cellana<br />
tramoserica and Notoacmea spp were also common. The limpet Clypidina rugosa and<br />
conniwink Bembicium spp were much more prevalent at Winkipop than Point Addis.<br />
These general similarities and slight differences in mobile invertebrate community structure<br />
are reflected in the MDS analysis which placed Point Addis and Winkipop within the same<br />
cluster of open coast sites, but distinct from one another (Figure 9.3a).<br />
The algal and aggregating sessile invertebrate communities at Point Addis and the Winkipop<br />
reference site are dominated by the brown algae Hormosira banksii. Brown algal turf was<br />
common at Point Addis, while Corallina officinalis was more common at Winkipop.<br />
The MDS analysis reflected the similarities in the two assemblages, with the two sites<br />
overlying (Figure 9.3b). There was a similar amount of variation in community structure<br />
through time at Point Addis and the reference Winkipop site.<br />
9.3 Diversity<br />
Mobile invertebrate species richness was relatively stable and generally higher at the<br />
Winkipop than at Pt Addis, except in 2009 when there was a dip in species richness at<br />
Winkipop (Figure 9.4).<br />
Algal and aggregating sessile invertebrate species richness was very similar at Pt Addis and<br />
Winkipop. It was also relatively stable over time, with between 16 and 23 species observed<br />
per survey (Figure 9.5).<br />
Mobile invertebrate species diversity, in terms of Hills N 2 , was initially higher at Winkipop<br />
than Pt Addis. It has increased at Pt Addis since 2007, while decreasing at Winkipop. In 2010<br />
these sites had similar species diversity, of 2.8 and 2.5 respectively (Figure 9.6).<br />
Algal and aggregating sessile invertebrate species diversity was low (less than 2) at both<br />
sites (Figure 9.7). In 2010, algal species diversity at Pt Addis was the highest recorded at<br />
either site.<br />
111
<strong>Parks</strong> <strong>Victoria</strong> Technical Series No. 70<br />
<strong>Intertidal</strong> <strong>Reef</strong> <strong>Monitoring</strong> <strong>Program</strong><br />
a. Point Addis MNP<br />
National Park<br />
Reference<br />
b. Point Addis MNP<br />
National Park<br />
Reference<br />
Figure 9.3. Two dimensional MDS plot of invertebrate assemblages on intertidal reefs at Point Addis,<br />
within the Point Addis MNP, and the Winkipop reference site. (a) Mobile Invertebrate, Krushkal stress<br />
= 0.17427 and (b) Macroalgae and Aggregating Sessile Invertebrates, Krushkal stress = 0.08. The<br />
grey lines represent data from all other intertidal sites used in the MDS analysis.<br />
112
<strong>Parks</strong> <strong>Victoria</strong> Technical Series No. 70<br />
<strong>Intertidal</strong> <strong>Reef</strong> <strong>Monitoring</strong> <strong>Program</strong><br />
Mobile Invertebrate Species Richness<br />
Species Count<br />
0 5 10 15 20<br />
MNP<br />
Reference<br />
2004 2005 2006 2007 2008 2009 2010 2011<br />
Year<br />
Figure 9.4. Mobile invertebrate species richness at Point Addis within the Point Addis MNP, and the<br />
Winkipop reference site.<br />
Algal and Aggregating Sessile Invertebrate Species Diversity<br />
Species Count<br />
0 5 10 15 20<br />
MNP<br />
Reference<br />
2004 2005 2006 2007 2008 2009 2010 2011<br />
Year<br />
Figure 9.5. Algal and aggregating sessile invertebrate species richness of intertidal sites at Point<br />
Addis within the Point Addis MNP, and the Winkipop reference site.<br />
113
<strong>Parks</strong> <strong>Victoria</strong> Technical Series No. 70<br />
<strong>Intertidal</strong> <strong>Reef</strong> <strong>Monitoring</strong> <strong>Program</strong><br />
Mobile Invertebrate Species Diversity<br />
Hills N2 N2<br />
0 1 2 3 4 5 6<br />
MNP<br />
Reference<br />
2004 2005 2006 2007 2008 2009 2010 2011<br />
Year<br />
Figure 9.6. Mobile invertebrate diversity (Hills N 2 ) of intertidal sites at Point Addis within the Point<br />
Addis MNP, and the Winkipop reference site.<br />
Algal and Aggregating Sessile Invertebrate Species Diversity<br />
Hills N2<br />
0.0 0.5 1.0 1.5<br />
MNP<br />
Reference<br />
2004 2005 2006 2007 2008 2009 2010 2011<br />
Year<br />
Figure 9.7. Algal and aggregating sessile invertebrate diversity (Hill’s N 2 ) of intertidal sites at Point<br />
Addis within the Point Addis MNP, and the Winkipop reference site.<br />
114
<strong>Parks</strong> <strong>Victoria</strong> Technical Series No. 70<br />
<strong>Intertidal</strong> <strong>Reef</strong> <strong>Monitoring</strong> <strong>Program</strong><br />
9.4 Macroalgae and Aggregating Sessile Invertebrates<br />
The brown alga Hormosira banksii was the dominant cover at both sites, although it was<br />
consistently 20 % to 30 % higher at the Winkipop reference site. The cover of H. banksii has<br />
remained relatively stable throughout the monitoring period, but was at its lowest level at<br />
both sites in 2010 (Figure 9.8). Algal turf covered 12 % of the reef at Point Addis in 2010, but<br />
was not observed at Winkipop.<br />
There were no marked trends in the abundances of the sessile organisms over time. The<br />
tube worm Galeolaria caespitosa is present in low abundances at both sites. The barnacle<br />
Chthamalus antennatus and mussel Xenostrobus pulex have been observed intermittently at<br />
both sites.<br />
Hormosira banksii<br />
Density (per quadrat)<br />
0 20 40 60 80 100<br />
MNP<br />
Reference<br />
2004 2005 2006 2007 2008 2009 2010 2011<br />
Year<br />
Figure 9.8. Mean density (± Standard Error) of Neptune’s necklace Hormosira banksii at Point Addis<br />
within the Point Addis MNP, and the Winkipop reference site.<br />
115
<strong>Parks</strong> <strong>Victoria</strong> Technical Series No. 70<br />
<strong>Intertidal</strong> <strong>Reef</strong> <strong>Monitoring</strong> <strong>Program</strong><br />
9.5 Mobile Invertebrates<br />
The types of mobile invertebrate species present at Point Addis and Winkipop were generally<br />
similar, but there were considerable differences in abundances. Abundances of the false<br />
limpet Siphonaria spp., and limpets Notoacmea spp. and Patelloida alticostata were<br />
consistently higher (at least double) at Point Addis than Winkipop. Anemones, Anthothoe<br />
albocincta, Actinia tenebrosa, Oulactis muscosa and Aulactinia veratra were observed<br />
regularly at Winkipop in small patches of standing water or buried in wet sand beneath<br />
Hormosira. Anemones have only been observed intermittently at Point Addis.<br />
At the reference Winkipop site, the abundance of the Clypidina rugosa increased<br />
dramatically during 2010, from nothing in 2009 to 47 individuals 0.25 m -2 . The abundance of<br />
this species had previously been low and stable with consistent patterns over the two sites<br />
(Figure 9.9a).<br />
The abundance of Bembicium nanum was greater at the reference Winkipop site although<br />
trends were variable over time. Trends were more consistent for this species at the Point<br />
Addis site (Figure 9.9b).<br />
The limpet Cellana tramoserica was found in low abundances at both sites. Point Addis and<br />
the reference Winkipop site had opposite pattern in abundance over survey times. The<br />
abundances were lower at Winkipop, with no individuals recorded during the 2007 and 2009<br />
surveys (Figure 9.9c).<br />
The mean size of C. tramoserica at Point Addis and the reference Winkipop site remained<br />
relatively constant through time (Figure 9.10).<br />
116
<strong>Parks</strong> <strong>Victoria</strong> Technical Series No. 70<br />
<strong>Intertidal</strong> <strong>Reef</strong> <strong>Monitoring</strong> <strong>Program</strong><br />
a.<br />
Clypidina rugosa<br />
Density (per quadrat)<br />
0 10 30 50 70<br />
MNP<br />
Reference<br />
b.<br />
2004 2005 2006 2007 2008 2009 2010 2011<br />
Year<br />
Bembicium Bembicium spp. spp.<br />
Density (per quadrat)<br />
0 2 4 6 8 10 12<br />
MNP<br />
Reference<br />
c.<br />
2004 2005 2006 2007 2008 2009 2010 2011<br />
Year<br />
Cellana tramoserica<br />
Density (per quadrat)<br />
0.0 0.4 0.8 1.2<br />
MNP<br />
Reference<br />
2004 2005 2006 2007 2008 2009 2010 2011<br />
Year<br />
Figure 9.9. Mean density (± Standard Error) of: (a) the limpet Clypidina rugosa; (b) the striped<br />
conniwink Bembicium nanum; and (c) the limpet Cellana tramoserica at Point Addis within the Point<br />
Addis MNP, and the Winkipop reference site.<br />
117
<strong>Parks</strong> <strong>Victoria</strong> Technical Series No. 70<br />
<strong>Intertidal</strong> <strong>Reef</strong> <strong>Monitoring</strong> <strong>Program</strong><br />
Cellana tramoserica<br />
Length (mm)<br />
0 10 20 30 40<br />
MNP<br />
Reference<br />
2004 2005 2006 2007 2008 2009 2010 2011<br />
Year<br />
Figure 9.10. Mean sizes (± Standard Error) of the limpet Cellana tramoserica at Point Addis, within the<br />
Point Addis MNP, and the Winkipop reference site.<br />
118
<strong>Parks</strong> <strong>Victoria</strong> Technical Series No. 70<br />
<strong>Intertidal</strong> <strong>Reef</strong> <strong>Monitoring</strong> <strong>Program</strong><br />
9.6 Condition Indicators<br />
Biodiversity<br />
Community composition at these sites was within the range of states and changes previously<br />
observed.<br />
Species richness was also within the range previously observed.<br />
Invertebrate species diversity was at the lowest level recorded at the Winkipop reference<br />
site. Conversely, algal and sessile invertebrate species diversity was at its highest recorded<br />
level at Point Addis.<br />
Introduced Species<br />
There were no introduced species detected for these sites.<br />
Ecosystem Function<br />
Total algal cover decreased at both sites from 2009 to 2010 (Figure 9.11a). There has been<br />
an increasing trend in the abundance of erect coralline algae at Winkipop, but it remains<br />
absent at Point Addis (Figure 9.11b). Turfing algae cover remained relatively high at Point<br />
Addis, covering approximately 12 % of the study area (Figure 9.11c).<br />
The total abundance of grazers and total abundance of predators both decreased at Point<br />
Addis from 2009 to 2010, but increased at Winkipop (Figure 9.12). The decrease in grazers<br />
at Point Addis was mainly due to decreases in the abundance of Siphonaria spp. and<br />
Notoacmea spp.<br />
Climate Change<br />
There were no new species detected that were typically from adjacent bioregions.<br />
Harvesting<br />
Cellana tramoserica occur at very low densities at these sites,
<strong>Parks</strong> <strong>Victoria</strong> Technical Series No. 70<br />
<strong>Intertidal</strong> <strong>Reef</strong> <strong>Monitoring</strong> <strong>Program</strong><br />
The cover of sand at Point Addis has varied between 1 and 9 %, while remaining relatively<br />
constant at Winkipop, with 6-8 % cover. In 2010 sand cover at Point Addis decreased to 1 %.<br />
120
<strong>Parks</strong> <strong>Victoria</strong> Technical Series No. 70<br />
<strong>Intertidal</strong> <strong>Reef</strong> <strong>Monitoring</strong> <strong>Program</strong><br />
a.<br />
Total Algae Cover<br />
Percent Cover<br />
0 20 40 60 80 100<br />
MNP<br />
Reference<br />
b.<br />
2004 2005 2006 2007 2008 2009 2010 2011<br />
Year<br />
Erect Coralline Algae Cover<br />
Percent Cover<br />
0 1 2 3 4 5<br />
MNP<br />
Reference<br />
c.<br />
2004 2005 2006 2007 2008 2009 2010 2011<br />
Year<br />
Turf Algae Cover<br />
Percent Cover<br />
0 5 10 15 20<br />
MNP<br />
Reference<br />
2004 2005 2006 2007 2008 2009 2010 2011<br />
Year<br />
Figure 9.11. Mean cover (± Standard Error) of: (a) all algae; (b) erect coralline algae; and (c) turfing<br />
algae at Point Addis within the Point Addis MNP, and the Winkipop reference site.<br />
121
<strong>Parks</strong> <strong>Victoria</strong> Technical Series No. 70<br />
<strong>Intertidal</strong> <strong>Reef</strong> <strong>Monitoring</strong> <strong>Program</strong><br />
a.<br />
Total Grazers<br />
Density (per quadrat)<br />
0 50 150 250<br />
MNP<br />
Reference<br />
2004 2005 2006 2007 2008 2009 2010 2011<br />
Year<br />
b.<br />
Total Predators<br />
Density (per quadrat)<br />
0.0 0.5 1.0 1.5<br />
MNP<br />
Reference<br />
2004 2005 2006 2007 2008 2009 2010 2011<br />
Year<br />
Figure 9.12. Mean abundance (± Standard Error) of: (a) all grazers; and (b) all predators at Point<br />
Addis within the Point Addis MNP, and the Winkipop reference site.<br />
122
<strong>Parks</strong> <strong>Victoria</strong> Technical Series No. 70<br />
<strong>Intertidal</strong> <strong>Reef</strong> <strong>Monitoring</strong> <strong>Program</strong><br />
a.<br />
Green Algae Cover<br />
Percent Cover<br />
0.0 0.5 1.0 1.5 2.0 2.5<br />
MNP<br />
Reference<br />
b.<br />
2004 2005 2006 2007 2008 2009 2010 2011<br />
Year<br />
Sediment Cover<br />
Percent Cover<br />
0 2 4 6 8 10<br />
MNP<br />
Reference<br />
2004 2005 2006 2007 2008 2009 2010 2011<br />
Year<br />
Figure 9.13. Mean cover (± Standard Error) of: (a) green algae (Ulva, Enteromorpha and Cladophora<br />
species); and (b) sediment at Point Addis within the Point Addis MNP, and the Winkipop reference<br />
site.<br />
123
<strong>Parks</strong> <strong>Victoria</strong> Technical Series No. 70<br />
<strong>Intertidal</strong> <strong>Reef</strong> <strong>Monitoring</strong> <strong>Program</strong><br />
10 POINT DANGER MARINE SANCTUARY<br />
10.1 Site Description and Transect Layout<br />
10.1.1 Point Danger Marine Sanctuary (Site 4002)<br />
The intertidal area at Point Danger is a large sandstone reef platform that is an extension of<br />
the Point Danger headland (Figure 10.1). The reef is exposed to the north, east and south,<br />
however most of the prevailing weather and waves are from the south and southwest. There<br />
are large areas of sandy beach to the west and north of the platform.<br />
The reef is a relatively flat sandstone platform which quickly drains or floods with the tide.<br />
The reef surface has been eroded to make it rugose, with a relief of 10-15 cm. Most of the<br />
reef is affected by sand inundation, with a thin layer of sand being present in many quadrats.<br />
The survey site is in the near shore region of the platform towards the south/west border of<br />
the sanctuary. The high and low-shore baselines are approximately transverse to the<br />
headland. Baseline lengths were 46 m each, with transects of 41-43 m, forming a square<br />
survey area.<br />
10.1.2 Point Danger West Reference (Site 4001)<br />
The reference site, Point Danger West, is separated from the Point Danger intertidal platform<br />
by a short section of sandy beach. As with Point Danger, the sandstone platform has been<br />
eroded to create an uneven surface at the scale of 10s centimetres. This reef is subject to<br />
significant sand inundation (Figure 10.2). The site baselines were 50 m, with transects of<br />
30 m.<br />
124
<strong>Parks</strong> <strong>Victoria</strong> Technical Series No. 70<br />
<strong>Intertidal</strong> <strong>Reef</strong> <strong>Monitoring</strong> <strong>Program</strong><br />
a. b.<br />
c. d.<br />
Figure 10.1. <strong>Intertidal</strong> reef at Point Danger Marine Sanctuary: (a-b) 14 January 2005; (c-d) 30 April<br />
2009.<br />
125
<strong>Parks</strong> <strong>Victoria</strong> Technical Series No. 70<br />
<strong>Intertidal</strong> <strong>Reef</strong> <strong>Monitoring</strong> <strong>Program</strong><br />
a.<br />
b.<br />
Figure 10.2. <strong>Intertidal</strong> reef at the Point Danger West reference site: (a) 17 January 2005; (b) 30 April<br />
2009. Note: sand inundation along the high shore was lower in 2009, but remained higher than when<br />
the site was established.<br />
126
<strong>Parks</strong> <strong>Victoria</strong> Technical Series No. 70<br />
<strong>Intertidal</strong> <strong>Reef</strong> <strong>Monitoring</strong> <strong>Program</strong><br />
10.2 Community Structure<br />
The mobile invertebrate community structure at Point Danger (4002) and the reference site<br />
Point Danger West (Site 4001) are similar. The community is dominated by the conniwink<br />
Bembicium spp., periwinkle Nodilittorina acutispira, and slit limpet Clypidina rugosa. The<br />
MDS analysis reflected the similarities in these sites, situating them close together within the<br />
same cluster. Both sites showed a similar amount of variation throughout the monitoring<br />
period (Figure 10.3a).<br />
The algal and aggregating sessile invertebrate community structure was again similar<br />
between Point Danger the Point Danger West site. The most commonly found species are<br />
the brown algae Neptune’s necklace Hormosira banksii, mat forming mussel Xenostrobus<br />
pulex and algal turf. The calcareous tube-worm Galeolaria caespitosa was recorded at Point<br />
Danger West, but not at the Point Danger site. The MDS analysis showed the Point Danger<br />
marine sanctuary and reference sites had relatively small changes over time compared to the<br />
overall assemblage variability (Figure 10.3b).<br />
10.3 Diversity<br />
Species Richness of mobile invertebrates was relatively stable over survey times at both Pt<br />
Danger (Site 4002) and the reference Point Danger West site (Site 4001). Richness at Point<br />
Danger West was consistently higher compared to Point Danger. Both sites had highest<br />
recorded species richness levels in 2010 (Figure 10.4).<br />
Algal and sessile invertebrate species richness was variable between 2005 and 2007. Since<br />
2007 it remained relatively stable at both Pt Danger and the Pt Danger West site for<br />
subsequent surveys (Figure 10.5).<br />
Mobile invertebrate species diversity in terms of Hills N 2 at Point Danger (Site 4002) has<br />
been increasing since 2007, reaching its highest in 2010 (Figure 10.6). This coincided with a<br />
decrease in diversity at the reference Pt Danger West site.<br />
Algal and aggregating sessile invertebrate species diversity at Pt Danger and Pt Danger<br />
West remained relatively stable through surveys times. Diversity was consistently low at both<br />
sites (Figure 10.7).<br />
127
<strong>Parks</strong> <strong>Victoria</strong> Technical Series No. 70<br />
<strong>Intertidal</strong> <strong>Reef</strong> <strong>Monitoring</strong> <strong>Program</strong><br />
a. Point Danger MS<br />
Sanctuary<br />
Reference<br />
b. Point Danger MS<br />
Reference<br />
Sanctuary<br />
Figure 10.3. Two dimensional MDS plot of invertebrate assemblages on intertidal reefs at Point<br />
Danger, within the Point Danger MS, and the Point Danger West reference site. (a) Mobile<br />
Invertebrate, Krushkal stress = 0.2 and (b) Macroalgae and Aggregating Sessile Invertebrates,<br />
Krushkal stress = 0.8. The grey lines represent data from all other intertidal sites used in the MDS<br />
analysis.<br />
128
<strong>Parks</strong> <strong>Victoria</strong> Technical Series No. 70<br />
<strong>Intertidal</strong> <strong>Reef</strong> <strong>Monitoring</strong> <strong>Program</strong><br />
Mobile Invertebrate Species Richness<br />
Species Count<br />
0 5 10 15 20<br />
MS<br />
Reference<br />
2004 2005 2006 2007 2008 2009 2010 2011<br />
Year<br />
Figure 10.4. Mobile invertebrate species richness at Point Danger, within the Point Danger MS, and<br />
the Point Danger West reference site.<br />
Algal and Aggregating Sessile Invertebrate Species Richness<br />
Species Count<br />
0 5 10 15 20<br />
MS<br />
Reference<br />
2004 2005 2006 2007 2008 2009 2010 2011<br />
Year<br />
Figure 10.5. Algal and aggregating sessile invertebrate species richness of intertidal sites at Point<br />
Danger, within the Point Danger MS, and the Point Danger West reference site.<br />
129
<strong>Parks</strong> <strong>Victoria</strong> Technical Series No. 70<br />
<strong>Intertidal</strong> <strong>Reef</strong> <strong>Monitoring</strong> <strong>Program</strong><br />
Mobile Invertebrate Species Diversity<br />
Hills N2<br />
Hills N2<br />
0 1 2 3 4 5<br />
MS<br />
Reference<br />
2004 2005 2006 2007 2008 2009 2010 2011<br />
Year<br />
Figure 10.6. Mobile invertebrate diversity (Hills N 2 ) of intertidal sites at Point Danger, within the Point<br />
Danger MS, and the Point Danger West reference site.<br />
Algal and Aggregating Sessile Invertebrate Species Diversity<br />
Hills N2<br />
Hills N2<br />
0 1 2 3<br />
MS<br />
Reference<br />
2004 2005 2006 2007 2008 2009 2010 2011<br />
Year<br />
Figure 10.7. Algal and aggregating sessile invertebrate diversity (Hill’s N 2 ) of intertidal sites at Point<br />
Danger, within the Point Danger MS, and the Point Danger West reference site.<br />
130
<strong>Parks</strong> <strong>Victoria</strong> Technical Series No. 70<br />
<strong>Intertidal</strong> <strong>Reef</strong> <strong>Monitoring</strong> <strong>Program</strong><br />
10.4 Macroalgae and Aggregating Sessile Invertebrates<br />
Macroalgal and aggregating sessile invertebrates were similar at both Point Danger (Site<br />
4002) and the Point Danger West site (Site 4001). The community was comprised of<br />
predominantly the brown alga Neptune’s necklace Hormosira banksii, green algae<br />
Enteromorpha spp, algal turfs and the mat-forming mussel Xenostrobus pulex. Other sessile<br />
species were observed in low densities of < 3 % cover. With the exception of the first survey<br />
in 2004 the cover of H. banksii remained relatively stable. Observations showed both sites<br />
having similar coverage (Figure 10.8).<br />
It is worth noting there was an increase in cover of Enteromorpha spp. from 4 to 12 % in<br />
2010 at Point Danger West. Sand inundation at both reefs was variable between<br />
surveys, ranging from 2-33 % cover. Highest recordings were during the May 2007<br />
survey.<br />
Hormosira banksii<br />
Percent Cover<br />
0 10 20 30 40<br />
MS<br />
Reference<br />
2004 2005 2006 2007 2008 2009 2010 2011<br />
Year<br />
Figure 10.8. Mean Density (±Standard Error) of Neptune’s necklace Hormosira banksii at Point<br />
Danger, within the Point Danger MS, and the Point Danger West reference site.<br />
131
<strong>Parks</strong> <strong>Victoria</strong> Technical Series No. 70<br />
<strong>Intertidal</strong> <strong>Reef</strong> <strong>Monitoring</strong> <strong>Program</strong><br />
10.5 Mobile Invertebrates<br />
Point Danger and Point Danger West had a similar suite of mobile invertebrate species which<br />
were generally similar in abundances between the two sites. The conniwink Bembicium spp<br />
and the limpets Clypidina rugosa and Siphonaria spp were the numerically dominant species.<br />
Snails Dicathais orbita, Lepsiella vinosa, Turbo undulatus and limpet Patelloida alticostata<br />
contributed to the community structure although occurring at lower densities.<br />
The abundance of Clypidina rugosa was relatively variable and stable through survey times.<br />
In 2010 abundances at Point Danger West increased from 10 to 24 individuals per 0.25 m -2 ,<br />
the highest recorded (Figure 10.9a).<br />
The two sites differed in the densities of B. nanum (Figure 10.9b). Point Danger consistently<br />
had higher densities, with the exception of the 2010 survey. The mean density of limpet<br />
Cellana tramoserica were relatively stable over time at both sites. Abundances were variable<br />
over survey times, with few consistent patterns (Figure 10.11).<br />
Mean sizes were recorded for B. nanum and C. tramoserica. For both species the mean size<br />
remained relatively stable through time (Figure 10.12). Sizes at the reference site Point<br />
Danger West were consistently larger, with the exception of the drop for B. nanum during<br />
2010 (Figure 10.12a).<br />
132
<strong>Parks</strong> <strong>Victoria</strong> Technical Series No. 70<br />
<strong>Intertidal</strong> <strong>Reef</strong> <strong>Monitoring</strong> <strong>Program</strong><br />
a.<br />
Clypidina rugosa<br />
Density (per quadrat)<br />
0 5 10 20 30<br />
MS<br />
Reference<br />
b.<br />
2004 2005 2006 2007 2008 2009 2010 2011<br />
Year<br />
Bembicium spp.<br />
Density (per quadrat)<br />
0 10 30 50 70<br />
MS<br />
Reference<br />
c.<br />
2004 2005 2006 2007 2008 2009 2010 2011<br />
Year<br />
Cellana tramoserica<br />
Density (per quadrat)<br />
0.0 0.5 1.0 1.5 2.0 2.5<br />
MS<br />
Reference<br />
2004 2005 2006 2007 2008 2009 2010 2011<br />
Year<br />
Figure 10.9. Mean Density (±Standard Error) of: (a) the limpet Clypidina rugosa; (b) the striped<br />
conniwink Bembicium nanum; and (c) the limpet Cellana tramoserica at Point Danger, within the Point<br />
Danger MS, and Point Danger the West reference site.<br />
133
<strong>Parks</strong> <strong>Victoria</strong> Technical Series No. 70<br />
<strong>Intertidal</strong> <strong>Reef</strong> <strong>Monitoring</strong> <strong>Program</strong><br />
a.<br />
Bembicium spp.<br />
Length (mm)<br />
0 2 4 6 8 10<br />
MS<br />
Reference<br />
b.<br />
2004 2005 2006 2007 2008 2009 2010 2011<br />
Year<br />
Cellana tramoserica<br />
Length (mm)<br />
0 10 20 30 40<br />
MS<br />
Reference<br />
2004 2005 2006 2007 2008 2009 2010 2011<br />
Year<br />
Figure 10.10. Mean sizes (± Standard Error) of the conniwink Bembicium spp. and Cellana<br />
tramoserica at Point Danger, within the Point Danger MS, and the Point Danger West reference site.<br />
134
<strong>Parks</strong> <strong>Victoria</strong> Technical Series No. 70<br />
<strong>Intertidal</strong> <strong>Reef</strong> <strong>Monitoring</strong> <strong>Program</strong><br />
10.6 Condition Indicators<br />
Biodiversity<br />
Community composition was within the range of sites and changes previously observed.<br />
Mobile invertebrate species richness had increased in 2010 to the highest levels recorded<br />
(Figure 10.4). Species diversity had remained stable over surveys with few clear patterns or<br />
trends in the data (Figure 10.6 and 10.7).<br />
Introduced Species<br />
There were no introduced species observed during the intertidal reef surveys in this area.<br />
Ecosystem Function<br />
Total algal cover has been steadily increasing at Point Danger since 2005, in 2010 reaching<br />
the highest cover over survey times (Figure 10.10a). Cover of erect coralline algae was<br />
consistently low,
<strong>Parks</strong> <strong>Victoria</strong> Technical Series No. 70<br />
<strong>Intertidal</strong> <strong>Reef</strong> <strong>Monitoring</strong> <strong>Program</strong><br />
variable at both sites over survey times, variability interrupting any patterns in the data<br />
(Figure 10.13b).<br />
136
<strong>Parks</strong> <strong>Victoria</strong> Technical Series No. 70<br />
<strong>Intertidal</strong> <strong>Reef</strong> <strong>Monitoring</strong> <strong>Program</strong><br />
a.<br />
Total Algae Cover<br />
Percent Cover<br />
0 10 20 30 40 50<br />
MS<br />
Reference<br />
b.<br />
2004 2005 2006 2007 2008 2009 2010 2011<br />
Year<br />
Erect Coralline Algae Cover<br />
Percent Cover<br />
0.0 0.2 0.4 0.6 0.8<br />
MS<br />
Reference<br />
c.<br />
2004 2005 2006 2007 2008 2009 2010 2011<br />
Year<br />
Turf Algae Cover<br />
Percent Cover<br />
0 5 10 15<br />
MS<br />
Reference<br />
2004 2005 2006 2007 2008 2009 2010 2011<br />
Year<br />
Figure 10.11. Mean cover (± Standard Error) of: (a) all algae; (b) erect coralline algae; and (c) turfing<br />
algae at Point Danger, within the Point Danger MS, and Point Danger the West reference site.<br />
137
<strong>Parks</strong> <strong>Victoria</strong> Technical Series No. 70<br />
<strong>Intertidal</strong> <strong>Reef</strong> <strong>Monitoring</strong> <strong>Program</strong><br />
a.<br />
Total Grazers<br />
Density (per quadrat)<br />
0 20 40 60 80<br />
MS<br />
Reference<br />
b.<br />
2004 2005 2006 2007 2008 2009 2010 2011<br />
Year<br />
Total Predators<br />
Density (per quadrat)<br />
0 1 2 3 4 5<br />
MS<br />
Reference<br />
2004 2005 2006 2007 2008 2009 2010 2011<br />
Year<br />
Figure 10.12. Mean abundance (± Standard Error) of: (a) all grazers; and (b) all predators at Point<br />
Danger, within the Point Danger MS, and Point Danger the West reference site.<br />
138
<strong>Parks</strong> <strong>Victoria</strong> Technical Series No. 70<br />
<strong>Intertidal</strong> <strong>Reef</strong> <strong>Monitoring</strong> <strong>Program</strong><br />
a.<br />
Green Algae Cover<br />
Percent Cover<br />
0 5 10 15<br />
MS<br />
Reference<br />
b.<br />
2004 2005 2006 2007 2008 2009 2010 2011<br />
Year<br />
Sediment Cover<br />
Percent Cover<br />
0 10 20 30 40<br />
MS<br />
Reference<br />
2004 2005 2006 2007 2008 2009 2010 2011<br />
Year<br />
Figure 10.13. Mean cover (± Standard Error) of: (a) green algae (Ulva, Enteromorpha and Cladophora<br />
species); and (b) sediment at Point Danger, within the Point Danger MS, and Point Danger the West<br />
reference site.<br />
139
<strong>Parks</strong> <strong>Victoria</strong> Technical Series No. 70<br />
<strong>Intertidal</strong> <strong>Reef</strong> <strong>Monitoring</strong> <strong>Program</strong><br />
11 BARWON BLUFF MARINE SANCTUARY<br />
11.1 Site Description and Transect Layout<br />
11.1.1 Barwon Bluff Marine Sanctuary (Site 4004)<br />
The intertidal reef at Barwon Bluff is composed of sections of sandstone and basalt reef. The<br />
intertidal rock platform extends from the end of Barwon Bluff as a pincer-shaped reef. The<br />
north-eastern section of the pincer is a basalt platform and boulder reef. This section of the<br />
reef is relatively protected from swell but has a large estuarine influence from the adjacent<br />
mouth of the Barwon River. The south-western section of the pincer is a relatively flat<br />
sandstone reef, which is more exposed to large swells and sand inundation due to its<br />
exposure towards the south, proximity to an adjacent surf beach and strong cross-shore<br />
currents. The survey site is on the sandstone section of the reef (Figure 12.1).<br />
The sandstone platform has three large rockpools in the centre of the survey area. The<br />
transects do not intercept any of these pools. Relief is present as 5-10 cm high ripples in the<br />
platform. These ripples act as traps for cross-shore sand movement. The edge of the<br />
platform drops sharply into subtidal habitat. At the high shore end of the platform there is a<br />
distinctive rise in shore height. This has been encompassed by the high shore baseline<br />
which follows this contour for 52 m. The low shore baseline borders rockpools on the southwestern<br />
corner and is 53 m long. Transect lengths range from 47 m at Transect 1 to 49 m at<br />
Transect 5.<br />
Only Barwon Bluff (Site 4004) was surveyed during Survey 2, May 2004.<br />
11.1.2 Barwon Beach Reference (Site 4003)<br />
To the west of the intertidal platform at Barwon Bluff, there are several smaller isolated<br />
patches of intertidal sandstone reef. These reefs are directly exposed to large southerly<br />
swells and sand inundation due to their proximity to the adjacent surf beach and strong<br />
longshore currents. The reef surface has been weathered to create an uneven surface at the<br />
scale of 10s of centimetres. The reference site is on one of these reefs, approximately 400 m<br />
west of Barwon Bluff, directly below a set of access stairs. These stairs are the closest<br />
access point and are the first set west of Barwon Bluff.<br />
The reef structure is rugose, with many depressions or rock pools approximately 20 cm in<br />
depth and 20-100 cm in diameter. It is more rugose than the Barwon Bluff Marine Sanctuary<br />
(Site 4004). The high shore baseline runs parallel to the shore for 45 m and follows the same<br />
140
<strong>Parks</strong> <strong>Victoria</strong> Technical Series No. 70<br />
<strong>Intertidal</strong> <strong>Reef</strong> <strong>Monitoring</strong> <strong>Program</strong><br />
shore height contour as at Barwon Bluff. The low shore baseline is 37 m long and is angled<br />
back towards shore such that Transect 1 is 33 m long and Transect 5 is 24 m long.<br />
141
<strong>Parks</strong> <strong>Victoria</strong> Technical Series No. 70<br />
<strong>Intertidal</strong> <strong>Reef</strong> <strong>Monitoring</strong> <strong>Program</strong><br />
a.<br />
b.<br />
Figure 11.1. <strong>Intertidal</strong> reef at Barwon Bluff Marine Sanctuary: (a) 30 November 2005; and (b) 1 May<br />
2009.<br />
142
<strong>Parks</strong> <strong>Victoria</strong> Technical Series No. 70<br />
<strong>Intertidal</strong> <strong>Reef</strong> <strong>Monitoring</strong> <strong>Program</strong><br />
11.2 Community Structure<br />
The mobile invertebrate communities at Barwon Bluff (4004) and the reference site Barwon<br />
Beach (Site 4003) are largely composed of top shells Austrocochlea constricta, conniwinks<br />
Bembicium spp. limpets Notoacmea spp., periwinkles Nodilittorina acutispira, and slit limpet<br />
Clypidina rugosa.<br />
The MDS analysis of mobile invertebrate community structure reflected the similarity of these<br />
sites, placing them close together within the same cluster on the MDS plot. The community<br />
structure at Barwon Bluff remained very stable throughout the monitoring period. The<br />
community structure at Barwon Beach was slightly more variable, particularly between<br />
surveys 4 and 5, when species richness at this site dipped (Figure 11.2a).<br />
The algal and aggregating sessile invertebrate communities at Barwon Bluff and the Barwon<br />
Beach reference site are dominated by the brown algae Neptune’s necklace Hormosira<br />
banksii. Mat forming mussel Xenostrobus pulex, the calcareous tube-worm Galeolaria<br />
caespitosa and algal turf are also present at lower abundances. The MDS analysis located<br />
the two sites closely together on the MDS plot, reflecting their similarity (Figure 11.2b). The<br />
analysis also shows a similar amount of variation over times for both sites.<br />
11.3 Diversity<br />
Mobile invertebrate species richness has been stable at the Barwon Beach reference site<br />
(Site 4003), ranging from 15 to 17 species per survey (Figure 11.2). It has been more<br />
variable at Barwon Bluff Marine Sanctuary (Site 4004), peaking at 22 species in late 2005<br />
before dropping to 10 in 2007. There were 18 mobile invertebrate species recorded at this<br />
site in 2010 (Figure 11.2).<br />
The species richness of the algal and sessile invertebrate communities at Barwon Bluff and<br />
Barwon Beach have been similar to each other through time (Figure 11.4).<br />
Mobile invertebrate species diversity increased at Barwon Bluff (Site 4004) in 2010,<br />
interrupting a decreasing trend. Diversity at Barwon Beach (Site 4003) has been steadily<br />
increasing from a low in 2007 and in 2010 it was at the highest level recorded at this site<br />
(Figure 11.4).<br />
Algal and aggregate sessile invertebrate species diversity has been low and relatively stable<br />
at both Barwon Bluff and Barwon Beach, with the Hills N 2 statistic ranging between 1 and 2<br />
(Figure 11.4).<br />
143
<strong>Parks</strong> <strong>Victoria</strong> Technical Series No. 70<br />
<strong>Intertidal</strong> <strong>Reef</strong> <strong>Monitoring</strong> <strong>Program</strong><br />
a. Barwon Bluff MS<br />
Reference<br />
Sanctuary<br />
a. Barwon Bluff MS<br />
Sanctuary<br />
Reference<br />
Figure 11.2. Two dimensional MDS plot of invertebrate assemblages on intertidal reefs at Barwon<br />
Bluff, within the Barwon Bluff MS, and the reference Barwon Bluff site. (a) Mobile Invertebrate,<br />
Krushkal stress = 0.17 and (b) Macroalgae and Aggregating Sessile Invertebrates, Krushkal stress =<br />
0.08. The grey lines represent data from all other intertidal sites used in the MDS analysis.<br />
144
<strong>Parks</strong> <strong>Victoria</strong> Technical Series No. 70<br />
<strong>Intertidal</strong> <strong>Reef</strong> <strong>Monitoring</strong> <strong>Program</strong><br />
Mobile Invertebrate Species Richness<br />
Species Count<br />
0 5 10 15 20<br />
MS<br />
Reference<br />
2004 2005 2006 2007 2008 2009 2010 2011<br />
Year<br />
Figure 11.3. Mobile invertebrate species richness at Barwon Bluff within the Barwon Bluff MS, and the<br />
Barwon Beach reference site.<br />
Algal and Aggregating Sessile Invertebrate Species Richness<br />
Species Count<br />
0 5 10 15 20<br />
MS<br />
Reference<br />
2004 2005 2006 2007 2008 2009 2010 2011<br />
Year<br />
Figure 11.4. Algal and aggregating sessile invertebrate species richness of intertidal sites at Barwon<br />
Bluff within the Barwon Bluff MS, and the Barwon Beach reference site.<br />
145
<strong>Parks</strong> <strong>Victoria</strong> Technical Series No. 70<br />
<strong>Intertidal</strong> <strong>Reef</strong> <strong>Monitoring</strong> <strong>Program</strong><br />
Mobile Invertebrate Species Diversity<br />
Hills N2<br />
0 1 2 3 4 5<br />
MS<br />
Reference<br />
2004 2005 2006 2007 2008 2009 2010 2011<br />
Year<br />
Figure 11.5. Mobile invertebrate diversity (Hills N 2 ) of intertidal sites at Barwon Bluff within the Barwon<br />
Bluff MS, and the Barwon Beach reference site.<br />
Algal and Aggregating Sessile Invertebrate Species Diversity<br />
Hills N2 N2<br />
0.0 0.5 1.0 1.5<br />
MS<br />
Reference<br />
2004 2005 2006 2007 2008 2009 2010 2011<br />
Year<br />
Figure 11.6. Algal and aggregating sessile invertebrate diversity (Hill’s N 2 ) of intertidal sites at Barwon<br />
Bluff within the Barwon Bluff MS, and the Barwon Beach reference site.<br />
146
<strong>Parks</strong> <strong>Victoria</strong> Technical Series No. 70<br />
<strong>Intertidal</strong> <strong>Reef</strong> <strong>Monitoring</strong> <strong>Program</strong><br />
11.4 Macroalgae and Aggregating Sessile Invertebrates<br />
As with most exposed rock platforms of the central <strong><strong>Victoria</strong>n</strong> coast, the brown algae<br />
Neptune’s necklace Hormosira banksii was the dominant algae cover at both Barwon Bluff<br />
and the reference site at Barwon Beach. The cover of H. banksii was typically 15 % to 20 %<br />
higher at Barwon Bluff, except in 2007 when cover dipped at both sites. In 2010, the cover of<br />
H. banksii increased from 31 % to 57 % at Barwon Bluff, and from 28 % to 40 % at Barwon<br />
Beach (Figure 11.7). The only other macroalgae which occurred in appreciable quantities on<br />
the shore were turf forming species. Algal turf cover was higher at Barwon Beach than<br />
Barwon Bluff, covering up to 12 % of the reef.<br />
Sand inundation was consistently higher at Barwon Bluff, but decreased from 20 % to 9 %<br />
over the last four surveys. Sand inundation at the Barwon Beach site was lower than at<br />
Barwon Bluff, and was not recorded at Barwon Beach during 2010. Sand inundation is<br />
expected to vary considerably over shorter time scales at these sites, being influenced by<br />
prevailing weather conditions.<br />
Hormosira banksii<br />
Percent Cover<br />
0 10 30 50<br />
MS<br />
Reference<br />
2004 2005 2006 2007 2008 2009 2010 2011<br />
Year<br />
Figure 11.7. Mean percent cover (± Standard Error) of Neptune’s necklace Hormosira banksii at<br />
Barwon Bluff within the Barwon Bluff MS, and the Barwon Beach reference site.<br />
147
<strong>Parks</strong> <strong>Victoria</strong> Technical Series No. 70<br />
<strong>Intertidal</strong> <strong>Reef</strong> <strong>Monitoring</strong> <strong>Program</strong><br />
11.5 Mobile Invertebrates<br />
The mobile invertebrate assemblages Barwon Bluff and Barwon Beach sites were both<br />
dominated by gastropod snails, particularly the limpets Clypidina rugosa, Notoacmea mayi,<br />
and Cellana tramoserica, conniwinks Bembicium nanum, and periwinkles Nodilittorina<br />
acutispira and N. unifasciata.<br />
The periwinkle Nodilittorina acutispira was present in high densities at both sites in 2007,<br />
particularly at Barwon Beach, in the mid to low region of the intertidal platforms in 2007. The<br />
abundance of N. acutispira decrease drastically to 2009, and it was not recorded at either<br />
site during the 2010 survey (Figure 11.8). The highly variable abundance of this species has<br />
also been observed at other sites during the monitoring program.<br />
The limpet Clypidina rugosa was the most consistently abundant species at both sites,<br />
although it decreased in abundance by around 50 % in 2010. There was a steady decrease<br />
in the abundance of Siphonaria spp. at Barwon Bluff; from 43 per 0.25 m 2 in January 2005 to<br />
just 2 per 0.25 m 2 in May 2009. Abundances then rose sharply to 25 per 0.25 m 2 in 2010.<br />
Abundances of Cellana tramoserica were relatively stable throughout the monitoring period<br />
and were consistently higher at Barwon Bluff (Figure 11.10). The predatory gastropods<br />
Cominella lineolata and Dicathais orbita were low in abundance at both sites during all<br />
surveys.<br />
Between 2004 and 2009, the mean length of Cellana tramoserica at Barwon Bluff increased<br />
steadily from 17 mm to 36 mm. A slight decrease in 2010 interrupted this trend. The mean<br />
size coincidentally increased during 2010 at there reference Barwon Beach site from 20 to<br />
26 mm (Figure 11.9).<br />
148
<strong>Parks</strong> <strong>Victoria</strong> Technical Series No. 70<br />
<strong>Intertidal</strong> <strong>Reef</strong> <strong>Monitoring</strong> <strong>Program</strong><br />
a.<br />
Nodilittorina acutispira<br />
Density (per quadrat)<br />
0 500 1000 1500<br />
MS<br />
Reference<br />
b.<br />
2004 2005 2006 2007 2008 2009 2010 2011<br />
Year<br />
Clypidina rugosa<br />
Density (per quadrat)<br />
0 20 40 60 80<br />
MS<br />
Reference<br />
c.<br />
2004 2005 2006 2007 2008 2009 2010 2011<br />
Year<br />
Cellana tramoserica<br />
Density (per quadrat)<br />
0 1 2 3 4 5 6<br />
MS<br />
Reference<br />
2004 2005 2006 2007 2008 2009 2010 2011<br />
Year<br />
Figure 11.8. Mean Density (±Standard Error) of: (a) Nodilittorina acutispira; (b) the limpet Clypidina<br />
rugosa; and (c) the limpet Cellana tramoserica at Barwon Bluff within the Barwon Bluff MS, and the<br />
Barwon Beach reference site.<br />
149
<strong>Parks</strong> <strong>Victoria</strong> Technical Series No. 70<br />
<strong>Intertidal</strong> <strong>Reef</strong> <strong>Monitoring</strong> <strong>Program</strong><br />
Cellana tramoserica<br />
Length (mm)<br />
0 10 20 30 40<br />
MS<br />
Reference<br />
2004 2005 2006 2007 2008 2009 2010 2011<br />
Year<br />
Figure 11.9. Mean sizes (± Standard Error) of the limpet Cellana tramoserica at Barwon Bluff, within<br />
the Barwon Bluff MS, and the Barwon Beach reference site.<br />
150
<strong>Parks</strong> <strong>Victoria</strong> Technical Series No. 70<br />
<strong>Intertidal</strong> <strong>Reef</strong> <strong>Monitoring</strong> <strong>Program</strong><br />
11.6 Condition Indicators<br />
Biodiversity<br />
Community composition was within the range of states and changes previously observed.<br />
Species richness and diversity levels were also within the range preciously observed at these<br />
sites.<br />
Introduced Species<br />
There were no introduced species detected for these sites.<br />
Ecosystem Function<br />
Total algal cover increased at both site from 2009 to 2010 and is high within the range<br />
previously observed (Figure 11.10a). Erect coralline algae cover was low and variable at<br />
both sites (Figure 11.10b). There has been a decreasing trend in the cover of turfing algae at<br />
both sites (Figure 11.10c).<br />
The total abundance of grazers has remained relatively stable at Barwon Bluff over the<br />
monitoring period, ranging between 50 and 80 per 0.25 m 2 (Figure 11.11a). The Total<br />
abundance of grazers at Barwon Beach has been more variable and decreased from 1400 to<br />
80 per 0.25 m 2 between 2007 and 2010 (Figure 11.11a). This is primarily due to changes in<br />
the abundance of the periwinkle Nodilittorina acutispira.<br />
Total predator abundance has been low and variable at both sites, and in 2010 it was within<br />
the range previously observed.<br />
Climate Change<br />
Two individuals of the sea hare Aplysia gigantea were found in a single quadrat at Barwon<br />
Bluff in January 2005. This species is often washed ashore on the New South Wales coast<br />
during summer, after spawning in shallow water. No individuals were recorded in any of the<br />
following surveys.<br />
Harvesting<br />
The density of Cellana tramoserica was low at Barwon Bluff MS throughout the monitoring.<br />
The decrease in density between 2006 and 2007 may indicate harvesting at this site in this<br />
period, however this evidence is inconclusive and the decline is likely to have been for other<br />
reasons. There were no indications of increasing harvesting pressure based on mean sizes.<br />
Trampling<br />
There is no evidence that trampling is a constraining factor on algal cover at either site.<br />
151
<strong>Parks</strong> <strong>Victoria</strong> Technical Series No. 70<br />
<strong>Intertidal</strong> <strong>Reef</strong> <strong>Monitoring</strong> <strong>Program</strong><br />
Environment<br />
The cover of green algal species indicative of nutrient loading was relatively low, < 2 %<br />
cover, at both sites during all surveys (Figure 11.12a).<br />
Sediment cover has steadily decreased at Barwon Bluff, from 20 % in 2006 to 10 % in 2010<br />
(Figure 11.12b). Sediment cover at Barwon Beach has been 5 % lower than at Barwon Bluff<br />
during the three most recent surveys.<br />
152
<strong>Parks</strong> <strong>Victoria</strong> Technical Series No. 70<br />
<strong>Intertidal</strong> <strong>Reef</strong> <strong>Monitoring</strong> <strong>Program</strong><br />
a.<br />
Total Algae Cover<br />
Percent Cover<br />
0 10 30 50 70<br />
MS<br />
Reference<br />
b.<br />
2004 2005 2006 2007 2008 2009 2010 2011<br />
Year<br />
Erect Coralline Algae Cover<br />
Percent Cover<br />
0 1 2 3 4<br />
MS<br />
Reference<br />
c.<br />
2004 2005 2006 2007 2008 2009 2010 2011<br />
Year<br />
Turf Algae Cover<br />
Percent Cover<br />
0 5 10 15<br />
MS<br />
Reference<br />
2004 2005 2006 2007 2008 2009 2010 2011<br />
Year<br />
Figure 11.10. Mean cover (± Standard Error) of: (a) all algae; (b) erect coralline algae; and (c) turfing<br />
algae at Barwon Bluff within the Barwon Bluff MS, and the Barwon Beach reference site.<br />
153
<strong>Parks</strong> <strong>Victoria</strong> Technical Series No. 70<br />
<strong>Intertidal</strong> <strong>Reef</strong> <strong>Monitoring</strong> <strong>Program</strong><br />
a.<br />
Total Grazers<br />
Density (per quadrat)<br />
0 500 1000 1500<br />
MS<br />
Reference<br />
b.<br />
2004 2005 2006 2007 2008 2009 2010 2011<br />
Year<br />
Total Predators<br />
Density (per quadrat)<br />
0.0 0.5 1.0 1.5<br />
MS<br />
Reference<br />
2004 2005 2006 2007 2008 2009 2010 2011<br />
Year<br />
Figure 11.11. Mean abundance (± Standard Error) of: (a) all grazers; and (b) all predators at Barwon<br />
Bluff within the Barwon Bluff MS, and the Barwon Beach reference site.<br />
154
<strong>Parks</strong> <strong>Victoria</strong> Technical Series No. 70<br />
<strong>Intertidal</strong> <strong>Reef</strong> <strong>Monitoring</strong> <strong>Program</strong><br />
a.<br />
Green Algae Cover<br />
Percent Cover<br />
0.0 1.0 2.0 3.0<br />
MS<br />
Reference<br />
b.<br />
2004 2005 2006 2007 2008 2009 2010 2011<br />
Year<br />
Sediment Cover<br />
Percent Cover<br />
0 5 10 15 20 25<br />
MS<br />
Reference<br />
2004 2005 2006 2007 2008 2009 2010 2011<br />
Year<br />
Figure 11.12. Mean cover (± Standard Error) of: (a) green algae (Ulva, Enteromorpha and Cladophora<br />
species); and (b) sediment at Barwon Bluff within the Barwon Bluff MS, and the Barwon Beach<br />
reference site.<br />
155
<strong>Parks</strong> <strong>Victoria</strong> Technical Series No. 70<br />
<strong>Intertidal</strong> <strong>Reef</strong> <strong>Monitoring</strong> <strong>Program</strong><br />
12 REFERENCES<br />
Anderson, H (1958) The gastropod genus Bembicium, Philippi. Australian Journal of Marine<br />
and Freshwater Research 9: 546-568.<br />
Clarke KR (1993) Non-parametric multivariate analyses of changes in community structure.<br />
Australian Journal of Ecology 18: 117-143.<br />
Hart S and Edmunds M (2003) Standard Operational Procedure: <strong>Intertidal</strong> <strong>Reef</strong> <strong>Monitoring</strong><br />
Australian Marine Ecology Operations Manual No. 235, Melbourne, 59 pp.<br />
Edmunds M, Hart S, Elias J and Power B (2004) <strong><strong>Victoria</strong>n</strong> <strong>Intertidal</strong> <strong>Reef</strong> <strong>Monitoring</strong><br />
<strong>Program</strong>: The <strong>Reef</strong> Biota in Central <strong>Victoria</strong> and Port Phillip Bay Marine Sanctuaries. <strong>Parks</strong><br />
<strong>Victoria</strong> Technical Series No. 11. <strong>Parks</strong> <strong>Victoria</strong>, Melbourne.<br />
Faith D, Minchin P and Belbin (1987) Compositional dissimilarity as a robust measure of<br />
ecological distance. Vegetation 69: 57-68.<br />
Fox D, Jacoby C and Molloy R (2000) Eastern Treatment Plant: <strong>Monitoring</strong> the Receiving<br />
Environment. <strong>Monitoring</strong> <strong>Program</strong> – 2001 to 2003. Report to the Melbourne Water<br />
Corporation. CSIRO Environmental Projects Office, Melbourne.<br />
Gilmour P and Edmunds M (2006) <strong><strong>Victoria</strong>n</strong> intertidal reef monitoring program: the intertidal<br />
reef biota of central <strong>Victoria</strong>’s marine protected areas. <strong>Parks</strong> <strong>Victoria</strong> Technical Series (in<br />
press). <strong>Parks</strong> <strong>Victoria</strong>, Melbourne.<br />
Hart SP and Edmunds M (2005) <strong>Parks</strong> <strong>Victoria</strong> Standard Operating Procedure: Biological<br />
<strong>Monitoring</strong> of <strong>Intertidal</strong> <strong>Reef</strong>s. <strong>Parks</strong> <strong>Victoria</strong> Technical Series No. 21, <strong>Parks</strong> <strong>Victoria</strong>,<br />
Melbourne.<br />
Keough MJ and King A (1991) Recommendations for monitoring of marine plant and animal<br />
populations in Wilsons Promontory National Park and the Bunurong Marine Park.<br />
Department of Zoology, Melbourne University.<br />
Krebs CJ (1999) Ecological Methodology, Second Edition. Benjamin/Cummings, Menlo Park.<br />
McCullagh P and Nelder JA (1989) Generalized Linear Models, Second Edition. Monographs<br />
on Statistics and Applied Probability 37.Chapman and Hall, London.<br />
Porter C and Wescott G (2010) Rocky Shores of Marine National <strong>Parks</strong> and Sanctuaries on<br />
the Surf Coast: Values, Uses and Impacts prior to protection. <strong>Parks</strong> <strong>Victoria</strong> Technical Series<br />
No. 22. <strong>Parks</strong> <strong>Victoria</strong>, Melbourne.<br />
156
<strong>Parks</strong> <strong>Victoria</strong> Technical Series No. 70<br />
<strong>Intertidal</strong> <strong>Reef</strong> <strong>Monitoring</strong> <strong>Program</strong><br />
Stuart-Smith R., Barrett N., Crawford C., Edgar G. and Frusher S. (2008) Condition of Rocky<br />
<strong>Reef</strong> Communities: A Key Marine Habitat around Tasmania. NRM/NHT Final Report.<br />
Tasmanian Aquaculture and Fisheries Institute, Hobart.<br />
Sweatman H, Cheal A, Coleman G, Fitzpatrick B, Miller I, Ninio R, Osborne K, Page C,<br />
Ryan D, Thompson A and Tomkins P (2000) Long-term <strong>Monitoring</strong> of the Great Barrier <strong>Reef</strong>.<br />
Status Report Number 4. Australian Institute of Marine Science, Townsville.<br />
157
<strong>Parks</strong> <strong>Victoria</strong> Technical Series No. 70<br />
<strong>Intertidal</strong> <strong>Reef</strong> <strong>Monitoring</strong> <strong>Program</strong><br />
13 ACKNOWLEDGEMENTS<br />
This project was funded by <strong>Parks</strong> <strong>Victoria</strong> and supervised by Dr Steffan Howe.<br />
158
<strong>Parks</strong> <strong>Victoria</strong> Technical Series No. 70<br />
<strong>Intertidal</strong> <strong>Reef</strong> <strong>Monitoring</strong> <strong>Program</strong><br />
APPENDIX A – SITE DETAILS<br />
Point Cooke Marine Sanctuary<br />
Point Cooke – Site 4107<br />
Site Description<br />
The intertidal area at Point Cooke is an extensive basalt rock platform and basalt boulder<br />
and cobble field. The Point Cooke Marine Sanctuary also forms part of a RAMSAR site and<br />
contributes habitat for migratory shorebirds. The intertidal area is 300-400 m long, extending<br />
from just north of Point Cooke to the south and west. Patches of sand and intertidal seagrass<br />
Zostera muelleri occur predominantly across the north-eastern section of the intertidal area,<br />
with more continuous patches of reef occurring further south and west. The intertidal reef is<br />
generally flat. However, small undulations across the reef mean that tidal inundation does not<br />
occur evenly across the reef. Strong southerly winds may cause large amounts of subtidal<br />
drift algae to be washed onto the intertidal reef area.<br />
Transect Layout<br />
The survey site was established on the largest continuous area of reef to the west of Point<br />
Cooke (Figure 4.1). Both the high-shore and low-shore baselines were 100 m long and were<br />
approximately parallel. The five transects between the baselines and were between 30 m<br />
and 35 m long.<br />
Appendix A Table 1.1. Site details for Point Cooke (Site 4107) in Point Cooke MS.<br />
Site:<br />
MPA/Ref:<br />
4107 Pt Cooke<br />
MPA<br />
Site coordinates<br />
Baseline<br />
position<br />
MGA<br />
Zone<br />
MGA<br />
Easting<br />
MGA<br />
Northing<br />
Longitude<br />
Latitude<br />
A 55 305876 5799893 144.7913 -37.9278<br />
B 55 305965 5799917 144.7923 -37.9276<br />
C 55 305890 5799858 144.7914 -37.9281<br />
D 55 305966 5799881 144.7923 -37.9279<br />
A1
<strong>Parks</strong> <strong>Victoria</strong> Technical Series No. 70<br />
<strong>Intertidal</strong> <strong>Reef</strong> <strong>Monitoring</strong> <strong>Program</strong><br />
Altona – Site 4108<br />
Site Description<br />
Altona, site 4108, is the reference site for Point Cooke MS. The intertidal area at Altona<br />
consists of basalt reef and boulder fields interspersed with sand and seagrass flats. The<br />
survey site was established on a relatively large and continuous area of solid basalt reef and<br />
basalt boulders directly adjacent to large patches of sand and seagrass. The intertidal reef is<br />
generally flat with most variation in substratum height occurring at the level of individual<br />
boulders rather than across the shore. Most boulders in the survey area are substantially<br />
bigger (approximately 20-40 cm diameter) than those occurring at Point Cooke.<br />
Consequently, there are a large number of crevices and a substantial area of vertical<br />
substratum on the sides of boulders. The survey site has an estuarine influence because of<br />
its proximity to Kororoit Creek.<br />
Transect Layout<br />
The high-shore baseline was straight, and did not follow the curve of the coastal defence<br />
wall. The high-shore baseline was 70 m long. The low-shore baseline was 75 m long.<br />
Transects ranged from 28 m at the eastern end of the site to 38 m at the western end.<br />
Appendix A Table 1.2. Site details for Altona (Site 4108), the reference site for Point Cooke MS.<br />
Site:<br />
MPA/Ref:<br />
4108 Altona<br />
Reference<br />
Site coordinates<br />
Baseline<br />
position<br />
MGA<br />
Zone<br />
MGA<br />
Easting<br />
MGA<br />
Northing<br />
Longitude<br />
Latitude<br />
A 55 310020 5806233 144.84 -37.8716<br />
B 55 310076 5806270 144.8407 -37.8713<br />
C 55 310035 5806204 144.8402 -37.8719<br />
D 55 310091 5806245 144.8409 -37.8715<br />
A2
<strong>Parks</strong> <strong>Victoria</strong> Technical Series No. 70<br />
<strong>Intertidal</strong> <strong>Reef</strong> <strong>Monitoring</strong> <strong>Program</strong><br />
Jawbone Marine Sanctuary<br />
Jawbone – Site 4109<br />
Site Description<br />
There is an extensive area of fractured basalt reef and boulder field at Jawbone Marine<br />
Sanctuary (Site 4109). The reef forms a band up to 30 m wide and extends for several<br />
hundred metres from the point at Jawbone, to the southwest boundary of the Sanctuary. The<br />
large basalt boulders create medium to high relief intertidal reef with considerable habitat<br />
structure because of the large amount of vertical substratum and crevices (Figure 5.1). The<br />
intertidal reef at Jawbone Marine Sanctuary has a large estuarine influence because of the<br />
proximity of Kororoit Creek and there is an area of mangrove and salt marsh habitat at the<br />
eastern end of the sanctuary. This area is also a RAMSAR site and is an important habitat<br />
for migratory shorebirds.<br />
Transect Layout<br />
The survey site was established on a continuous area of reef. The high-shore and low-shore<br />
baselines were 100 m in length and were parallel to shore. The five transects placed<br />
between the baselines were 6-18 m in length.<br />
Appendix A Table 1.3. Site details for Jawbone (Site 4109) in Jawbone MS.<br />
Site:<br />
MPA/Ref:<br />
4109 Jawbone<br />
MPA<br />
Site coordinates<br />
Baseline<br />
position<br />
MGA<br />
Zone<br />
MGA<br />
Easting<br />
MGA<br />
Northing<br />
Longitude<br />
Latitude<br />
A 55 313062 5807137 144.8748 -37.8641<br />
B 55 313136 5807068 144.8757 -37.8647<br />
C 55 313046 5807118 144.8747 -37.8642<br />
D 55 313123 5807057 144.8755 -37.8648<br />
A3
<strong>Parks</strong> <strong>Victoria</strong> Technical Series No. 70<br />
<strong>Intertidal</strong> <strong>Reef</strong> <strong>Monitoring</strong> <strong>Program</strong><br />
Williamstown – Site 4110<br />
Site Description<br />
The reference site for the Jawbone Marine Sanctuary was intertidal reef at Point Gellibrand,<br />
Williamstown (Site 4110). As at the Jawbone Marine Sanctuary, the intertidal area is a<br />
fractured basalt reef and boulder field. However, the boulders were smaller at Williamstown<br />
and consequently there was less vertical structure and fewer crevices (Figure 5.2). The<br />
intertidal reef has a south-westerly aspect.<br />
Transect Layout<br />
The high-shore baseline was 62 m. The low-shore baseline was 100 m in length. The five<br />
transects established were 30-44 m in length.<br />
Appendix A Table 1.4. Site details for Williamstown (Site 4110), the reference site for Jawbone MS.<br />
Site:<br />
MPA/Ref:<br />
4110 Williamstown<br />
Reference<br />
Site coordinates<br />
Baseline<br />
position<br />
MGA<br />
Zone<br />
MGA<br />
Easting<br />
MGA<br />
Northing<br />
Longitude<br />
Latitude<br />
A 55 315545 5806228 144.9028 -37.8728<br />
B 55 315531 5806210 144.9027 -37.8729<br />
C 55 315579 5806185 144.9032 -37.8732<br />
D 55 315618 5806206 144.9036 -37.873<br />
A4
<strong>Parks</strong> <strong>Victoria</strong> Technical Series No. 70<br />
<strong>Intertidal</strong> <strong>Reef</strong> <strong>Monitoring</strong> <strong>Program</strong><br />
Ricketts Point Marine Sanctuary<br />
Ricketts Point – Site 4111<br />
Site Description<br />
There are several sections of intertidal reef in the Ricketts Point Marine Sanctuary. The main<br />
intertidal reef is an extension of the Ricketts Point Headland. This reef is large<br />
(approximately 60 x 70 m) and encompasses several different habitat types including<br />
fractured basalt reef with prominent outcrops and steps, cobble field habitat and areas of<br />
intertidal mud and seagrass.<br />
The central region of the platform at Ricketts Point is solid basalt reef that is above the high<br />
tide mark and supports patches of the beaded glasswort Sarcocornia quinqueflora. To the<br />
north and south of the central region are cobble field and sediment habitats. The monitoring<br />
site was placed on solid basalt reef at the western seaward edge of the intertidal area, where<br />
the reef is fractured basalt with small boulders.<br />
Transect Layout<br />
The high shore baseline was 40 m long and ran north-south above a rock step. Below the<br />
rock step the shore sloped away more gradually. The low shore baseline was 40 m long and<br />
ran parallel to the high shore baseline. The low-shore baseline traversed Neptune’s necklace<br />
Hormosira banksii habitat and some shallow rock pools. There were also small basalt<br />
boulders towards the low tide mark. The five transects were between the baselines and were<br />
approximately 18 m long and 7 m apart.<br />
Appendix A Table 1.5. Site details for Ricketts Point (Site 4111) in Ricketts Point MS.<br />
Site:<br />
MPA/Ref:<br />
4111 Ricketts Point<br />
MPA<br />
Site coordinates<br />
Baseline<br />
position<br />
MGA<br />
Zone<br />
MGA<br />
Easting<br />
MGA<br />
Northing<br />
Longitude<br />
Latitude<br />
A 55 327001 5792953 145.0298 -37.9946<br />
B 55 327034 5792922 145.0302 -37.9949<br />
C 55 326994 5792949 145.0297 -37.9946<br />
D 55 327019 5792910 145.03 -37.995<br />
A5
<strong>Parks</strong> <strong>Victoria</strong> Technical Series No. 70<br />
<strong>Intertidal</strong> <strong>Reef</strong> <strong>Monitoring</strong> <strong>Program</strong><br />
Halfmoon Bay – Site 4112<br />
Site Description<br />
The reference site for Ricketts Point Marine Sanctuary was on a small area of intertidal reef<br />
at Halfmoon Bay (Site 4112). The main section of this reef is relatively flat basalt extending<br />
20 m north from a high-relief basalt outcrop. This tongue of reef is surrounded by water on<br />
three sides.<br />
Transect Layout<br />
The high shore baseline was placed along the eastern edge of the platform which is slightly<br />
higher than the western edge. The upper baseline was 25 m long and was laid parallel to the<br />
30 m long lower baseline. Transects running between the baselines were approximately 10<br />
m long and 5 m apart.<br />
Appendix A Table 1.6. Site details for Halfmoon Bay (Site 4112), the reference site for Ricketts Point<br />
MS.<br />
Site:<br />
MPA/Ref:<br />
4112 Halfmoon Bay<br />
Reference<br />
Site coordinates<br />
Baseline<br />
position<br />
MGA<br />
Zone<br />
MGA<br />
Easting<br />
MGA<br />
Northing<br />
Longitude<br />
Latitude<br />
A 55 325118 5795723 145.009 -37.9693<br />
B 55 325097 5795737 145.0088 -37.9692<br />
C 55 325114 5795712 145.009 -37.9694<br />
D 55 325090 5795729 145.0087 -37.9692<br />
A6
<strong>Parks</strong> <strong>Victoria</strong> Technical Series No. 70<br />
<strong>Intertidal</strong> <strong>Reef</strong> <strong>Monitoring</strong> <strong>Program</strong><br />
Point Addis Marine National Park<br />
Point Addis – Site 3901<br />
Site Description<br />
The main intertidal reef at Point Addis is a large and prominent tongue of intertidal platform<br />
that extends east from the base of cliffs northeast of Point Addis. This reef is long and is<br />
undulating in places. The platform is relatively low and large areas of this reef remain<br />
inundated during some tidal cycles. It is relatively exposed to wave action. The survey site is<br />
on a smaller patch of reef that fringes the coastal cliffs. It is a low-relief, uneven reef that<br />
drops steeply at the seaward edge into subtidal habitat. Undulations in the reef caused by<br />
weathering create patches of standing water.<br />
The intertidal reefs are exposed to the south and east. The Point Addis headland provides<br />
some protection from southwest winds and swell, although large waves from the southwest<br />
can wrap around Point Addis onto these reefs.<br />
The survey area bridges a large channel that intersects the baselines. Additional coordinates<br />
of this were recorded and the affected transects shifted appropriately.<br />
Transect Layout<br />
The high and low baselines were 74 m and 81 m in length respectively. Transects range in<br />
length from 16 m at Transect 1 to 22 m at Transect 5.<br />
Appendix A Table 1.7. Site details for Point Addis (Site 3901) in Point Addis MNP.<br />
Site:<br />
MPA/Ref:<br />
3901 Point Addis<br />
MPA<br />
Site coordinates<br />
Baseline<br />
position<br />
MGA<br />
Zone<br />
MGA<br />
Easting<br />
MGA<br />
Northing<br />
Longitude<br />
Latitude<br />
A 55 260162 5746979 144.2538 -38.3933<br />
B 55 260166 5747053 144.2539 -38.3926<br />
C 55 260177 5746972 144.254 -38.3933<br />
D 55 260185 5747055 144.2541 -38.3926<br />
A7
<strong>Parks</strong> <strong>Victoria</strong> Technical Series No. 70<br />
<strong>Intertidal</strong> <strong>Reef</strong> <strong>Monitoring</strong> <strong>Program</strong><br />
Winkipop – Site 3902<br />
Site Description<br />
The reference site for Point Addis Marine National Park was located to the east of the park at<br />
Winkipop reef. The intertidal area at Winkipop is a very low-relief, gently sloping reef. The<br />
area exposed at low tide is 30 to 50 m wide. This area is exposed to large southerly swell.<br />
There is a narrow band of sandy beach on the landward side of the reef. As at Point Addis,<br />
pools of standing water were common in undulations in the reef surface. This reef may be<br />
periodically subject to some sand inundation.<br />
Transect Layout<br />
Baselines were run parallel to shore and were 100 m long. Transects were evenly spaced<br />
every 25 m and each was approximately 35 m in length.<br />
Appendix A Table 1.8. Site details for Winkipop (Site 3902), the reference site for Point Addis MNP.<br />
Site:<br />
MPA/Ref:<br />
3902 Winkipop<br />
Reference<br />
Site coordinates<br />
Baseline<br />
position<br />
MGA<br />
Zone<br />
MGA<br />
Easting<br />
MGA<br />
Northing<br />
Longitude<br />
Latitude<br />
A 55 262913 5750014 144.2863 -38.3667<br />
B 55 262948 5750105 144.2867 -38.3659<br />
C 55 262942 5749997 144.2866 -38.3668<br />
D 55 262986 5750086 144.2871 -38.366<br />
A8
<strong>Parks</strong> <strong>Victoria</strong> Technical Series No. 70<br />
<strong>Intertidal</strong> <strong>Reef</strong> <strong>Monitoring</strong> <strong>Program</strong><br />
Point Danger Marine Sanctuary<br />
Point Danger – Site 4002<br />
Site Description<br />
The intertidal area at Point Danger is a large sandstone reef platform that is an extension of<br />
the Point Danger headland. The reef is exposed to the north, east and south, however most<br />
of the prevailing weather and waves are from the south and southwest. There are large<br />
areas of sandy beach to the west and north of the platform.<br />
The reef is a relatively flat sandstone platform which quickly drains or floods with the tide.<br />
The reef surface has been eroded to make it rugose, with a relief of 10-15 cm. Most of the<br />
reef is affected by sand inundation, with a thin layer of sand being present in many quadrats.<br />
The survey site is in the near shore region of the platform towards the south/west border of<br />
the sanctuary.<br />
Transect Layout<br />
The high and low-shore baselines are approximately transverse to the headland. Baseline<br />
lengths were 46 m each, with transects of 41-43 m, forming a square survey area.<br />
Appendix A Table 1.9. Site details for Point Danger (Site 4002) in Point Danger MS.<br />
Site:<br />
MPA/Ref:<br />
4002 Point Danger<br />
MPA<br />
Site coordinates<br />
Baseline<br />
position<br />
MGA<br />
Zone<br />
MGA<br />
Easting<br />
MGA<br />
Northing<br />
Longitude<br />
Latitude<br />
A 55 266413 5753027 144.3273 -38.3405<br />
B 55 266446 5753068 144.3277 -38.3401<br />
C 55 266447 5753006 144.3277 -38.3407<br />
D 55 266483 5753039 144.3281 -38.3404<br />
A9
<strong>Parks</strong> <strong>Victoria</strong> Technical Series No. 70<br />
<strong>Intertidal</strong> <strong>Reef</strong> <strong>Monitoring</strong> <strong>Program</strong><br />
Point Danger West – Site 4001<br />
Site Description<br />
The reference site, Point Danger West, is separated from the Point Danger intertidal platform<br />
by a short section of sandy beach. As with Point Danger, the sandstone platform has been<br />
eroded to create an uneven surface at the scale of 10s centimetres. This reef is subject to<br />
significant sand inundation.<br />
Transect Layout<br />
The site baselines were 50 m, with transects of 30 m.<br />
Appendix A Table 1.10. Site details for Point Danger West (Site 4001), the reference site for Point<br />
Danger MS.<br />
Site:<br />
MPA/Ref:<br />
4001 Pt Danger West<br />
Reference<br />
Site coordinates<br />
Baseline<br />
position<br />
MGA<br />
Zone<br />
MGA<br />
Easting<br />
MGA<br />
Northing<br />
Longitude<br />
Latitude<br />
A 55 266093 5752959 144.3236 -38.341<br />
B 55 266143 5752979 144.3242 -38.3408<br />
C 55 266099 5752928 144.3237 -38.3413<br />
D 55 266144 5752946 144.3242 -38.3411<br />
A10
<strong>Parks</strong> <strong>Victoria</strong> Technical Series No. 70<br />
<strong>Intertidal</strong> <strong>Reef</strong> <strong>Monitoring</strong> <strong>Program</strong><br />
Barwon Bluff Marine Sanctuary<br />
Barwon Bluff – Site 4004<br />
Site Description<br />
The intertidal reef at Barwon Bluff is composed of sections of sandstone and basalt reef. The<br />
intertidal rock platform extends from the end of Barwon Bluff as a pincer-shaped reef. The<br />
north-eastern section of the pincer is a basalt platform and boulder reef. This section of the<br />
reef is relatively protected from swell but has a large estuarine influence from the adjacent<br />
mouth of the Barwon River. The south-western section of the pincer is a relatively flat<br />
sandstone reef, which is more exposed to large swells and sand inundation due to its<br />
exposure towards the south and proximity to an adjacent surf beach and strong cross-shore<br />
currents. The survey site is on the sandstone section of the reef (Figure 12.1).<br />
The sandstone platform has three large rockpools in the centre of the survey area. The<br />
transects to not intercept any of these pools. Relief 5-10 cm high is present as ripples in the<br />
platform. These ripples act as traps for cross-shore sand movement. The edge of the<br />
platform drops sharply into subtidal habitat.<br />
Transect Layout<br />
At the high shore end of the platform there is a distinctive rise in shore height. This has been<br />
encompassed by the high shore baseline which follows this contour for 52 m. The low shore<br />
baseline borders rockpools on the south-western corner and is 53 m long. Transect lengths<br />
range from 47 m at Transect 1 to 49 m at Transect 5.<br />
Appendix A Table 1.11. Site details for Barwon Bluff (Site 4004) in Barwon Bluff MS.<br />
Site:<br />
MPA/Ref:<br />
4004 Barwon Bluff<br />
MPA<br />
Site coordinates<br />
Baseline<br />
position<br />
MGA<br />
Zone<br />
MGA<br />
Easting<br />
MGA<br />
Northing<br />
Longitude<br />
Latitude<br />
A 55 281293 5758960 144.4992 -38.2908<br />
B 55 281339 5758952 144.4998 -38.2909<br />
C 55 281289 5758913 144.4992 -38.2912<br />
D 55 281352 5758904 144.4999 -38.2913<br />
A11
<strong>Parks</strong> <strong>Victoria</strong> Technical Series No. 70<br />
<strong>Intertidal</strong> <strong>Reef</strong> <strong>Monitoring</strong> <strong>Program</strong><br />
Barwon Beach – Site 4003<br />
Site Description<br />
To the west of the intertidal platform at Barwon Bluff, there are several smaller isolated<br />
patches of intertidal sandstone reef. These reefs are directly exposed to large southerly<br />
swells and sand inundation due to their proximity to the adjacent surf beach and strong<br />
longshore currents. The reef surface has been weathered to create an uneven surface at the<br />
scale of 10s of centimetres. The reference site is on one of these reefs, approximately 400 m<br />
west of Barwon Bluff, directly below a set of access stairs. These stairs are the closest<br />
access point and are the first set west of Barwon Bluff.<br />
The reef structure is rugose with many depressions or rock pools approximately 20 cm in<br />
depth and 20-100 cm in diameter. It is more rugose than the Barwon Bluff Marine Sanctuary<br />
(Site 4004).<br />
Transect Layout<br />
The high shore baseline runs parallel to the shore for 45 m and follows the same shore<br />
height contour as at Barwon Bluff. The low shore baseline is 37 m long and is angled back<br />
towards shore such that Transect 1 is 33 m long and Transect 5 is 24 m long.<br />
Appendix A Table 1.12. Site details for Barwon Beach (Site 4003), the reference site for Barwon Bluff<br />
MS.<br />
Site:<br />
MPA/Ref:<br />
4003 Barwon Beach<br />
Reference<br />
Site coordinates<br />
Baseline<br />
position<br />
MGA<br />
Zone<br />
MGA<br />
Easting<br />
MGA<br />
Northing<br />
Longitude<br />
Latitude<br />
A 55 280828 5759028 144.4939 -38.2901<br />
B 55 280873 5759015 144.4945 -38.2902<br />
C 55 280828 5758994 144.4939 -38.2904<br />
D 55 280864 5758990 144.4943 -38.2904<br />
A12
<strong>Parks</strong> <strong>Victoria</strong> Technical Series No. 70<br />
<strong>Intertidal</strong> <strong>Reef</strong> <strong>Monitoring</strong> <strong>Program</strong><br />
Port Phillip Heads Marine National Park<br />
Point Lonsdale – Site 2823<br />
Site Description<br />
The intertidal reef surveyed for the Port Phillip Heads Marine National Park was located at<br />
Point Lonsdale. This is on the western side of Port Phillip Heads with an extensive,<br />
triangularly shaped intertidal platform projecting eastwards from the Point Lonsdale<br />
headland. The low relief calcarenite site is uneven in patches as a result of exposure to<br />
strong weather and wave action. The intertidal platform is subject to a high level of trampling<br />
by the public.<br />
Transect Layout<br />
The survey area is on the southern expanse of reef. The transect layout was simple with high<br />
and low shore baselines of 100 m, separated by 50-60 m long transects.<br />
Appendix A Table 1.13. Site details for Point Lonsdale (Site 2823) in Port Phillip Heads MNP.<br />
Site:<br />
MPA/Ref:<br />
2823 Pt Lonsdale<br />
MPA<br />
Site coordinates<br />
Baseline<br />
position<br />
MGA<br />
Zone<br />
MGA<br />
Easting<br />
MGA<br />
Northing<br />
Longitude<br />
Latitude<br />
A 55 291321 5759033 144.6138 -38.2925<br />
B 55 291418 5759009 144.6149 -38.2928<br />
C 55 291301 5758977 144.6136 -38.293<br />
D 55 291397 5758951 144.6147 -38.2933<br />
A13
<strong>Parks</strong> <strong>Victoria</strong> Technical Series No. 70<br />
<strong>Intertidal</strong> <strong>Reef</strong> <strong>Monitoring</strong> <strong>Program</strong><br />
Cheviot Bay – Site 2824<br />
Site Description<br />
The intertidal reef is less extensive than at Point Lonsdale and is interrupted by large rock<br />
pools and tidal channels. The reef at this site is exposed to the prevailing south-westerly<br />
weather and sub-maximal wave conditions. The low relief survey area is located immediately<br />
to the east of the Point Nepean section of the Port Phillips Heads Marine National Park, with<br />
the western end of Cheviot Beach being included within the Marine Park Boundary. It is in an<br />
area of restricted access because of unexploded ordinance in the vicinity and thus is<br />
protected from the high levels of human trampling that occur at Point Lonsdale. Special<br />
permission for the management authority (<strong>Parks</strong> <strong>Victoria</strong>) is required.<br />
Transect Layout<br />
The high shore baseline of the survey area followed the contour of the shore for 85 m. The<br />
low shore baseline was 100 m long and was run at a slight angle giving Transect 1 a length<br />
of 35 m compared to 52 m for Transect 5.<br />
Appendix A Table 1.14. Site details for Cheviot Bay (Site 2824), the reference site for Port Phillip<br />
Heads MNP.<br />
Site:<br />
MPA/Ref:<br />
2824 Cheviot Bay<br />
Reference<br />
Site coordinates<br />
Baseline<br />
position<br />
MGA<br />
Zone<br />
MGA<br />
Easting<br />
MGA<br />
Northing<br />
Longitude<br />
Latitude<br />
A 55 295939 5756879 144.666 -38.313<br />
B 55 296006 5756827 144.6667 -38.3135<br />
C 55 295916 5756854 144.6657 -38.3132<br />
D 55 295983 5756778 144.6664 -38.3139<br />
A14
<strong>Parks</strong> <strong>Victoria</strong> Technical Series No. 70<br />
<strong>Intertidal</strong> <strong>Reef</strong> <strong>Monitoring</strong> <strong>Program</strong><br />
Mushroom <strong>Reef</strong> Marine Sanctuary<br />
Mushroom <strong>Reef</strong> – Site 2907<br />
Site Description<br />
Mushroom <strong>Reef</strong> is a basalt intertidal reef in the shape of a mushroom when observed from<br />
the air. There is a large intertidal isthmus (the stem of the mushroom) that is composed of<br />
basalt pebbles and boulders. Sections of the isthmus tend to inundate with water soon after<br />
the tide begins to rise. The head of the mushroom is low-relief but uneven basalt reef with<br />
some pebbles and boulders. The highest section of the reef is the centre of the head of the<br />
mushroom. This area slopes away gently to the subtidal at its outer edge. Mushroom <strong>Reef</strong> is<br />
exposed on all sides, but is protected from large swell a shallow reef further offshore.<br />
Transect Layout<br />
The survey site at Mushroom <strong>Reef</strong> was positioned at the south eastern side of the head of<br />
the mushroom as this is representative of the predominant intertidal habitat. The baselines<br />
were 100 m long and parallel to shore. Transects were 40-45 m long and separated by 25 m.<br />
Appendix A Table 1.15. Site details for Mushroom <strong>Reef</strong> (Site 2907) in Mushroom <strong>Reef</strong> MS.<br />
Site:<br />
MPA/Ref:<br />
2907 Mushroom <strong>Reef</strong><br />
MPA<br />
Site coordinates<br />
Baseline<br />
position<br />
MGA<br />
Zone<br />
MGA<br />
Easting<br />
MGA<br />
Northing<br />
Longitude<br />
Latitude<br />
A 55 327050 5738412 145.0171 -38.4859<br />
B 55 327151 5738408 145.0182 -38.4859<br />
C 55 327054 5738374 145.0171 -38.4862<br />
D 55 327153 5738363 145.0182 -38.4863<br />
A15
<strong>Parks</strong> <strong>Victoria</strong> Technical Series No. 70<br />
<strong>Intertidal</strong> <strong>Reef</strong> <strong>Monitoring</strong> <strong>Program</strong><br />
Flinders West – Site 2908<br />
Site Description<br />
The reference site for Mushroom <strong>Reef</strong> was on the nearest intertidal platform to the west of<br />
the marine sanctuary. The intertidal area at Flinders West is a low-relief gently sloping basalt<br />
reef with occasional small steps and boulder outcrops. Patches of sand covered areas at the<br />
lowest reef extent. As with Mushroom <strong>Reef</strong>, Flinders West has a south-easterly aspect and is<br />
moderately sheltered from wind and waves from the southwest. It is also protected from large<br />
swell by a shallow reef further offshore.<br />
Transect Layout<br />
Baselines were run on the eastern side of the reef and were fanned out across the<br />
triangularly shaped intertidal platform. The high shore baseline was approximately 55 m long<br />
while the low shore baseline was approximately 70 m long. Transects increase in length<br />
along these baselines with Transect 1 measuring 27 m and Transect 5 measuring 62 m.<br />
Appendix A Table 1.16. Site details for Flinders West (Site 2908), the reference site for Mushroom<br />
<strong>Reef</strong> MS.<br />
Site:<br />
MPA/Ref:<br />
2908 Flinders West<br />
Reference<br />
Site coordinates<br />
Baseline<br />
position<br />
MGA<br />
Zone<br />
MGA<br />
Easting<br />
MGA<br />
Northing<br />
Longitude<br />
Latitude<br />
A 55 326497 5739009 145.0109 -38.4804<br />
B 55 326549 5738995 145.0115 -38.4805<br />
C 55 326496 5739005 145.0109 -38.4804<br />
D 55 326561 5738983 145.0116 -38.4806<br />
A16
<strong>Parks</strong> <strong>Victoria</strong> Technical Series No. 70<br />
<strong>Intertidal</strong> <strong>Reef</strong> <strong>Monitoring</strong> <strong>Program</strong><br />
Bunurong Marine National Park<br />
Eagles Nest – Site 3020<br />
Site Description<br />
Located on the eastern side of the Eagles Nest headland, Site 3020 was selected as being<br />
representative of the predominant habitat type of the area. The site is on the eastern side of<br />
the Marine National Park. It has an east facing aspect with the Eagles Nest headland<br />
sheltering it from the north and west. It is exposed to swells from the southeast, but not<br />
directly exposed to the prevailing south and southwest swell. The reef platform is relatively<br />
flat with little relief.<br />
Transect Layout<br />
High and low shore baselines were 56 m and 48 m, respectively. The transects range in<br />
length from 25 m at Transect 1 to 50 m at Transect 5.<br />
Appendix A Table 1.17. Site details for Eagles Nest (Site 3020) in Bunurong MNP.<br />
Site:<br />
MPA/Ref:<br />
3020 Eagles Nest<br />
MPA<br />
Site coordinates<br />
Baseline<br />
position<br />
MGA<br />
Zone<br />
MGA<br />
Easting<br />
MGA<br />
Northing<br />
Longitude<br />
Latitude<br />
A 55 384362 5719082 145.6708 -38.6693<br />
B 55 384326 5719129 145.6703 -38.6689<br />
C 55 384382 5719098 145.671 -38.6692<br />
D 55 384372 5719143 145.6709 -38.6688<br />
A17
<strong>Parks</strong> <strong>Victoria</strong> Technical Series No. 70<br />
<strong>Intertidal</strong> <strong>Reef</strong> <strong>Monitoring</strong> <strong>Program</strong><br />
Cave – Site 3021<br />
Site Description<br />
The reference site is at the Caves (Site 3021), located to the east of Bunurong Marine<br />
National Park. The site is situated directly below the access stairs from the Caves carpark.<br />
As with Eagles Nest, the reef substratum is mudstone, has a southeast facing aspect and is<br />
sheltered from the north and west by the Caves headland. The reef is exposed to southeast<br />
and southerly swell but is more sheltered from direct exposure to the prevailing southwest<br />
swell. There is a large area platform at this site, with little rugose structure or relief. On the<br />
eastern end of the survey area (Transect 5), there is more structure with large rocky outcrops<br />
towards the high shore level.<br />
Transect Layout<br />
Baselines were 48 m long and transects ranged from 80 m in length at Transect 1 to 100 m<br />
in length at Transect 5.<br />
Appendix A Table 1.18. Site details for the Caves (Site 3021), the reference site for Bunurong MNP.<br />
Site:<br />
MPA/Ref:<br />
3021 Caves<br />
Reference<br />
Site coordinates<br />
Baseline<br />
position<br />
MGA<br />
Zone<br />
MGA<br />
Easting<br />
MGA<br />
Northing<br />
Longitude<br />
Latitude<br />
A 55 385203 5719868 145.6805 -38.6623<br />
B 55 385209 5719911 145.6806 -38.6619<br />
C 55 385281 5719858 145.6814 -38.6624<br />
D 55 385304 5719898 145.6817 -38.6621<br />
A18
<strong>Parks</strong> <strong>Victoria</strong> is responsible for managing the <strong><strong>Victoria</strong>n</strong> protected<br />
area network, which ranges from wilderness areas to metropolitan<br />
parks and includes both marine and terrestrial components.<br />
Our role is to protect the natural and cultural values of the parks<br />
and other assets we manage, while providing a great range of<br />
outdoor opportunities for all <strong><strong>Victoria</strong>n</strong>s and visitors.<br />
A broad range of environmental research and monitoring activities<br />
supported by <strong>Parks</strong> <strong>Victoria</strong> provides information to enhance park<br />
management decisions. This Technical Series highlights some of<br />
the environmental research and monitoring activities done within<br />
<strong>Victoria</strong>’s protected area network.<br />
Healthy <strong>Parks</strong> Healthy People<br />
For more information contact the <strong>Parks</strong> <strong>Victoria</strong> Information Centre<br />
on 13 1963, or visit www.parkweb.vic.gov.au


