Eurbase - International Bird Strike Committee
Eurbase - International Bird Strike Committee
Eurbase - International Bird Strike Committee

You also want an ePaper? Increase the reach of your titles
YUMPU automatically turns print PDFs into web optimized ePapers that Google loves.
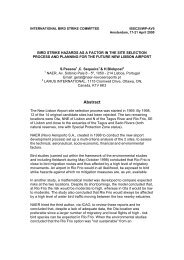
INTERNATIONAL BIRD STRIKE COMMITTEE<br />
IBSC27/WP IX-5<br />
Athens, 23-27 May 2005<br />
EURBASE: MILITARY BIRD STRIKE FREQUENCY IN EUROPE<br />
Arie Dekker & Hans van Gasteren<br />
Royal Netherlands Air Force, PO Box 20703, 2500 ES The Hague,<br />
The Netherlands<br />
Tel: +31 70 339 6348, Email: sneb@stl.af.dnet.mindef.nl<br />
Abstract<br />
This paper should be considered as a progress report of the EURBASE project (European Military <strong>Bird</strong><br />
<strong>Strike</strong> Database). The contributions from participating Air Forces – as received by the summer of 2004<br />
-- are presented and used for an analysis of the bird strike frequency of different Air Forces.<br />
Using flying hours as provided by the Air Forces Flight Safety <strong>Committee</strong> Europe (AFSCE), ratios<br />
were calculated for 9 Air Forces over the 10 years period 1991 – 2000. Restricted to jet fighters enroute<br />
and taking into account differences in damage patterns, normalised bird strike ratios are<br />
presented. These ratios vary considerable between the different Air Forces and are used to calculate<br />
the average yearly number of non-local bird strikes with jetfighters in Europe.<br />
Using GIS techniques on the normalised ratios a bird strike density map of Europe is calculated.<br />
Comparing this bird strike density map with a map of bird strike danger area´s (Anonymous 1979)<br />
learns that maps as a prevention tool are to coarse, to general, based on birds on the ground and to<br />
difficult to integrate in day-to-day operations. En-route bird strike prevention is far better served with<br />
dynamic models in which bird mobility is predicted in time and 3D space. The outcome of such models<br />
should be available for the pilots as end-users in their operational planning system.<br />
Keywords: military statistics, jet fighters, en-route, bird strike ratio, geographical distribution.<br />
1. Introduction<br />
1.1. Background<br />
After years of contributing bird strike summaries to the Air Forces Flight Safety <strong>Committee</strong> Europe<br />
(AFFSC(E)) it was recognised in the late 1980’s that collecting the actual details of bird strikes in one<br />
combined European Military <strong>Bird</strong> <strong>Strike</strong> Database (EURBASE) would yield much more information. At<br />
the 20th IBSC meeting in 1990 a preliminary study on the bird strike reports over the year 1988 of six<br />
Air Forces was presented (Dekker & Buurma 1990). From then on the database increased rapidly, not<br />
in the least because along with new data also data from previous years was contributed.<br />
Standardisation of data was encouraged by the introduction of EURFORM, the European Military <strong>Bird</strong><br />
<strong>Strike</strong> Form (Dekker & Buurma 1992). The Military Agency for Standardisation (MAS) adopted<br />
EURFORM as an annex to the Standard NATO agreement 3879 FS. Over the years progress reports<br />
on the EURBASE project were presented for AFFSC(E) and IBSC (Dekker 1994, Buurma 1995 and<br />
1996; Buurma & Dekker 1992 and 1996). In most of the progress reports some results from analyses<br />
of EURBASE data was included. At the 24th IBSC meeting in 1998 an extensive inventory of quantity<br />
and completeness of the then available database of 34,564 bird strikes was presented (Dekker 1998).<br />
During the 26th IBSC meeting an extensive analysis on the basis of the then 40,640 contributed cases<br />
was presented. This shortly dealt with seasonal patterns of bird strikes but was mainly focussed on<br />
bird species in relation to flight phase of the aircraft and in relation to damage to the aircraft (Dekker,<br />
van Gasteren and Shamoun-Baranes, 2003).<br />
1
IBSC27/WP IX-5<br />
1.2. This report<br />
In order to reach as many potential contributors to the database as possible, in May 2003, after the<br />
26th IBSC meeting, a letter was sent to all 24 members of AFFSC(E). With this letter the flight safety<br />
departments were offered IBSC26/WP-ID2 and were requested to contribute missing data for their<br />
respective Air Force. Unfortunately hardly any reactions were received. In May 2004, via email,<br />
contact was sought with known bird strike experts from a number of these Air Forces. This resulted in<br />
data up to 2003 from a number of Air Forces that already contributed in previous years. This paper is<br />
first of all meant as feed-back to all the contributors of the database.<br />
Comparing the contributed number of bird strikes from different Air Forces does in itself not reveal<br />
much about the real extent of the bird strike problem in Europe. We therefore used bird strike<br />
information in combination with flying hours to calculate a bird strike ratio for en-route fighter aircraft<br />
from a selection of Air Forces over the period 1991 – 2000. Due to differences in reporting standards<br />
these ratios were normalised on the basis of the proportion of bird strikes that resulted in damage.<br />
This learned that en-route bird strike ratios are varying considerably between the Air Forces. Using<br />
information on the location of the bird strikes we then constructed a “bird strike density map” of<br />
Europe.<br />
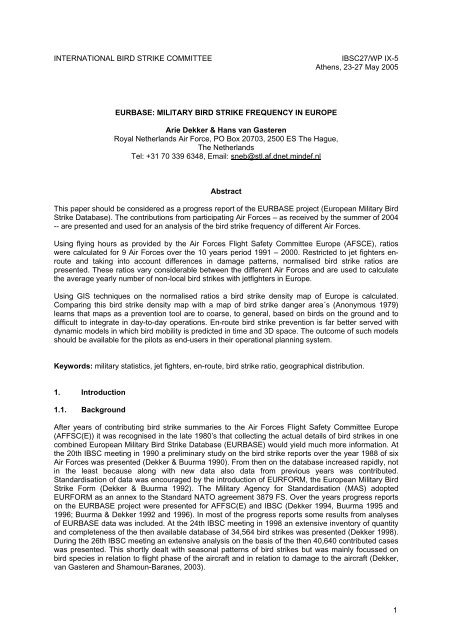
2. Contributions as per the end of 2004<br />
Despite several efforts (see para 1.2) the size of the database increased only little (plus 2.505 records)<br />
since the last report in May 2003 (Dekker et al., 2003). As is given in detail in annex 1 and shown in<br />
figure 1, both the number of contributed bird strikes as well as the number of contributing Air Forces<br />
per year is more or less stabilising. It is disappointing that despite the fact that all AFFSC(E) members<br />
were approached only a part of the Air Forces contribute to the database on a regular basis.<br />
Figure 1: Number of contributors and contributions per year in <strong>Eurbase</strong><br />
16<br />
14<br />
Number of Air Forces<br />
Number of <strong>Bird</strong> <strong>Strike</strong>s<br />
3000<br />
2500<br />
Number of Air Forces<br />
12<br />
10<br />
8<br />
6<br />
4<br />
2000<br />
1500<br />
1000<br />
500<br />
Number of <strong>Bird</strong> <strong>Strike</strong>s<br />
2<br />
0<br />
0<br />
1970 1975 1980 1985 1990 1995 2000 2005<br />
Years<br />
3. The number of bird strikes in Europe<br />
3.1. The number of bird strikes in Europe: Material and methods<br />
Comparing the bird strikes per year and per Air Force given in annex 1 is a futile activity. Fleet size<br />
and composition, operational use (both quantitative and qualitative) and the geographical theatre that<br />
is predominantly flown in, are all factors influencing these figures. A far better way of looking at it is<br />
2
Dekker & Gasteren<br />
using ratios (bird strikes per 10,000 flying hours). This rules out quantitative differences in fleet and<br />
operations between Air Forces. Fleet composition also has a great influence on the final numbers,<br />
there are considerable differences between carrier aircraft, helicopters and jet fighters. For this study<br />
we therefore selected jet fighters only. Narrowing the selection further down to non-local bird strikes<br />
(see annex 2) focuses the study to the situation en-route. We thus are comparing the “efficiency” of<br />
different Air Forces in sampling the sky for the presence of birds using jet fighters.<br />
In annex 1 it is indicated from which Air Force and for which years flying hours were available. On the<br />
basis of the availability of both bird strike data and flying hours we selected the period of 1991 – 2000<br />
and included 9 Air Forces (Belgium, France, Germany, Italy, United Kingdom, Denmark, Netherlands,<br />
Norway and Spain). In the few cases where flying hours were missing we calculated them by<br />
interpolation. Since operations in Europe have changed drastically since the end of the cold war we<br />
did not include the years before 1991.<br />
3.2. The number of bird strikes in Europe: Non-local bird strike ratios for jet fighters 1991-<br />
2000<br />
The calculated yearly average non-local bird strike ratios for jetfighters including the 95% confidence<br />
intervals are presented in figure 2. As is clear these ratios do vary considerable between Air Forces.<br />
The SAF scoring a ratio of only 2.6 (±1.3) while the GAF hitting 24.2 (±2.0) birds per 10,000 flying<br />
hours, nearly ten times as many. This surprising outcome made us look in more detail into the data.<br />
Since the data is of mixed origin we tried to determine whether there are consistent differences. We<br />
looked at the percentage damage for each Air Force as a clue for such phenomena (figure 3).<br />
30<br />
25<br />
<strong>Bird</strong> <strong>Strike</strong> ratio<br />
20<br />
15<br />
10<br />
5<br />
0<br />
BAF FAF GAF IAF RAF RDAF RNLAF RNOAF SAF<br />
Air Forces<br />
Figure 2: Mean and 95% confidence interval of the non-local <strong>Bird</strong> <strong>Strike</strong> Ratio (B S per 10,000 flying<br />
hours) per Air Force, Jets only, 1991-2000.<br />
100<br />
80<br />
Percentage damage<br />
60<br />
40<br />
20<br />
0<br />
BAF FAF GAF IAF RAF RDAF RNLAF RNOAF SAF<br />
Air Forces<br />
Figure 3: Mean and 95% confidence interval of the non-local percentage damage error Air Force, Jets<br />
only, 1991-2000<br />
3
IBSC27/WP IX-5<br />
The comparatively low BS ratio for the FA F of 10.9 (±3.3) is accompanied by a very high percentage<br />
of damage of 60.5 (±25.3), the large confidence interval indicating that this high percentage of damage<br />
is inconsistent through the years. In fact, during a number of years, only bird strikes with damage were<br />
contributed. For the GAF on the contrary, the high BS ratio of 24.2 (±2.0) is accompanied by the<br />
consistent low percentage of damage of 20.0 (±1.6). The differences in damage pattern indicate that<br />
there is no common definition of a bird strike.<br />
The differences in percentage damage between GAF and RAF were such that these Air Forces were<br />
looked at in more detail. The results are summarised in Annex 3. The overall conclusion is that both<br />
Air Forces have very complete and consistent reporting systems. The much higher proportion of BS of<br />
which the flight phase is unknown in the GAF means that in the GAF more bird strikes are reported<br />
that have not been noticed by the pilot. The high proportion of Passerines and Swallows in the GAF is<br />
also an indication for this. As a result the overall percentage of damage is much lower for the GAF.<br />
For the purpose of this analysis we assumed that one in five en-route bird strikes with jet fighters does<br />
on average result in damage. We then recalculated the ratios from figure 2 for all Air Forces to this<br />
20% damage standard. This resulted in figure 4 in which these normalised BS ratios are given, as well<br />
as the original ratios. We consider the normalised ratios to represent a realistic estimate of non-local<br />
bird strike ratios with jet fighters experienced in European Air Forces during the 1990´s.<br />
50<br />
normalised BS ratio<br />
original BS ratio<br />
40<br />
<strong>Bird</strong> <strong>Strike</strong> ratio<br />
30<br />
20<br />
10<br />
0<br />
BAF FAF GAF IAF RAF RDAF RNLAF RNOAF SAF<br />
Air Forces<br />
Figure 4: Mean and 95% confidence interval of the normalised and original non-local <strong>Bird</strong> <strong>Strike</strong> Ratio<br />
(number of <strong>Bird</strong> <strong>Strike</strong>s per 10,000 flying hours) per Air Force, Jets only, 1991-2000<br />
Normalising the original data to a 20% damage level did not decrease the large variation in BS ratios.<br />
The SAF and RNOAF scored the lowest ratio (SAF 5.2 ±3.2 and RNOAF 5.2 ±6.4) and the RAF as<br />
much as 41.7 (±5.8) bird strikes per 10,000 flying hours. Another striking feature in figure 4 is the<br />
deviation of the normalised ratios from the original data for FAF and RAF. Compared with the other Air<br />
Forces the FAF and RAF had very high percentages of damage in the original data, this resulted in<br />
significantly increased normalised ratio´s for those two Air Forces<br />
We do believe that the differences in ratio are related to the combined effect of differences in bird<br />
density in different European regions and differences between Air Forces in operational use of the<br />
airspace. One aspect of this operational use being the consequent inclusion of “bird migration<br />
warnings” in the planning process. The low ratio for RDAF and RNLAF compared to the neighbouring<br />
RAF and GAF is at least partly related to this. Another aspect is the flight altitude, with the RAF on<br />
average scoring a high proportion of BS at very low altitude.<br />
Combining the normalised ratios from figure 4 with the flying hours, the yearly mean number of nonlocal<br />
bird strikes with jet fighters over Europe during the 1990´s is calculated for each Air Force and<br />
subsequently totalled for all Air Forces. This resulted in an estimated number of bird strikes over<br />
4
Dekker & Gasteren<br />
Europe of 1,606 (±343) per year. Since the ratios from the different Air Forces do vary considerably<br />
these bird strikes are not evenly distributed over Europe.<br />
4. Geographical distribution of the bird strikes over Europe.<br />
4.1. Geographical distribution of the bird strikes over Europe: Material and methods<br />
Simply plotting the bird strikes with known location on a map does give a description of what actually<br />
happened but is not the best way to present the results. Projecting a number of BS on more or less<br />
the same location results in “piles” of dots, one on top of the other and thus obstructing a good view.<br />
Furthermore, the flying intensity of the contributing Air Forces must be taken into account. We<br />
therefore used the normalised bird strike ratios from figure 4 as the basis for our calculations. By<br />
means of a bootstrap technique a density map was created assuming 10,000 flying hours for each<br />
contributing Air Force. The idea behind the bootstrap technique is that for each Air Force the number<br />
of bird strikes (N) is determined randomly within the range of the mean ± 95% confidence intervals.<br />
From the total number of bird strikes with known latitude-longitude co-ordinates N locations are<br />
selected and stored. This procedure is repeated 200 times for each Air Force. The result is a collection<br />
of co-ordinates of which those that are within the map boundary are plotted. This dot-map is then<br />
converted to a density map of which the densities are divided back by 200 resulting in a map<br />
representing difference s in the bird strike risk for non-local jet fighters assuming all Air Forces realised<br />
10,000 flying hours.<br />
Unfortunately, of only 41.2 % of the 7,702 bird strikes in the selection the co-ordinates were given. It<br />
was, however, possible to add co-ordinates to another 1,022 bird strikes of which the location was<br />
given in the narrative, thu s raising the overall percentage of bird strikes with co-ordinates to 53.1<br />
varying from 37.8 for the FAF to<br />
65.6 for the IAF. In table 1 details are given about the availability of bird strike data used for this<br />
geographical analysis.<br />
IBSC27/WP IX-5<br />
Total BAF FAF GAF IAF RAF RDAF RNLA<br />
RNoA SAF<br />
F F<br />
Total 7,702 396 1,512 1,965 698 2,494 112 372 58 95<br />
Co-ordinates 3,174 105 536 981 224 1,074 63 141 13 37<br />
given<br />
% coordinates<br />
41.2% 26.5% 35.4% 49.9% 32.1% 43.1% 56.3% 37.9% 22.4% 38.9%<br />
given<br />
Co-ordinates 1,022 83 35 103 234 398 4 20 22 14<br />
added<br />
Co-ordinates 4,086 188 571 1,084 458 1,471 67 161 35 51<br />
known (total)<br />
% coordinates<br />
used (total)<br />
53.1% 47.5% 37.8% 55.2% 65.6% 59.0% 59.8% 43.3% 60.3% 53.7%<br />
Table 1: Availability of data for the geographical analysis of non-local bird strikes with jet fighters.<br />
5
IBSC27/WP IX-5<br />
4.2. Geographical distribution of the bird strikes over Europe: Results<br />
Using the data as summarised in table 1 and the bootstrap procedure described in para 4.1. the map<br />
in figure 5 has been produced. The map shows the relative density of non-local bird strikes with jet<br />
fighters in the 1990´s, assuming that all Air Forces<br />
realised 10,000 flying hours with their jet fighters.<br />
The map is based on 30,633 selected locations of which 29,292 (95.6%) were situated within the map<br />
boundary.<br />
Figure 5: <strong>Bird</strong> strike density in Europe for non-loc Jets, 1991-2000. N=29,292 within map boundaries.<br />
The map is smoothed to point-density with an output of 0.05 degree and a neighbourhood circle of 1<br />
mapunit. The map does not discriminate whether high densities are the result of increased bird<br />
intensities or of a concentration of flying hou rs in a particular a rea at a given altitude. The number of<br />
flying hours may be standa rdised to 10,000 hours, we do not know the geographical nor the altitude<br />
distribution of these flying h ours. So the map shows the combined effect of b ird and aircraft density<br />
regardless of altitude effects<br />
4. 3. Geographical distribution of the bird strikes over Europe: discussion.<br />
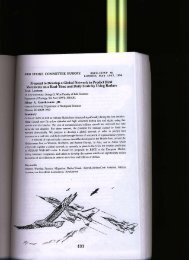
During the 1970 ´s a lot of effort was put into the composition of bird den sity maps for fligh t safety<br />
purposes by the “European <strong>Bird</strong> Movement Working Group” of the then <strong>Bird</strong> <strong>Strike</strong> <strong>Committee</strong> Europe.<br />
One of the first pro ducts of this Working Grou p was a set of maps<br />
of different European countries<br />
on<br />
which bird conce ntration ar eas as well as predominant migration<br />
routes were projected. This set of<br />
maps was published by the German Amt für Wehrgeophysik in 1973<br />
as a result of the co-operation<br />
of<br />
experts from 12 countries led by Dr. Hild (Anonymous,<br />
1973). Despite minimal co-operation in the<br />
following years (Hild 1977) in 1979 Dr. Hild succeeded in producing an integrated map of NW Europe<br />
indicating high and medium risk areas for different seasons (A nonymous , 1979). Figure 6 is a<br />
simplified reproduction of this map. <strong>Eurbase</strong> data from this study provides us the first opportunity to<br />
compare the 26 years old bird strike risk map of Dr. Hild with the actual bird strike density map of<br />
figure 5.<br />
6
Dekker & Gasteren<br />
Figure 6: <strong>Bird</strong> strike danger areas in Europe according to Hild (Anonymous 1979).<br />
Comparing Dr. Hilds map (figure 6) with the bird strike density map of figure 5 learns that there are<br />
striking differences. Most of the “bird strike danger areas” do indeed show high BS densities: Danish<br />
coast, inland parts of the Netherlands, along the river Donau, Po delta, along 3 major French rivers<br />
Loire, Garonne and Rhone. In the UK the same applies to the areas around the Firth of Forth, Moray<br />
Firth and the Solway Firth in Scotland, Lancaster and coastal area of North Wales, Severn estuary<br />
and the area around the Wash.<br />
On the other hand, some of the “<strong>Bird</strong> strike danger areas” only show very low bird strike densities:<br />
coastal part of the Netherlands, Norwegian coast, West coast of Scotland, South coast of England,<br />
river Seine and the South coast of Normandy. The most striking outcome of the comparison of the two<br />
maps is that vast areas of Europe are not classified on the map of Dr. Hild as “<strong>Bird</strong> strike danger area”<br />
and nevertheless show high bird strike densities.<br />
The above mentioned deviations are at least partly due to differences in aircraft density. That coastal<br />
parts of the Netherlands have only low BS density while being determined as a “<strong>Bird</strong> strike danger<br />
area” is easy to understand: the air space of the highly populated Western part of the Netherlands is<br />
more or less closed for yet fighters. Also the South coast of England is not regularly flown over with jet<br />
fighters (pers. comment Sqdr Ldr Mellings, RAF). The high BS ratios in large parts of Europe that are<br />
not recognised as “bird strike danger area” are probably due to high aircraft density at low level. Also<br />
broad front bird migration may be responsible for increased bird strike densities more or less diffusely<br />
distributed over large areas.<br />
5. Conclusions<br />
<strong>Bird</strong> strike ratios are varying considerably for different Air Forces. This variation in bird strike ratio is<br />
the result of geographical differences in the combined effect of bird density and aircraft density. Both<br />
are not evenly spread over Europe.<br />
<strong>Bird</strong> concentration areas are known for a long time and static maps might be useful in avoiding known<br />
“<strong>Bird</strong> strike danger areas” but they are not the most efficient tool in the overall prevention of bird<br />
strikes. Apart from the operational draw back that static paper maps sooner or later are “forgotten”, the<br />
7
IBSC27/WP IX-5<br />
information on such maps is too coarse, too general and based on birds on the ground, not on bird<br />
movement intensity. What is needed for en-route bird strike prevention are dynamic models in which<br />
bird mobility is predicted in time and three-dimensional space. The outcome of such models must be<br />
available for pilots in their operational planning systems. Only then peak bird densities (in time and 3D<br />
space) can successfully be avoided by jet fighters without loosing significant training opportunity.<br />
6. Acknowledgements<br />
Many people and organisations are to be credited for this paper. Needless to say that without the cooperation<br />
from the Air Forces there would be no EURBASE to work with. The contact persons in the<br />
contributing Air Forces were important in regularly providing the data in suitable formats. As custodian<br />
of EURBASE the Royal Netherlands Air Force (RNLAF) provided the time and facilities necessary for<br />
managing the database and analysing the data. Luit Buurma provided basic ideas and made valuable<br />
suggestions.<br />
7. References<br />
Anonymous (1973). Betriebsunterlagen für den Geophysikalischen Beratungsdienst der Bundeswehr<br />
Nr. 12 Vogelzug karten Europa (Vogelmassierungszentren und Vogelzug) Amt für Wehrgeophysik,<br />
Porz-Wahn, 1973.<br />
Anonymous (1979). Gebiete mit Vogelschlaggefahr in Europa (1:200.000). Ausgabe 1-DMG, 1979<br />
Series M30-BS. Amt für Wehrgeophysik, 1979.<br />
Buurma L.S. (1995). Sharing facts and figures on an open market: <strong>Bird</strong> <strong>Strike</strong> <strong>Committee</strong> Europe.<br />
Presentation for the Air Forces Flight Safety Committe (Europe), Toronto, Augustus 1995.<br />
Buurma L.S. (1996). <strong>Bird</strong> movements around airports: a critical issue in the specification of avoidance<br />
systems. Proc. of 23rd Meeting <strong>International</strong> <strong>Bird</strong> <strong>Strike</strong> <strong>Committee</strong>, London, May 1996.<br />
Buurma L.S. & A. Dekker (1992). <strong>Bird</strong> <strong>Strike</strong> Hazards<br />
to Helicopters. Paper nr 19 at the 18th European<br />
Rotorcraft Forum, Avignon, September 1992.<br />
Buurma L.S. & A. Dekker (1996). EURBASE: Potential lessons from military bird strike statistics. Proc.<br />
of 23rd Meeting <strong>International</strong> <strong>Bird</strong> <strong>Strike</strong> <strong>Committee</strong>, London, May 1996.<br />
Dekker A. (1994). The European Military <strong>Bird</strong> <strong>Strike</strong> Database. Progress Report. Proc. of 22st Meeting<br />
<strong>International</strong> <strong>Bird</strong> <strong>Strike</strong> <strong>Committee</strong>, Vienna, September 1994.<br />
Dekker A. (1998). EURBASE, limitations and opportunities. Proc. of 24th Meeting <strong>International</strong> <strong>Bird</strong><br />
<strong>Strike</strong> <strong>Committee</strong>, Stara Lesna, September 1998.<br />
Dekker A. & L.S. Buurma (1990). Towards a European Database of Military <strong>Bird</strong> <strong>Strike</strong>s. Proc. of 20st<br />
Meeting <strong>International</strong> <strong>Bird</strong> <strong>Strike</strong> <strong>Committee</strong>, Helsinki, September 1990.<br />
Dekker A. & L.S. Buurma (1992). The European Database of Military <strong>Bird</strong> <strong>Strike</strong>s, from proposal to<br />
reality. Proc. of 21st Meeting <strong>International</strong> <strong>Bird</strong> <strong>Strike</strong> <strong>Committee</strong>, Jerusalem, March 1992.<br />
Dekker A., H. van Gasteren and J. Shamoun-Baranes (1993). EURBASE, Progress report and first<br />
impressions on bird species. Proc. of 22 nd Meeting <strong>International</strong> <strong>Bird</strong> <strong>Strike</strong> <strong>Committee</strong>, Warsaw, May<br />
2003.<br />
Hild J. (1977). <strong>Bird</strong> Hazard Maps. Proc. of the Third World Conference on <strong>Bird</strong> Hazards to Aircraft,<br />
Paris, October 1977.<br />
8
Dekker & Gasteren<br />
Annex 1:<br />
Contributions to EURBASE per december 2004 per year and per Air Force<br />
Included in the analysis<br />
Flying hours available<br />
Year Air Forces <strong>Bird</strong> strikes BAF CZAF FAF GAF HAF IAF ISRAF POAF RAF RDAF RNLAFRNOAF SAF SKAF USAF<br />
1975 1 3 3<br />
1976 1 145<br />
145<br />
1977 2 281<br />
93 188<br />
1978 2 359<br />
179 180<br />
1979 4 670 155 378 136 1<br />
1980 5 1370 188 429 621 131 1<br />
1981 5 1580 206 503 693 175 3<br />
1982 5 1879 196 615 785 281 2<br />
1983 6 1924 170 655 104 768 224 3<br />
1984 5 1608 126 505 23 778 176<br />
1985 8 1858 70 474 112 743 151 25 1 282<br />
1986 8 1884 70 415 125 710 154 14 22 374<br />
1987 8 2058 180 580 138 679 181 13 9 278<br />
1988 10 2360 112 189 604 167 746 38 196 38 6 264<br />
1989 10 2499 115 180 623 262 638 45 243 37 20 336<br />
1990 12 2458 95 41 122 602 66 238 638 66 183 36 10 361<br />
1991 12 2189 75 25 221 497 101 247 589 51 92 26 11 254<br />
1992 12 1941 64 38 183 443 84 218 613 40 107 29 7 115<br />
1993 12 1887 70 23 211 489 184 170 533 46 93 36 13 19<br />
1994 14 1954 85 30 249 425 7 174 221 2 555 26 100 53 10 17<br />
1995 14 1794 67 33 156 367 15 186 194 9 506 32 108 33 65 23<br />
1996 13 1569 80 25 65 406 5 155 247 8 367 16 93 27 49 26<br />
1997 11 1581 88 12 289 383 50 153 10 434 28 77 20 23 14<br />
1998 8 1351 50 35 216 355 134 434 24 75 27 1<br />
1999 8 1590 50 35 345 418<br />
123 458 33 81 18 29<br />
2000 7 1129 40 28 371 118 435 30 74 18 15<br />
2001 6 1163 37 19 371 117 499 25 58 19 18<br />
2002 8 1030 33 354 43 493 29 50 16 12<br />
2003 7 1031 29 317 61 508 6 82 28<br />
Total 43145 1090 344 4059 11579 181 1595 2466 29 14223 535 3834 513 333 99 2265<br />
Annex 2: Hierarchical system used to designate bird strikes as being “local” or “en-route”.<br />
In this scheme field names from EURBASE are printed italic, attributed field contents are printed<br />
upper-cast and the result is printed bold upper-cast . A key to the abbreviations is added at the end.<br />
Non-local bird strikes are all bird strikes that are not designated as local<br />
1. If LAN is among the impact points the bird strike is considered being LOCAL, else:<br />
2. If flight phase is UNK the bird strike is considered UNK, else:<br />
3. If flight phase is TAX, TOF or LAN the bird strike is considered LOCAL, else:<br />
4. If flight phase is CRU or LLE the bird strike is considered ENR, else:<br />
5. If actype unequals JET<br />
5a. and flight phase is HOL, TGO or FAP the bird strike is considered LOCAL, else:<br />
5b. and flight phase is CLI or DES:<br />
5b1. and altitude is 2000ft or less the bird strike is considered LOCAL, else:<br />
5b2. and altitude is over 2000ft the bird strike is considered ENR, else:<br />
6. If actype is JET and flight phase is HOL or TGO or FAP or CLI or DES<br />
6a. and speed equals 300 kts or more the bird strike is considered ENR, else:<br />
6b. and speed is less than 300 kts the bird strike is considered LOCAL.<br />
9
IBSC27/WP IX-5<br />
UNK<br />
LAN<br />
TAX<br />
TOF<br />
CRU<br />
LLE<br />
JET<br />
HOL<br />
TGO<br />
CLI<br />
DES<br />
FAP<br />
Abbreviations used:<br />
= Unknown<br />
= Landing gear (impact point) or Landing (flight phase)<br />
= Taxiing (flight phase)<br />
= Take-Off (flight phase)<br />
= Cruise (flight phase)<br />
= Low level, En-route (flight phase)<br />
= Jet fighter aircraft (actype)<br />
= Holding (flight phase)<br />
= Touch and Go, Overshoot (flight phase)<br />
= Climb (flight phase)<br />
= Descent (flight phase)<br />
= Final Approach (flight phase)<br />
LOCAL bird strike occurred on an airfield or in the vicinity of it<br />
EN-ROUTE<br />
bird strike occurred off airfield while aircraft was en-route<br />
UNK<br />
unknown whether the bird strike was local or en-route<br />
Annex 3.<br />
Summay of details on bird strike data<br />
from GAF and RAF for non-local jetfighters 1991-2000<br />
GAF RAF<br />
<strong>Bird</strong> strike ratio 24.2 ±2.0 18.5 ±1.2<br />
% damage 20.0 ±1.6<br />
45.0 ±2.1<br />
% damage Tornado only 22.8 ±2.8<br />
48.0 ±5.4 (ANOVA, F=3,806, P=0,007)<br />
<strong>Bird</strong> species unknown 83.5% 85.1%<br />
% damage of above 17.1 47.2<br />
B ird species known 16..% 14.9%<br />
of which: proportion % damage proportion %<br />
damage<br />
Anatidae 3.4 63.5 1.9 100.0<br />
Accipitriidae 10.5 76.5 3.5 100.0<br />
Lariidae 29.2 74.2 68.5 65.4<br />
Columbidae 4.9 68.8 4.9 77.8<br />
Corvidae 2.5 62.5 3.5 69.2<br />
Charadriidae<br />
4.3 64.3 4.0 73.3<br />
Falconidae 3.4 45.5 1.6 83.3<br />
Sturnidae 1.2 50.0 3.8 57.1<br />
Apodidae 9.2 22.6 3.2 25.0<br />
Turdidae 3.4 18.2 0.5 100.0<br />
Passeriformes+Hirundidae 26.8 8.0 4.0 20.0<br />
Various 0.9 100.0 0,5 50.0<br />
% BS Flightphase unknown 51.6 ±4.7 29,3 ±3,2<br />
Average speed (kts) 407 (±2,5) 424 (±1,3) (T test, F=14,16, P=0,001)<br />
10