Introduction - International Bird Strike Committee
Introduction - International Bird Strike Committee
Introduction - International Bird Strike Committee

You also want an ePaper? Increase the reach of your titles
YUMPU automatically turns print PDFs into web optimized ePapers that Google loves.
INTERNATIONAL BIRD STRIKE COMMITTEE<br />
IBSC25/WP-AV10<br />
Amsterdam, 17-21 April 2000<br />
PREDICTING STRIKE HAZARDS FROM BIRD DATA:<br />
TOWARDS A DUTCH BAM AS A MODEL FOR A EUROPEAN BAM<br />
Ward Hagemeijer 1 , Luit Buurma 2 & Melina Verbeek 3 .<br />
1 SOVON (Dutch Center for Ornithology), Rijksstraatweg 178,<br />
6573 DG Beek-Ubbergen, The Netherlands<br />
Email: ward.hagemeijer@sovon.nl<br />
2 Royal Netherlands Air Force, The Netherlands<br />
3 University of Amsterdam, The Netherlands<br />
<strong>Introduction</strong><br />
Besides the fact that NW Europe is very densely populated, there is also a<br />
very high density of birds in this region. Especially wetland-birds are abundant<br />
and occur in often large concentrations. The distribution of both man and bird<br />
has a large impact on aviation in The Netherlands. There is a high demand for<br />
civil flights, but the nuisances of mass flight movements interfere with living<br />
standards of many people. There is little room to manoeuvre.<br />
In addition to this, mass occurrences of birds cause considerable birds strike<br />
hazards. Furthermore there is the legal aspect, where aviation causes<br />
disturbance and threatens protected sites. In this field of tension the<br />
discussion about birds and aviation has been high on the Dutch political and<br />
research agenda over the last years. There is a need to increase flight<br />
capacity in The Netherlands and the current locations have only limited<br />
growth potentials. In the search for alternative locations, bird strike hazard<br />
plays an important role. SOVON, Dutch Centre for Ornithology, was asked to<br />
prepare a map that quantifies bird strike hazards for The Netherlands.<br />
The Royal Netherlands Airforce has long known the problem of bird strikes<br />
and has developed a system of ‘notices to airmen’ to decrease bird strike<br />
risks. Radar based birds strike risk warnings are issued in case of heavy bird<br />
migration. This can result in a complete stop of flight activity. In contrast to<br />
what is practice with the United States Air Force, bird avoidance is only<br />
temporal, not geographic.<br />
On a European scale, addition of geographic avoidance can result in a much<br />
less severe impact on flight operations, in comparison with only temporal<br />
avoidance. Currently no system is available in Europe to implement such<br />
avoidance. In the United States a <strong>Bird</strong> Avoidance Model is operational. The
140<br />
Hagemeijer, Buurma & Verbeek<br />
interest to develop such a similar, and compatible system in (and beyond)<br />
Europe is high and still growing.<br />
Experiences gained in the making of the bird strike risk map for The<br />
Netherlands provide a good starting point for the development of a full grown<br />
<strong>Bird</strong> Avoidance Model, both on a Dutch and a European scale. The richness<br />
in data sources on bird distribution and bird numbers make The Netherlands<br />
an ideal testing arena for such a model.<br />
This paper presents the way the national bird strike risk maps were made and<br />
discusses the potentials of using this approach as a starting point in<br />
developing a Dutch and even a European <strong>Bird</strong> Avoidance Model (BAM).<br />
National bird strike risk map<br />
In 1998 TNLI (Toekomst Nederlandse Luchtvaart Infrastructuur, future Dutch<br />
aviation infrastructure) was studying alternative locations for the construction<br />
of a new national airport in The Netherlands. One of the important aspects in<br />
these studies is the bird strike risks. These were studied at the national scale<br />
and in more detail at the local scale of the selected potential locations. Direct<br />
information about bird strike risks was - and is - not available. At the national<br />
level this was circumvented by studying the amount of birds present at the<br />
ground. SOVON was asked to produce a map showing risks expressed as<br />
kilograms of birds per surface unit, for two periods in the year, for the whole of<br />
The Netherlands.<br />
SOVON, Dutch Center for Ornithology, is a Dutch NGO that performs<br />
ornithological research to further the conservation of birds and their<br />
environment and to further science. For 25 years it has been organizing<br />
fieldwork projects for volunteers, both atlas and monitoring projects. The<br />
network of volunteers counts thousands of enthusiastic participants. Results<br />
are published in for example atlases of breeding birds distribution (Teixeira<br />
1979, and SOVON in prep.) and bird distribution for every month of the year<br />
(SOVON 1987). The latter atlas gives the distribution for all bird species<br />
occurring in The Netherlands on a monthly basis and gives estimates for<br />
numbers of many of them. Thus it is a good starting point for making a map of<br />
birds strike risks. Many monitoring projects are in operation that provide actual<br />
information about distribution and numbers of birds.<br />
SOVON is a leading partner in this field on the European scale, playing an<br />
important role in the European <strong>Bird</strong> Census Council (EBCC). This<br />
organisation has published an atlas of European breeding birds (Hagemeijer<br />
& Blair 1997). EBCC has a network of tens of thousands of volunteers<br />
throughout Europe.<br />
In its request for a national bird strike risk map, TNLI put forward the following<br />
prerequisites. The maps should have a nationwide coverage, with a minimum
IBSC25/WP-AV10 141<br />
resolution of 5x5 km and should be produced within a very short period. This<br />
latter demand puts a constraint on the corrections and modelling effort that<br />
could go into the product.<br />
The presentation of results should be on a half-year basis (summer and<br />
winter), showing summed (for all species involved) risks in the sense of “birddays”<br />
and “bird-kilos”.<br />
The problems and gaps in knowledge that were encountered during the<br />
production of the maps should be reported.<br />
Data sources<br />
SOVON used its “year round Atlas” (Atlas van de Nederlandse Vogels,<br />
SOVON 1987) as the basis to its approach to produce the maps. The<br />
database of this atlasproject contains monthly distribution data for all species<br />
occurring in The Netherlands. The area of coverage is the whole of The<br />
Netherlands, excluding the continental shelf. Its resolution is 5x5 km.<br />
Including IJsselmeer and Waddenzee the country counts 1767 squares.<br />
The fieldwork for this atlas was done in 1978 through 1983. The database<br />
contains many estimates of numbers of birds per square. The coverage of<br />
squares is very good. 99% of square/month combinations was visited over the<br />
five year fieldwork period. For more details, see SOVON (1987).<br />
The fieldwork period is quite some time ago, but this was the only database<br />
currently available on this time- and geographic scale. Although time was very<br />
limited an attempt was made to use information from operational monitoring<br />
projects to update the information in the atlas database.<br />
Updating distribution information was only possible for colony breeding birds<br />
(April-June). Numbers could be updated for more species, using new national<br />
population estimates (e.g. waterbirds) or trend information for breeding birds<br />
or terrestrial wintering birds.<br />
Species selection<br />
Not all bird species have the same relevance to bird strike hazard. Criteria<br />
were set to select a subset of species that would be used to produce maps of<br />
bird strike risk. The criteria were mainly based on the tendency to aggregate<br />
and on the weight of the species, as the combination of these factors largely<br />
determines the potential risk a species can cause. The Royal Netherlands Air<br />
Force, operating the Dutch bird strike database, endorsed the selection, that<br />
includes 57 species. These species are listed in table 1.
142<br />
Hagemeijer, Buurma & Verbeek<br />
Table 1: species selected to be included in the maps showing bird strike risks<br />
in The Netherlands.<br />
Phalacrocorax carbo<br />
Ardea cinerea<br />
Ardea purpurea<br />
Platalea leucorodia<br />
Cygnus olor<br />
Cygnus columbianus<br />
Cygnus cygnus<br />
Anser fabalis<br />
Anser brachyrynchus<br />
Anser albifrons<br />
Anser anser<br />
Branta leucopsis<br />
Branta bernicla<br />
Tadorna tadorna<br />
Anas penelope<br />
Anas crecca<br />
Anas platyrynchos<br />
Aythya ferina<br />
Aythya fuligula<br />
Aythya marila<br />
Somateria mollissima<br />
Melanitta nigra<br />
Bucephala clangula<br />
Mergellus albellus<br />
Mergus serrator<br />
Mergus merganser<br />
Fulica atra<br />
Haematopus ostralegus<br />
Recurvirostra avosetta<br />
Pluvialis apricaria<br />
Pluvialis squatarola<br />
Vanellus vanellus<br />
Calidris canutus<br />
Calidris alpina<br />
Limosa limosa<br />
Limosa lapponica<br />
Numenius phaeopus<br />
Numenius arquata<br />
Tringa totanus<br />
Larus ridibundus<br />
Larus melanocephalus<br />
Larus canus<br />
Larus fuscus<br />
Larus argentatus<br />
Larus marinus<br />
Sterna sandviscensis<br />
Sterna hirundo<br />
Sterna paradisaea<br />
Chlidonias niger<br />
Columba palumbus<br />
Columba oenas<br />
Riparia riparia<br />
Hirundo rustica<br />
Corvus monedula<br />
Corvus frugilegus<br />
Corvus corone<br />
Sturnus vulgaris<br />
Methods<br />
The atlas database that was used contains records for species-square-yearmonth<br />
combinations. Several steps were taken to prepare the data:<br />
1. First of all, the species selection was reduced to the list given in table 1.<br />
2. Estimates of numbers in the database are either “exact” (which were<br />
used as such, including zero), in classes or missing. Class-estimates<br />
were converted into “work-values”, using the geometric mean of the<br />
class. Missing values (qualitative records: birds present, but no estimate)<br />
were dealt with in later steps.
IBSC25/WP-AV10 143<br />
3. In the next step, 5 years of monthly data were integrated into one value<br />
per month. This was done by taking the average of the two highest<br />
values.<br />
4. Next, the distribution data for colony breeding birds was updated by<br />
substituting the April, May and June data for these species by the recent<br />
information of the operational monitoring project for colony breeding<br />
birds.<br />
5. Although the coverage of the atlas project was in general very good, not<br />
all the records contained quantitative information (only qualitative:<br />
species present). In the next step the gaps in this information were filled.<br />
This was done using a combination of imputing and interpolation. If<br />
quantitative data of a certain square were lacking for a number of<br />
months, the pattern of numerical change for that same species in all the<br />
other squares was used to predict the numbers in the missing month(s)<br />
(imputing). Imputing was performed using TRIM 1.0 (Pannekoek & van<br />
Strien 1996). If this was not possible because there was no month with<br />
data at all (or only zeroes) for that square, interpolation was used to fill<br />
the gap: Values from the surrounding (8) squares were used to calculate<br />
a value to substitute the missing observation. For details see Hagemeijer<br />
et al. 1998.<br />
6. In all cases interpolation was performed to compare the values found by<br />
imputing with those derived through interpolation. If the difference was<br />
larger than a factor of 10, the average of the imputed value and the 8<br />
surrounding squares was taken (de facto this is weighting the imputed<br />
values down to 1/9th). Thus, the imputed values were “smoothed”.<br />
7. Also the interpolated values were “smoothed”, by comparing with<br />
surrounding months. For details see Hagemeijer et al. 1998.<br />
8. The counted and imputed/interpolated values per square per species per<br />
month were summed for the period October - March and April -<br />
September, yielding half-yearly totals (individuals) per species.<br />
9. Where possible quantitative information was updated using trend<br />
information from operational monitoring projects run by SOVON. Trendwise<br />
changes of more than 50% were searched for in the following<br />
projects:<br />
• Monitoring of Geese and Swans (Koffijberg et al. 1997a)<br />
• Common Breeding <strong>Bird</strong> Monitoring project (BMP) (Van Dijk et al.<br />
1997a)<br />
• National Breeding Species Monitoring (LSB) (Van Dijk et al. 1997b),<br />
for Avocet (Recurvirostra. avosetta) and Rook (Corvus frugilegus)<br />
• Midwinter counts for waterbirds (Van Turnhout & Verstrael 1998)<br />
• Midwinter counts for terrestrial birds (PTT) (Van Turnhout et al.<br />
1997).<br />
10. Assessed trends were applied as a multiplying factor to all half-yearly<br />
totals.
144<br />
Hagemeijer, Buurma & Verbeek<br />
(a)<br />
(b)<br />
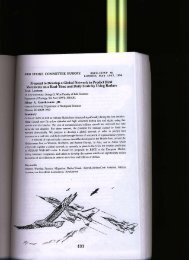
Fig. 1. Integration of information as shown by the example of the Cormorant<br />
Phalacrocorax carbo: 6 monthly maps (a) in the Atlas of Dutch <strong>Bird</strong>s (Atlas<br />
van de Nederlandse Vogels, SOVON 1987), yield one map (b) in the TNLI<br />
project.
IBSC25/WP-AV10 145<br />
11. Finally the number of bird-days was calculated by multiplying the halfyearly<br />
totals with the average number of days, for which the value of 30<br />
was used. The resulting values were used to plot maps per species.<br />
12. By summing up the bird-days for all species per square, the two “total<br />
bird-day maps” were generated.<br />
13. By multiplying the number of bird-days per species for every square with<br />
the average weight for that species, and subsequently summing the<br />
values for all species, the “total bird-kilo” maps were yielded.<br />
Figure 1 graphically shows how the information from the atlas was<br />
summarized into a map for TNLI.<br />
Results<br />
The resulting maps are shown in fig 2 and 3. They show, for the two periods -<br />
summer and winter - numbers of bird-days and number of bird-kilo per square<br />
for the selection of 57 species. The maps clearly show concentrations of birds<br />
in certain regions and the results generally match between the bird-day and<br />
the bird-kilo maps.<br />
Winter shows higher risks than the summer period. Over two million bird-days<br />
per 5x5 km square (80000 per square km) are not uncommon. Especially in<br />
winter, many square score over one million kilos (over 40000 per square km).<br />
As expected heavy birds put an emphasis on some areas: Cormorants<br />
Phalacrocorax carbo highlight the IJsselmeerpolders in summer and geese<br />
put highlight the western part of the country. They do not indicate new areas<br />
but give areas a higher score.
146<br />
Hagemeijer, Buurma & Verbeek<br />
(<br />
(a)<br />
(b)<br />
Figure 2: Maps showing number of bird-days per square for a selection of 57<br />
species, for two periods of the year: (a) Summer (April-September) and (b)<br />
Winter (October-March)<br />
(a)<br />
(b)<br />
Figure 3: Maps showing the number of bird-kilo per 5x5 km square for a<br />
selection of 57 species, for two periods of the year:(a) Summer (April-<br />
September) and (b) Winter (October-March)
IBSC25/WP-AV10 147<br />
<strong>Bird</strong> Avoidance Models<br />
‘<strong>Bird</strong> Avoidance Model’ is used here to describe a model that is used to plan<br />
and schedule aviation in time and geographic scope, taking bird data into<br />
account. Its objectives are twofold:<br />
1. Safety aspect: reduce the number of bird strikes<br />
2. Conservation/Legal aspect: reduce the negative impact of aviation on<br />
birds.<br />
For the Dutch situation the interaction between many people, many flights and<br />
many birds can be schematically represented as in figure 4. The interaction of<br />
plane movement and high bird numbers cause bird strikes and disturbance or<br />
other conservation issues. A BAM can play a central role in trying to reduce<br />
both problems.<br />
Lots of People<br />
Disturbance<br />
(legal)<br />
<strong>Bird</strong> <strong>Strike</strong>s<br />
(safety)<br />
Lots of <strong>Bird</strong><br />
Data<br />
BAM<br />
Lots of Plane<br />
Movements<br />
Lots of <strong>Bird</strong>s<br />
Figure 4: Role of BAM in reducing safety and legal problems in relation to<br />
aviation<br />
Evaluation of the method used for TNLI, for use in a <strong>Bird</strong><br />
Avoidance Model<br />
The method used to produce the national bird strike risk maps can be<br />
characterized as a ‘data rich’ method. In the United States a <strong>Bird</strong> Avoidance<br />
Model is in operation but it runs in a ‘data sparse’ environment. In contrast, in
148<br />
Hagemeijer, Buurma & Verbeek<br />
The Netherlands a lot of data is available but the model to produce risk<br />
predictions from these data is lacking at the moment.<br />
Generally speaking the method described above performs well, but the<br />
following remarks should be made.<br />
1. Other sources of relevant information are available that would make the<br />
maps more accurate. Time was lacking in the TNLI project to disclose all<br />
this information. In a project towards a BAM this information should - and<br />
will - be used. The main obstacle was the geographic linkage of<br />
information to the grid scale used for the TNLI maps. Georeferencing is<br />
now being improved to allow the linkage of all information in the future.<br />
2. <strong>Bird</strong> Avoidance Models need a good resolution both in time and space.<br />
Transformation of monthly data into ‘half-year-values’ is therefore not<br />
desirable.<br />
3. The species selection used makes the approach solely suitable for<br />
assessing bird strike risks. <strong>Bird</strong> Avoidance Models can serve a second<br />
goal, in minimizing the impact of aviation on birds and sites.<br />
4. The information used is confined to two dimensions: bird distribution on<br />
the ground. The third dimension – bird altitude distribution – is very<br />
important in assessing real risks and will need to be added. Currently,<br />
accurate information about this aspect is sparsely available.<br />
Towards a BAM for The Netherlands and Europe<br />
Recognizing the importance of the steps that have already been taken and<br />
the potential of the existing data, combined with the potential to improve<br />
existing datasets and create new ones, and recognizing the potential of GIS to<br />
integrate data and the need to increase our knowledge of birds in both 2D and<br />
the third dimension, the Royal Netherlands Airforce has asked SOVON and<br />
the University of Amsterdam to jointly form a BAM team and to start working<br />
on a feasibility study for a BAM for The Netherlands and on a European scale.<br />
Three phases can be distinguished in the development of a BAM:<br />
1. Data phase: data optimization<br />
2. Knowledge phase: gathers knowledge needed to interpret data in the<br />
model, especially for the step from 2D to 3D.<br />
3. Integration phase: integrates data and knowledge to produce a prediction<br />
of risks.<br />
In a project towards a BAM for The Netherlands the following steps have been<br />
planned for the data phase, to be performed by SOVON on its programmes<br />
and databases:<br />
• Disclose existing databases by georeferencing<br />
• Integrate existing databases<br />
• Identify concentrations of birds within counting sites<br />
• Set up a database of roosts
IBSC25/WP-AV10 149<br />
• Enhance migration monitoring<br />
• Map the winter distribution of terrestrial birds using monitoring data<br />
• Allow observers to report concentrations of birds outside of counting sites<br />
or counting periods.<br />
In the knowledge phase the following research has been identified as<br />
important:<br />
Study flight behaviour at roosts, during foraging, during migration and around<br />
colonies. Specific avoidance behaviour is of importance as well as knowledge<br />
about the use of sites<br />
This can be approached by either studying the processes independent of the<br />
species or by studying a relevant species in more detail, unravelling many<br />
aspects of its behaviour. Examples of relevant species include Anser albifrons<br />
or Larus ridibundus.<br />
For the Integration phase it is planned to build a GIS model, develop decision<br />
rules, develop the interface and to involve end-users in the whole process.<br />
The Netherlands as a testing arena for Europe<br />
The data situation in The Netherlands is such that it allows to do pilot studies<br />
to test approaches that can be applied at the European level. Of course these<br />
approaches will build on the experiences from the United States where a BAM<br />
is currently in operation. Especially the data situation is different in Europe<br />
however. Comparable to the Dutch situation a large observer network of tens<br />
of thousands of people exists and although less developed than in The<br />
Netherlands, monitoring and atlas projects are running or under construction<br />
in many places in Europe, under the lead of the European <strong>Bird</strong> Census<br />
Council (EBCC). EBCC has built a comprehensive database of the distribution<br />
of breeding birds in Europe, published in the EBCC Atlas or European<br />
Breeding <strong>Bird</strong>s (Hagemeijer & Blair 1997). Organisations like Wetlands<br />
<strong>International</strong> and <strong>Bird</strong>Life <strong>International</strong> run European databases with crucial<br />
information about important sites for birds and nature in general.<br />
Figures 5 and 6 show the status of atlasing and monitoring in Europe and<br />
figure 7 indicates the coverage of the EBCC data.<br />
Clearly, a Europe-wide project is needed to integrate all this information.<br />
Experiences gained in developing the Dutch BAM can be instrumental in<br />
starting the work on a European BAM.
150<br />
Hagemeijer, Buurma & Verbeek<br />
Figure 5: monitoring schemes in Europe, situation 1999 (Hagemeijer & Bibby<br />
2000)<br />
Figure 6: <strong>Bird</strong> atlases in Europe, situation 1999 (Hagemeijer & Bibby 2000)
IBSC25/WP-AV10 151<br />
Figure 7: Data coverage of the EBCC Atlas of European Breeding <strong>Bird</strong>s (Hagemeijer<br />
& Blair 1997) . Black dots show 50x50 km squares with full coverage, open dots show<br />
partial coverage and little point indicate no coverage.<br />
References<br />
van Dijk A.J., Hustings F., Sierdsema H. & Verstrael T. 1997a. Broedvogel<br />
Monitoring Project jaarverslag 1994-95. Monitoringrapport 1997/03.<br />
SOVON, Beek-Ubbergen.<br />
van Dijk A.J., Hustings F., Sierdsema H. & Meijer R. 1997b. Kolonievogels en<br />
zeldzame broedvogels in Nederland in 1995. Monitoringrapport 1997/06.<br />
SOVON, Beek-Ubbergen.
152<br />
Hagemeijer, Buurma & Verbeek<br />
Hagemeijer E.J.M. & Blair M.J. (eds). 1997. The EBCC atlas of European<br />
breeding birds: Their distribution and abundance. Poyser, London.<br />
Hagemeijer E.J.M., van Turnhout C., van Winden E., Zoetebier D. & van<br />
Roomen M. 1998. Vogelaantallen en vogelmassa in Nederland: 2D<br />
kaarten van vogeldagen en vogelkilodagen voor heel Nederland op<br />
atlasblokniveau (5x5Km) (voor het vaststellen van aanvaringsrisico’s met<br />
luchtvaartuigen). SOVON-onderzoeksrapport 98/05, SOVON<br />
Vogelonderzoek Nederland, Beek-Ubbergen.<br />
Koffijberg K., Voslamber B. & van Winden E. 1997. Ganzen en zwanen in<br />
Nederland: overzicht van pleisterplaatsen in de periode 1985-94. SOVON<br />
Vogelonderzoek Nederland, Beek-Ubbergen.<br />
Pannekoek J. & van Strien A.J. 1996. TRIM, Centraal Bureau voor de<br />
Statistiek, Voorburg/Heerlen.<br />
SOVON. 1987. Atlas van de Nederlandse vogels. SOVON, Arnhem.<br />
Teixeira R.M. (red.) 1979. Atlas van de Nederlandse broedvogels.<br />
Natuurmonumenten, ’s-Graveland.<br />
Van Turnhout C., Hustings F., Sierdseman H. & Verstrael T. 1997. Punt<br />
Transect Tellingen van wintervogels in seizoen 1994/95 in Nederland.<br />
SOVON-monitoringrapport 1997/01. SOVON, Beek-Ubbergen.<br />
Van Turnhout C. & Verstrael T. 1998. 15 jaar Punt-Transect-Tellingen van<br />
wintervogels in Nederland. Resultaten van de PTT-evaluatie.<br />
Achtergronddocument. SOVON-onderzoeksrapport 1998/02. SOVON<br />
Vogelonderzoek Nederland/Centraal Bureau voor de Statistiek. Beek-<br />
Ubbergen/Voorburg.