Using Geographic I - International Bird Strike Committee
Using Geographic I - International Bird Strike Committee
Using Geographic I - International Bird Strike Committee
- No tags were found...

You also want an ePaper? Increase the reach of your titles
YUMPU automatically turns print PDFs into web optimized ePapers that Google loves.
AIRO STRIKE COMMITTEE EUROPEBSCE23/WP52London, 13-t7 [lay '1996USING GEOGRAPHIC INFORMATION SYSTEMS TO MODEL BIRDoisrRtauI|oNs ANo PoPULATIoNS oN a coNTINENTAL scALERussell P. OeFoscoMajor, United States Air ForceDepartment of Biologytlnites Siates Ai; Force Academv, Cotorado a0a4oUSASUMMARYThe obiectives of this study were to use phvsiograPhic' gcograPh'c'and cimauc correlatcs to describc the b'eeding and winteringJi"t ,o"ti.. -o abundance Patterns 'n rurkev vntturcs lcaua'tesaura) in the conunental united State3 and model the hazards Posed ro"1."-tin t" ut*. b'rds. I hirtv vears of data were cor'elated wilh.iili"i" i."*o ".a g.ouna sampted environment2r data in a rasteru.".0,i."o'"prti"ihr;.maton svslem (GlS) rnvironmental faclo6cvaluat;d_in;lude clevauon hvdrostaphv, thqmal tcJ]eclarcetemDeratu.e. precipitation,number of "ost-iree days';,;'fifii. i;;. :;;-""1'.si"... r", "".1' 1 Km2 brock or the."it*"Lr ir"itJa shtcs. ; Gls overrav Pr@ess was used todetermine stalisucal relationships between environme'tal lacro6 ano".-ri"J r"rt"- 0"t". vutto.e numbers were mGt st'onslv corelatedwith oeoDhvsical facto6 throushout lhci"ange and between seasons'iii""Zi-i irit"'". were mosl srronsrv Positiverv correratcd with;;i.;;.."r" and more opcn phvsiosraphic habitats winteri's""rt"t"". n.." mo.e sttonglv correlated with lorested areas'"' ".r-"tru r". ut".-.r .@su;g cover' These techniques have helpedilri* o.t"'.i.. r'.r..v vultur; habitat rcquitcments on a scalc neveri"'" .ttf-pt.o, and-can bc used lor other sPecies in lhe futu'6;;;;d ;;;;rq;.. can be used to idenurv sPec'nc a'eas whe'ebi.ds pose potential haza.ds lo avraxot'\ey Words: <strong>Bird</strong> Populations Rsdar' riigration Avo'dance Local{ovements Electronic463
IlUSING GEOGRAPHIC INFORMATION SYSTEMS TO MODEL BIRDDISTRIAUTIONS AND POPULATIONS ON A CONTINENTAL SCALEINTRODUCTION:1- U.S. AIR FORCE INTEREST IN BIRD DISTRIAUT|ONS:Iniuauon or lhis projcct was prompred by a Uhited Slates Air rorce(USAr) need to avoid bird cottisions with its aircrafr Each of the Usmilitary services suffers from these probtems and every aircran qpef.om helicopters to fightec ar€ vutnerabte to bird strakes. MitiGdaircrafl are particutarty vutnejabte ro i,,rC stikes, as they rcuunetioperate at low altitudes and hish speeds. The USAF,epo.ts aroun;3,200 bird st ikes each year (Merratt and Dogan -1992). Theseincidents have calsed the toss of numerous iet aircEf! hany withresuttant tataliues, and have cost the Ai. Force an av€rage or o;er 65mixion dollars pe. year (DeFusco and Tume. .i9A6, Thompson et at.1946, DeFrrsco 1984, OeFusco et at. 19a9, Merritt i990. iterritt andDogan 1992). Othe. services report simitar bird srrike ,ates. <strong>Bird</strong>strikes @cur during att phases of fligh! but are most tikety to resutt incatasrrophic accidents during to$rtevet missaons and on t ainingE.ges. Aircrafi frequenuy opeEre in remore t@aUons at aturude;f.om 10O to 3OO mete6 above ground tevet. and from 3SO to 600 knotsindicatcd ai6peed. Unlike in the airfietd ehvironment whcre birds mavbe dispeEed. there is no way to coht ot bi.ds in the tow{evjenvironmenl Aircrews are d;pendent upon irformalion on btrddistributions to avoid potentiafly hazardous areas. Th€ USAF isupgrading its computerized <strong>Bird</strong> Avoidance Modet (BAM) to providelhis infomation to all Department of Defense agencies. Th; rnodelmust provide l@alized data on bird dist ibuuons and abundan@lhroushout the conunental United Stares (CONUS). Thas study wasoes€nedi In partr to provide informaton about vuttures for inctusion inthe upgraded ai.d Avoidance Modet.The variety of birds struck by aircraft numbers in the hundreds. butseveral orders of birds pce the most se.ious haz€.ds. Notabte amonolhese are the .aplor (Fatconifomes). In the United States, lh;specres causing the single g.eatest haz.d is the Turkey Vuttxr€(cathartes au.4. This is due to a number offactG inctudin; irs hrgebody mass (over 2 kitograms), widespread dist ibution, "na night464
ffiHtrJ$iffii#ffi*r*rlrffisr;*;tt's#ffiffiffi-dHtr##''it#$if##}!2. AIOGEOGRAPHY-PATTERNS:F-ff#;q#gfl r{f*#*$li:-tr*-*;SPEC|Es DISTRIBUTION AIIO ABUNDANCE4!J
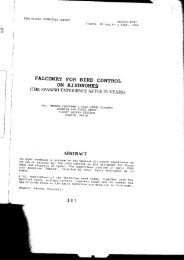
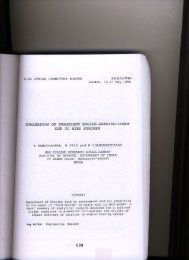
(butsee castro 1969). such traditionat approaches focus on rh€ r^,odimensionalEnges of speci€s ar|d olten ignore lh€ criticat thirddimension of species abundance pattems within rheir ranges (Udvardy1969, Bock and R@t 19Alb, Brown and Gibson 19a3). This thirddimension nEy revoal much morc ot what is impo.tant to a poputationof organisms than lhe limits imposed at t||e extremes ofth€ir range.Analysis of regional abundance pattems on a continehtat scatsrequir8 an enomds amount of data befdo coherent pattems ar.revealed. Fortunately, such databases exist. in the forin of the NationalAudubon s@iety's Christmas <strong>Bird</strong> count (CBc) and the NauonalBiological survey's areedins <strong>Bird</strong> survey (aBs), each of whichpotenually can be used to .tesc.ibe bir.t species abundance pattemsac|cs Norlh America. This stody corretat€d thes extensiv€databases with physiographic, climauc, and geographic variabtes, inTart€mpt to describe and interpret the breeding and winterihgdistrit ulion and abundance pattFms ot Turkey Vuttures ir. $;conunental United States-2.1. The Ch.istmas <strong>Bird</strong> Cornt:Ch.lstrnas <strong>Bird</strong> Counts are conducted over a 2+hour period during th€two weeks so.rounding Chdstmas day each year. Many thousands ofvolunte€rs participate in these annual counts and several mi aon hou6of observauon have beeh .ecorded since counts began in 19oo Gockand Root lgalb, R@t 1988a). Observers record the oenter point ofeach eslablished count circle by degreas ahd minutes of tatitlde andlongitude. Participants a.e allowed to conduct surv€ys anywherewithin a 12.1 kilomeler .adios of the cente. point parties ofindividuals rtray split up to simuttaneousty cover different parts of th€count circle during the sudey period. Th€ totat number of parb' hou6ar€ recorded in addition to the total number of each sD€ci€s obseryedduring lh€ survey. CBc resutts a.€ reported in this srldy as thenumber of birds observed per party hou., per count circte, per y€ar, tosrandardize r€sutts ot counts with difiering etrort tevets. Root (1988a)includes a more detailed desc.ipuon of CaC methodotogy and itshistory in the introducuon to her book. Data are compited by state andentered irto a nationat database maintained by rhe Nationat AiobgicalSurvey in Laurel, Marytand- Computerized data ar€ avaitabte fq eachyea. from 1960 to presenl Att avaitabte data for each year through1992 were us€d for tnis strdy. Figure .t depicts the 2,026 CBC siteswhere at l€ast one survey was conducted between 1960 and 1992.Turkey Vultures have been recorded at teast once at 539 (26-6%) oflhese sites. Data ranse f.om a minimum vatue of 0.0 to a maximum or3-57 vulturos p€r parv hour, per cBC circte, per year. For tho{66
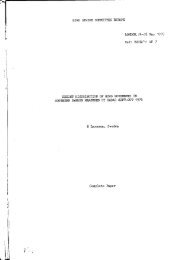
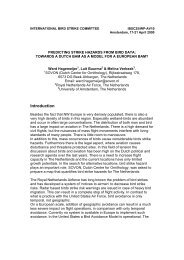
oumos€s of this sUrdy, it was assumed thal vultures wer€ randomlviiititut c -iu,in "ny given cdnt ci.cle and thal obseders randomlvor uniformly surveyed lhe area contained therein.2.2. Th€ Bre€ding <strong>Bird</strong> surv€Y:The Br€edinq gird Suwev is a standardiz€d surt'€y conducted 6achveat ot various locauons lhroushout the United Staie8 du'ing th€sorino and eadv sumn€r. The BBS wae initiated in 1965 to devsloP areliabfo index ot ltorur lmerican bird poPulauons (BvstEk 1941)'Surv€vs ar€ conducted dds €stablished rout€s on Becondary roadsin lar;olv rurat areas. The starting Point of each roule is recorded indeore-es ana minutes or latitode and longitude. The di'ection ot therou-tes f.om the startins poinG are randomly selected, but rePeatedeach vea.. Fiftv. thre; ninute stops arc made at 0'79 kilometeri"t *ir" "r".s .l.r' ss.4 kilom6ter rout€. Tolal numbers of each birdspecies seerior heard durins stoPs are recotded tor ln€ rode'n'ootins anU van vetzen (1964 includs a dctailed d€sc'ipuon ot BBSmethodoloqv. Data are compiled by state and entered intothe nalionaldatabase ;aintained by the Nalional giologicsl Surv€v in Laurel'MaNland. Su.vev resulG have be€n recotdsd each vear lrom 1966 rooreienr. and all avaitable data trom each vear rhroush 1992 w€r€included in thie study. Figure 2 dePicts th€ 2,167 BBS sites wher€ atleast one surv€v ha; bsen conducted during the inclusi@ period fo'data analyzed in this study Turk€v Vultutes have b€€n recordsd atleast onc; at 1.s89 (73.3"/") of tfies€ sites. Data range from a minimumvalue of O.O lo a maximum of49.11vultures p€r route' Per year'3. SUITAAILITY OF CBC AND SBS OATA:Much has b€€n written about the us€ of Chtistmas Sird Counts andAreedina <strong>Bird</strong> Survevs to d€temin€ trends in PoPulatid andoeorao-tric aUunOance pattems ol va.ious bird sPecies (se€ Robbinsina-V"i" V.r*" rSeZ, iram". 1974, Bock and LoPthi€n 1975a'b'c'rSZo; l-opthien ano Bock 1976' Bock 1980' 1942; Arbib lgal' Bockana noot'rgera,l; aysrrak 1981, Drcnnan 19Al' Faan€s and Bvsttatigsr- ceisst"' ""ti r'ti* 1981, Robbins et al. tsa6, Root 19aaa. Patteeand lifilbur 1989. autcher et al. 1990). Th€t€ ars Potcntial problemswirh such 3urv;y techniques. The cBC in particular is loos€lvmanizea ana noi stanoardized in its rormal oar' mav not b€ r€liablet"i""...r..i"" *.tt "6 rariue6 and hishlv gr'sarious ep€cies (RootISSSa). Tits BBs was organized in a standard fomat to ove'com€;;;;k ures€ potentiat ;ror eru (Robbins and van ver26n 1e67'Bvstrak l9a1). Even so, uncomfton and sectetivs species mav berio"*"".t"i in some iurvevs, Parl,cularlv with the BBs' Rar€46?
1a/,oj,CNct(JttEIv)(ttvt(J408
U'6)c/,o)u)EEo)6)EI{09
species may actuatty be overcounted in the CBC as compeuuon oftenb:tw_em parricipants:I::sro reco.d rhe mcl species in a courcrrcre. anoher criucism ot the CBC is that il may @cu. t@ earty inthe season, when some bi.ds are sutr misrau;s (Bock and ioot1.941b). Despite such probtehs, most ,esearche.s cdctude tiatmese suNeys,-as they are tong.term and targe_scate, ar€ usefut tormonroflng both trends in poputauons and distributions of host::lT:l :.p":.:"^Il""l,andLepthien 1s7sa, Bock and R@r reala,bTcnq et at. 1990. O'Conno. 1991). Concems about retiabitity ofoata ro. c_ommon species are hiugatod to . targe edent by rhe sheervolume of available dat.Tur&ey Vuttur€s are ideat for these type sud€ys as trlev are retativ€tvconspicuous,llTTiltl'snryeasity idenunabte, wid;ry dist ibured-,and rnqerore provide .obust data sers. Anatysis of p.€vious suReysarso .eveat thal Torkey Vlttore poputauons are retativety srabte,rru^ewiihapparent charges in dist iburion (Brown i976, n;hbins et ati9a9).Variabitity in individuat surveyspopuauondue tonuctuauons, obseruer bias. and weathe. conjiuons isrumer mftgared by averaging data over a period of many years and,rhe cBc, byl:.i: :":"."jsrandardizins the data uy pi.ry r,",.!(bysnak and [,rennan 1975, Raynor.1975, ptaza 1gza. rirkrsz-9, g"ckahd R6f 1galb, Drennan 1981;Butcher;r at. 1990). The siz€;rheseoaG sers r€duces many or|he concems about non_standard statisticalassumprions needed to anatyze them (Drennan 19Bl).METHODS:1. GENERAL APPROACH:This. study was designed to detennine if staust cat retationshipsexFled belw@n Tm&ey_Vutture dist ibuuon and abundance pattemsano vanous environmentat tactoE- tt was necessa.ity assumed thatareIlj*" .u:1,:1".timited, as are a[ species, by a combinationer(ernarolb.orc and abiotic environmentat factors which have ted tooer pres€nr_day distribution patterns. Arays of such factoE wererc]sEd Ind'vrdualy and colectjvety in this srudy. surfaces depictingwrnter and summer abundances oI Tukey Vulures _.r"using.i""t"iChrist nas And Count and Breeding -and Sr*.y a"t . n"."Infdmatiolsmg. ,Geosraphac.sysrem overtay p.@edurcs.then generated between the tayeE to d€termin€wnrcn va.rabres best predicred Turkey Vutture abundance patterns.470
2. CBC AND BBS DATA FORMATAND TRANSFORMATIONS:2.1. The Ch'istmas ai.d count:Christmas <strong>Bird</strong> Count data we.e provided by the National BiologicalSurvcy in digital format, These files wcrc converted to AmericanStandard Code for Information l.terchange (Ascll) fomat andreduced to represent the c@rdinatcs of each circle wiihcorresponding mean numbers ot birds obscrved per Party hour, percount circle, pe. year, These datt we.e then entered into theGeosraphic Resource Analysis Support system (GRASS) GcogEphictnrormatioh system (GlS) by Kcnnerh shepa.dson of spectrumSciences and soriware. Inc.. under contracl with the USAF andsubcont acted by the Unive6ity ot Colocdo. GRASS is a publicdomain GIS soflware packagc originally developed by the U.S, Armyfor storage and analysis ol data on tand resources. The pacftage isveFaute in ils ability io handle both raster and veclor-based datamodels. Rasterdata models consist of numbcred.ows and columns oluhitorm cclls, or picture clcments (pixels), each coded wilh ahindividuat value. Vector dala models are points. lines, o. areaboundaries codcd by coordinates of criucat points that define an entity(see Peuquet and Marble 1990, Starr and Estes 1990, Maguire et al.'1991,Laurini and Thompson 1992).<strong>Geographic</strong> c@rdinatcs of cBC count circlcs were converted into aLambert Atmuthal Equal Area pmjecuon fot conformity and sPaual.esistration with data sets to be further described below afteroverlayins cBc point data on lhe Gls prcjecuon, a surface wasseneratedto interpolate values between known points (see Lam 1943).A s.id of known ahd interpolated values was created with ao inveBedistance weighted intcrpolation algorithm using the 12 nearest pointsand a squared dccayfunction. The alsorithm is expressed as:ti=i 1/diwWhere:Z = the valuc ofthe unknown pointn =ihe number ofsample points used for interpolataonz= the value allhe sampled pointd = the distance between the sample Point and Zw = the weishuns factort1r
The r€sultant srid was convert€d into a mster fomat with each pix€lsiven an individual value. Thase data wer€ thsn impo.ted intoARcINFO (Environhental Systems Research Insutute. Inc., RedtandsCA) for gmphic display by James Zack of the cls, Remote Sensing,and Cartography Lab at tfte University of Colorado.2.2. The 8r€eding <strong>Bird</strong> Surv€y:8re€ding <strong>Bird</strong> survey data w€re provided by th6 Natjonal AiolosicalSurvey in digital formal Th€se liles were converted to ASCII formatand r€duc€d to give the coordinates with the con€sponding meannumber of birds obseded per rout€, p€r y€ar. Th€s€ data were thentransfo.med into a Lamb€rt Azimuthal Equal Area proiecuoncoordinate system by th€ same procedur€s described abov€ fof theCBC, and a surface created usihg th6 above inveEe distancoweighted interpolation algorilhm.2,3. CBC and ABS A.eas Used for Corr€lational Analysis:The GRASS program was used to geherate a buffer with a l2.lkilometer radius ardnd the cent al c(trdinates of each CBC @untcircle. This bufier co..€spond€d to lhe radius of the o.iginal countcircles. The inclusive a.ea within each circl€ was ,141 soua.okilomet€rs, represented by 441 pixels of I squar€ kilomerer each, intne raster data *t as defined above. For purposes of contormity, andto limit rhe extensiv€ area pot€nually cov€r€d by a 39.4 kiloneter BBSrode, th€ sam€ 12.1 kilometer bufier was used sunoundins thesbning coordinates of €ach Bas rout€. A program to s€parate th€individual survey site6 within each clultrp of tu o or more overlappingcircl* was w.itten and each arca given a unique designatoa fdfo.ther analysis. As it was impossible to disunguish €trects of comhonor exclusiv€ ar€as in overlapping circl€s, the con€lational analyses tobe described below treated each area as a separat€ enuty.3. ENVIRONMENTAL OATA FORMATAND TRANSFORiIATIONS:Each of th€ fouowihg climatic, geogEphic, and physiographic f.ctorgw€re tested for statisucal correlalion wilh tne CAC and AAS data3.1. Temperature:Point data on t€mDemture wer€ obtained trom th€ Global Historicalclinatology Network (GHCN) through th€ coop€rauv€ Instftrn€ fo.Res€arch in Envirot'mental Sciences (CIRES) at the univeGity of172
cotorEdo. Those data wer€ oblained from msteorological monitoringsrarions throughout the U.s. and th€ wottd (se€ Eischeid €t al' 1991.'V6e ct al. 1992). Data trom 1,52a t€mPeialurs 6laro'E were rssa'The orisinal da6 s€t included rhe name of th€ stauon' latitlrde andlonoitud-o coordinates, inclusiv€ year6, monthty m6an and 6landarddeJations ror temperaturc, and sv€ral olh€r categoti€s Dara w€re""""..t"u int" lsbrr r"rmat and ilo-vear av€ras* for rhe pctlod of1961 throuqh 1990 calculated for retevant factoG' These data w€rermnsrormei to corform ro the rsmbert Azinuthal Equal Areaoroiecrion descrited auov€. An intetPotatid progEm u'as P€rfom€dL cireate a orio curface ot temP€rature data tot each lquare kilomet€rotthe conriiedar United states. The int€rpolation technique used torttris apptication was the standard inveE€ distance weightedi.t"rpo'ri"r oes".ileO "bove. Grids wer€ generated for each of th€followino ' temDerature parametersrr.-ULa" -onfttv t€mPerature for Itay for correlauon wilhBBS data2. ean monlhlv tempe.ature tor Docember for correlauonwith CBC data3. M€an annuat t€mPerature maximumforaBS and CBC data4- lrean annual tenperalut€ minimum forBBs and CBc daraThe resultant qrids w€re th€n pd in taster tonnat and sPalially.""-i.i"*Jwiu'ir'e cec and aBs dala sets overlavs ot th€ bird data"i'."J "i u,. "u"". p"raneters- were p€rrom€d with the mean value"""r'i'LJ *r$'1. .u.ir sr x-2 cBc or Bas surv€v a'6a u6€d for3.2. Frost-fr€s DaYs:Data on lrost-fr€€ days we.e obrain€d from the Natonal climat€ oatacent"r in esrcvnrc, ic. Thirtv vear mean data for the pe'iod of 1961ut-u"ft rSgO -"t a".iv€d frcm 5.s68 nditoting stalions lhroughd't$e u;ited states. The data we.e tteated in thei"-o".ur".. a"rt pt ."nted abov€. <strong>Bird</strong> data were ovedaid o' rh€trosi-tr€€ dav data with th€ mean numb€r of t'o6t-fre€ davs per ann mcontain€d within sach survev area used for analvsis'3.3. Pt€cipitation:Point data on pr€ciPitaton wero obtain€d fiom ih€ GHoN throushbirii!-.J "i ',i..- io "t"ndard data G€ts (Eischeid €t al' lesl)' oatai----rjiii p*.ipit"tlon star'-ons were used in this applicatjon'473
Formats for these data we.e the same and we.€ treat€d in the samoh€nner as the temperaUrre data set. Grids were generated for eachof the follding p.ecipitation paramet€rs:1 . l,l€an monthty precipitation for May for corretation wat rBAS data2. Mean monthty precapitation for Decenber fo, corretauonwith CBC data3. Moan annuat precipitation for co.retauon with BBS andcBC data<strong>Bird</strong> data were overtaid on each of the precipitauon tayers with themeah varue contained within the sorvey areas used for anatvsis.3.4" Snow Cover:Snow cover data were obtained from the Northern HemisphereDigitred Snowand tce Cover Data Base through the NationatOceanicand.Atmospheric Adninisrrauon (NOAA) Nauonat Snow and tce Datauente. rn.toulder cO, and tom A,114 stauons monitored by theNauonat ctimate Data Center. These dalabases provided the;xbntand depth of covemge of snow and ice on a weekty basis. Data wereaveraged fq lhe tast week of December over a p€riod of 10 years fromlgal through 1990. Conversion of c@rdinate tocauons to uie LambertAzimuthal Eqlal Arca p.ojecuon were p€rtom€d as previoustydescnbed and a surtace generated as above. <strong>Bird</strong> data from tho CB6wore overlaad on these data for corretauon with the presence anddepth of snow cover wiihin each count circte.3.5. Hydrology:Hydrology data were obtained from the USGS EROS Data Center on!16..c_9lt€rmindsu.s. Advanced very Hish Resotuuon RadiometertAvt|r(R) {.;omlanion Disc. The Digitat Line craph (DLG} hyd.otogicda(a.on_this disc were rl|e USGS 1:2.00o,0otFscate DLG v€;tor d;taorgrrz€d rrorn rh€ lIaps in the "Nauonat AUas of th€ United Slat€s ofAmerica- (19701 AI data on this disc coiformed with the LambertAzinuthal Equal Area prciecrion and thus w€r€ 6patia[y .egister€dwrtn olher data sets and coutd be overtaid direcuy on ttem. rwo nresfrom this data s€t wer€ used; a waterbody fite and a st eam tite. Thedata wer€ cooveited to raster forrnat and th€ fites morged for ttjsapplication- hformalion was provided for a per;anont andIn@rmrttent water sources and lIay have been t@ delaited for thescope or uis study. In order to timit the extensive number of ,eatlrescotained in thoe€ data sets, onty pemanenl waterconsroered tor anatysis. Vutture data from the CBC and ABS were414
M.laid on th€ pe.manent water body data set and a lin€a' distance''";;.;;;;;;;;"var€a to the ;earost wat€' Bource carcurat€d';;;i;;;;;i-il;;"- were pe.rormed to d€te'mine ir vurturepopulatoffi were related to lhe distanc€ to water'3.6. Elevation:Etevation data were 'ti;;"ti;n obtain€d from th€ EROS data center with th€ffi;lJov;;.data on tho disc were derired rrom a Disiralii;'"ii,"iinJl toir,l t-m rh€ 3o-arc aecdd dar' set disr'ibutod bv;;ilil;ft;ilv';1"ai Data center (NGoc)' r'ean etevations ror.l.ri'ti;- ir.ir ;J. .""nded to th€ nearest 20 re€t (6'45 m) s rvev=;'.'il;-;;;;;iJ ;" the erevauon data' and a B'en e':valioi;;;i; r- C";'"" contained wirhin oach circro' rhe standardJ""l.r,-" "-""g th. aal l-km blocks within each ci'cle w€re arso;;i;; ;.-;-"""ur€ or €revational heteroe€neitv .or su'facei.'"t.*.. n.av..' were Pertodn€d to detemine it thet€ 'tere"i.i.'irJii ..*Lu"* betwecn vurture poPurauons and the twofactors of absolut€ elevation and s rface tougnne$'3.7. PrimarYProductivity:A measure of Primary productivitv can be -derived f.o1T. T9r!l:;pJ;i,;-fi";;; -il,; u'scs q39-1o"1".-c.'it91lT -'-11:*1..T:i";#;ili;JE;.ii.ilo;rlryH$:"1"!19i:liLf:T-1T-Xi5l'(:f#;;; ;il;; ;o.-ai-4 ain.'"n'u "'q:glT,lTiii l1i:it#;il;i;;;;iim brock ot the cont€rrni::.l1".lllF1l5;um NDVI valu€ record€dComposites were Prodoc€d using |rle mafi -il;I;;;;;f; th" v*' te *ay"9 try 1fT:-g-*:1-:ff:,".illiliii,lrii'jil"i6 u"v siu... a"t' .rh'*.g+:::"'Ifl1lll:;T;it"ri;;iim;;ani;liskrepresented by the fotlowing formula:NDVI= (NlR- R), (NlR + R)suppried bv the uscs irDvr isNIR = N€a.Infrat€d (0.72t1 0m, AVHRR Chann€l2)R = Red lo.5a-0.6a m, AVHRR Chann€l 1,This index was used as it is dir€cuy retat€d to Photoeynrhetic activrtyli'a-ii,"- 'lJa.J.; *.ekrv Pictu;e of primarv p'oductiviV Fucke'il;T;J;:,'i;.;do. cri#an rsso, iovJnsr'end et ar' 1e8s)' rhe;;';il;"it;''.J Novr record€d ror €ach mor h was used iniiJ"ilii" ilir'Ju'"" ",mmins th€ weekrv vatu€s' or usins varu€E rromlJJ.ri?'oJll G }-rr t- Jt'ance or doud cov€r intere'ins with-.!n'l"Li.i,h'nl"v siven week' rhis Procedur€ bid€d rh€ NDvl475
values to th. highest recdded for each btock, but attows directcomparison between sites, as att values ar€ retative. Vutture surcydata w€re ovedaid @ the NDV| su.fac€s and mean NDVI vatues tdeach survey area calculated. B.€ading <strong>Bird</strong> Survey data werscompared to th€ mean maximum NDV| r€corded for the mdth .rf mavtor each su.v€y site- Christmas <strong>Bird</strong> Count data were comparcd to themean maximum NOVI rocorded for the honth of December for eachsurvey sit6. Both sudeys were compar€d to th€ sum of the maximumNDVI values for each month as an index of totat annuat productivity.3.4. TherhalReflectance:Thermal reflectance data were de.ived from 1991 AVHRR satelitespect al imag€ry as provided by the USGS EROS Data Cente.. Datafrom the same dates as the NDVI readings $/€re used to ensuro peakreadings were obtained on days with no inte.ference from ctoudcover. Bi-weekly data wer€ avairable for each 1 Km btock ofthe U-Sandwere measured in watts per m2. Peak readangs for the ,nonths ofMay and D€cehbe. were used to cr€ate surfaces tor coretauon withthe AgS and CAC data sets- Th€ mean vatu€ contained within eachsudey area was used for analyses. This facrd is not m€rety am€asure of incident .ays from the sun, but rep.esents the amdnt ofenergy reflected from the Earlh's surface. R€flected energy isdependent upd a numbe. of surface features such as soitbrpes, tandforms, vegeta[on cover, and other facto.s. Themat refioctance wasus€d as it may be an indirect heasu.€ of thermats or orographic tiftnecessary for vultures to sustain fomging and migratoiy flights andtherefor€ atfect habitat seleclion.vegetation data sets were created by the USGS EROS Data Center aspart ot ongoing research and devetopment of a tand{secharacteristics data base fd the United States (s€€ Lovetand et at.1991, B.own et al. 1993). A pretininary copy ot lhe databas€ wasprovided on amln bp€ by Jesstyn growh of the EDC. Vegetauonclassifi€tion was based on spectral charact€ristics de.iv; fromAVHRR satellate data and ground truthed tor accumcy. ituttitempomtindices, such as th€ NDVI desc.ib€d above, r€vcat chronotogicat andspectral reflectance ditfer€nces that wer€ used to ditrerent atevegetauon classes (*s Aar.eu and Curtis i976. Johannsen andSand€rs 19a2, Norwine and creegor lgag, coward €t at. tgAS,Townshend et al. 19a5, 1947; Roller and Cotwett tga6, Date i990.B.own el al. 1993)- These techniques were used to ctassity vegetationfor each lk|n block in the cont€rminous U.S.d76
Vesetation was cla$ilied into 167 categori€s on lh€ 1991 AVHRRcompanion dEc. The cBC and BAS sites were overlaid on ih€vegetttion lmagery vrith the amoont of each vegstauoo class bt'perceht covo.as€ calculated fo. €ach il41 squar€ klomet€r sr€a.Staustical analys€s wer€ perrormed to d€termin€ if the pr€sence ofc€ttain vegetauoh classes, or conbinations of clases, could be usedto pr€dict the occurence of vultures. lt was oresum€d that wlturespr€f€renually selected certain veg€tatton da$6 in their home rangesfor cover or food sources. Th€ €nremely tine divisioh of vegetationclasses in this data set mad€ correlauoh at this scale difficult at b€st.if not impcsible. Examinauon of vegetaud classes revealed manyduplicate categories. This resulted trom simila.land uses in ditrerentparts of rh€ co!ntr!'. Fo. example, a soybean field in Alabama wouldshow a mark€dly ditterent temporal spect al refleclance ov€r th€course of a y.ar cohpared to a similar field in Ohio. Clumpins ofv€getauon class€s as desc.ibed below was also acco.nplished forcoars€r resolution.vegetation was also reclassm€d into 49 mo.e g€n€ral classes on iheAVHRR companion disc. The percenrages of each class within eachsurv€y ar€a were calculated as above. Analyses d thes€ data wereaccomplished in the sme mann€r as th€ mor€ spedfic v€getafonolass€s. This test was conducted to detemine if the vulturest€sponded to cover typ€s to a c@6er degrce than implied by thedivision into the 167 more sp€citic vesetauon classes desc.ib€dThe vegetatjon classes described above were also clumped inb a veryb.oad categories with th€ 6ame analyBes pe.formsd as abov6.3.10. Ecor€sions:The AVHRR companion disk also includ€d informafon on ecoregions.The ecoresions wer€ as detin€d by the Environmental Prot€cfonAsency (EPA) and ilajor L5nd R$ourc€ Ar€as (MLRA) as compil€d bythe Soil Cons€rvauon S€rvic€ (SCsl. The ecoresion data wereo.isinally digitized from th€ 'Ecor€gions of th6 conte.minous Unitedstat€s" (Omemik 1984 map and gengrally confom€d to oth€r suchecoregion d$ignarions (see Fenneman 1931, l93a; Bam* andmarshner 1933, Kuchl€r 1964, Anderson €t al. 1976, Omsmik andGallant 1949). The ecoregions data set contain€d polygons bas€d oncommon soils, lahd use, natu.al vegetalior, landforme, and .urfac6geology. These €cor€gions aro divid€d into 75 catego.ies. This wa6 aturther assr€sation of veg€tation types but includ€d othsr featurc3477
which may have determined the presence of vuttt'|res and theirabundance" The objective was to test wheiher vuttures preterentiattyselected certain ecoregions. Thedifficultpartof this evatuatio asthatmany other tactors desc.ibed above covaried with this genoralcharacteriauon of the environmant thoush no efiort was made toseparate lhese etlects. Also, as ecoregions were discreet units, theycould not ccur io ditre.ent areas ot the country as might att other4. STATISTICAL APPLICATIONS:Each of the analyses described below were performed using a GISoverlay process to detemine the area of overlap between va.ious datalayeB. Each of the 2,026 Chrislmas Bard Count circles, and the 2,167Ereeding <strong>Bird</strong> Supey routes were t eated as individual samples. Thevalue assigned each site was the mean number of vultu.es pe. pa.tyhour, pe. count carcle, per year for lhe CBC, al|d the mean number ofvultu.es per route, per year for the BBS. Environmenlal data layersunderlying each bird survey site were represented as the mean vatuefor each facto. contained within the ,141 km2 bird suwey area-Statistical analyses were performed using the SAS program (SASIn$rut€ lnc., cary Nc) and S-Plus (statisucal sciences, Inc., SeatueWA). Bivariate linea. .egressions were performed for each factoragainst CBC and 8BS data sets. Environmental factor data thatfollowed cdtinuous dist ibutions were anatyzed using tEdiuonalstalisttcal approaches (see Harris 1975, Zar i9a4, Morrison 1990,Cressie 1991). For lhose dat classilied as discreqt, regresionanalyses were run againstthe perc€htage otthe,l4l kmz cells in eachsudey area containing each discreet variable. staUsucalassumpuons necessary to perform these analyses includ€ therollowing, where Y = lrle numbe. of vullores at each survey l@auon,and X = the environmental faclo.lested:1 . variable Y is heasured at the interval or ratio scale.2. variable { is measored without eror, whereas anymeasu.ement error an Y is random,3. the relalionshiD between Y and X is linear_4. r}|€ error variable h5. ihe error variable has constant variance-6. all pairs of e.rors are uncorrelated, and,7. the error €riable is normallv distributed.(-adapted from criflith and Amrh;n 1991).The assumption most lik€ly viotated from the above list was numbertnree, that the r€lationshios between envi.onmental factors andTurkey Voltlro numbeE were linear" No dorbt" sophisticated478
trahsformationB of th€se numerical disttibutiom could have improvedths p.edictivs power of th€ statistical techniqu€s, b'rt the correlationgb€h^'een vuftu;es and the va.ious environmentat vatiables likelv wouldnot hav€ chang€d. Forlh€ sake or3implicitv and becaBe ofthe laryenumber of vari;btes consider€d, othe. than ranking $e BBS and cBCdata. 3uch t affifomations w€rs not accomplished as Part of thisiniual research analysis, but hight be appropriatt for follolr'-onMultiple rogression analyses includihg st€Pwise, backward, forward,ana nraximum R regr€ssion w€rG then perfmed to lind t||e b€stcombination ot preaictors of Turkey vulturo abundance' Theset€chniques wsre used as a screening mechanism to determine keyv.riabts from the list of environm€ntal factors that b€st e$lainedvariability in th€ vulture data. These techniques wer€ not used, and-ay nof u" apptoprial€, for determining th€ imPortance of eachvariaue relauie to other va.iables, but havs the advantage ofaccountjng for covarianc€ b€tween indePendent factof3 not Po€siblewith stand:ard bivariate techniques (se€ Janes and Mcculloch 1990)'R€sults of these analyses were usd to estimats th€ numb€r ofvultures exD€cted at a site as a funorion of a combinatioh of variousehvironmental factors. E.9. Y = f {xi, Xi+l' xn)' wher€ xi =environmental factor.P.incipal compon€nt ahalyses (PCA) also w€re Performed on varioussub€ts of thes€ data ro potentialty simPlirv the modeling pro€e$'The$ proc€dures geneaied a sreaUv reduced number of !/ariablesr.p...6'rt"o ty u'. i."utiant princiPal comPonenb, though describinsuri: onen comitex component5 p.oved diniculL A substantial amountof the varialion amonsst th€ environm€ntal vatiables could beexotained bv th€ lict few principal comPon€nts' and it was hoped that""ir"res numuers would corr€late with thes€ new €.iables- Hoq'owr'when th6 PCA scor€s were correlared with the CBC and BBs data' noimorovement could b€ dete.rnimd over tho original variables' In fact'in moet instances the r€sott! of tfte PcA scores explainod 1e33 of thevariance than thc original va.iabt€s. Thus, tho original vtriable3 ared€scribed in these r€sutts d€sptue tha fact t||at manv covatv€ubstantially with one or mo.e of lho other €nvironmental vatiabl€s'
RESULTS:1. BIVARIATE REGRESSIONS:Preparatioh of the environmental dara sets resulted in over 300variables for correlation with aach ofthe vulture data s€ts. As it wasunlikely that most of these variables were imPortaht in exPlaining thevarianca in the bird data, a scr€€ning p@ess was necessary to limitthe data set to a smatler list of key variables. Bivariate andmultivariate analyses were used towards this end.Standard bivariate regression analyses were performed fot eachenvi.onmental variabte against the BAS and CgC data- Resulls f.omthe 167+ategory vegetauon data revealed that these divisionsgenerally were too smalt to be meaningful at rhe scale of this study.Therefore, lhey were dropped from further analysis Remainingvariabtes were divided into geographic, clirnatc, and pltysiograPhiccategories. Corelauon coefficients and significance lev€ls we.ecalcutated for each. Tho6e variables wilh the highest absolute Rvalues w€re designated key variabl€s and used lor further a.alyses(see Tabtes 1 and 2). An absolute R valu€ above 0.06 was chosen asthe cutofi point as it formed a dEmauc natural break among allvariables considered- Correlauons between vulture abundahces andalt key variables were signiticant at the O.0Ol level for both the CAC.nd BBS- These signilicance levets wer€ not surPtising, given theenormous amoont of data analyzed (n : 2,026 for the CAC and n =2,167 for lhe BBS), but wer€ reasuring in that the relationshipsexplained could notbe due to chance alone.Table 1. Correlations between summe. Turkey Vultureabundance from Breeding Aird Surveys and keyenvironmental variables (n = 2,167, all R valuessisnificant at p < 0.001).r|aylharm.l Retle.bn.6Elavation St ndard Deviauon.t9a-.152Numb€r of F.oslFree Daytlri.inufr A.nual TemP6rato.6rrrxinum Ann6r TGmP.r.lnr..321.172480
PhvsiooraDhicVedetstion{'9 ctieoodrcroDla.dlvroodl6.dc..;!landrshrubl.nd,wdrandoes€rtShrub!soulhern Pinel|veuand.R.2aa.126R@ry [ountain r.i:6d For€a!veoer.tion ls CateooN)RsoulnTex.sPldn!E.st Cetrlrsl tsr.3 Pranjsoul'le..Ocserlscenualorl.homa_Texts916rnssou$ cenkal Plaan.re$. Blackland P.airi63soulh florida co.'tal Plainwetern Gult cor.tsl Prarns6utn e c€ntCilifPltint tnd Hnri-324.225.211-121rrid-auantic coasLl PlainNorlhes.tern Highland'481
i,;;l:;;mi.fr ',illi+[+d#***-*'u'*'".164fF_:ffit#Tifiii"tr-'-l5t-D.cem6o. tenp...rur6irxsii;1"jig:3;-ue.ahbe. prccipitalioruoc€hbsr Sn4 AccumltaUon.2t3.201-211.tl3Sourho.. ptn6/W6U.nd..lt9.052-.122.07a.062482
Sorrh C..tt!l Plain. '211so{tn Floridaco.st lPl.in '193soolh..lt m Pl.ln. la4Ea3t cent .l1.xa6 Pl.in. _170South C6frltal Plaln.isarid-Arbnuc cd3t lPlaln '114wcstern Gull c@rtll Plain'oa6oachlt o!nr.in. 043Tera.6l..tland Pr.t.i€. '076r|l$b.iPpl V.llt Loe.o Plalncenrrd iiklaho;a-Teta. Plaino 066Results from these analvs€s r€vealed that Turtey Vlfture abund-ances.."iJ o" ..*r"t o *i[' a variev ot €nvironmehtal factors' vulturor.o"r"ti"". -*t .*t "tt"nslv ;orretated with geophvsical ractors'l"fo""r"at t.-o..a".e. du;hs both summ€r and wintGr' vulture:.il."";r were posiuvely conelat€d with several temperatlre;;il", ;; ". ;."n nontrtv temperatures, the number or r'o€t-Les davs. minimum, and mdimum annual t€mPeratures eani..tl'r"i.i.o*.t -i *ere th€ st'ongest pr€dictors or all seophvsicali."i...'a"a,iq b.th *".ons. vulturo abundances also wer€ Po€ifvelvcorrelated with measures of lhermal reflectance b€tween seasons_rrt"" were ""qaU*rv correlated t/vith both mean olevation and surfaco-"ir,"."" t.i.*u.i, standard deviauon) in bolh seas'ons' vultures"i"-.d""""i were Posiuv€lv corelat€d with monthlv and annualmeasures "t precipliaUo", but negauvelv conelated with winter snov'Examinauon of physiograPhic correlates r€vealed consiste"t pattemsi" *itr...' o.i,r,i-"i. ior certain ecregions' but ditr€rences inDret€rences for v€geiauve cover typ€s within ihese €co'egronsLL;;;;;".".. r;rkev vurture€ w;rc mct clo*rv ass@iatot with0'" soLrtr"m ana cun co;sral Plains and the mid-Auantic and Flotidacoastal Dlains dunns summer and wint€r' Breeding vultur€3 u'€r€.also**-[.a *iu' !;them des€rts and Califomia ptains and hills'Wilhin these ecoregions, brceding Turkev Vulture abundances w€remost sttonqlv pciuielv correlated wilh h€terogeneous and mo@ open".o.r"u""ii6it"t". rie* cwer tvpes included savanna' shrubland'"l,l"arral. q.assr".a. and mixed croplands. Thev wer€ moet st'onglv.."k".rJ i".a*i *i$ rorssted a'eas' ou'ins winter' bv contrast'vuitu'es i€re much more srtonslv assdiat€d vtith foreated ar€as andLra"J t" "r"lo --" "pen ar-is such aE srasslands and -croPlandunt€ss these were inter€peFed with forested cover VPes weuandBalso appeared impottant during winter' weuand habitats occur433
pramarily in the southeastem U-S. and are trequenuysuchassociated with:f::_yp*as sourhe.n pineaDundanc€s,o.€srs. hreresrinsty,were poslivety vulurecorretared with rhe*_* "f riJ;trrri;;;;#::t"*3**!"*J:*#l.lur""n*l:*"l*sl*lliln .se_neEt, .absoturecoretatonsqvronmenrat between vuttt.€va.iabtesabundanceswereandtower,n€rerhan mightar€ sevemth.""possibreb";;;;il:exptanationsmosrforhp_o.ra.nuy.,ih*. rr*q."J;";";is rh€ inhe.€.t va.iabitity int od*.a ui, u," i#fiJ;"?:::;iff :ff .:l',*Tdwv'"swuemtaurrors#.;;;;;;mor€ .iso.ous in iG app.."J. ;;;;"-#n#"1,*:,S"""1?";:.;ij;tse€ Hobbins and valt Vetzen 1964-varuesExaminauonro.. an variabtes"r m-*r.":i"ibetween sudeyssuggeste
irds at a sisniticant number of sites. As the staustical t€chniq@sused |nay b€ particularly s€nsitiv€ to outli€rs, som€ of th€ variabilivmay b€ etplained by such s€nsitivities. To addr€ss this potentialpi6all, bavariat€ regression analys€s w€r€ rep€ated on ranked AASand cBc data to more cloeely approach normality. Results from themnkod data set showed only a dight improvernent in som€ of theconelation co€fficients, and no improvem€nt in nost others. But mostimportantly, thes€ transfomations did not chanse lhe list or keyva.iables r'or .ubstantially chang€ tfteir sequantial posiuons relative toOespite th; comparatjv€ly tow R values, results or tnese correlationalanalyses revealed consistent and interpretable patterns ot TurkeyVultur€ abundances thr@shout their rang€, and bstw€€n s€aons.These r€sults lend substantial insight into th€ habitat requirements ofthe Turkey Vultu.€.2. MULTIPLE REGRESSIONS:A seri€s of multivariate analyses nen were performed on varioussubsets of the original data to det€min€ if some of rhe sme keyvariables emersed as the best predictoE of Turkey Vultlredistributjons. Th€s€ analysos wer€ used to screeh variables as withthe above bivariate r€gression analyses, but offered the addedadvahtago of reducing the €lfects of covariance between factor€.Covariance offactors could not be det€tmin€d with biva.iate ahalysest€chniqu€e. St€pwis€, fo.ward, backward, and maximum Rreqre$ions were performed against both ranked and unrankedvulture data s€ts for this purpose. Each of theso procedures wasperrormed on the enure data s€l key variables from th€ bivariateregrcssion analyses, and d subsets of geogEphic, climauc, andphysiographic va.iables- These analyses w€r€ used fo. screeningDr€dictors and to reduco the list of variables. but w6|.s not used todetermine th€ relauv€ imDortanc€ of va.iables. R*ults from th€s€analyses were complex, yet generally rev€aled consistent patt€rngtftat suppo.ted ths findings from the bivariat€ regr€ssioo analys€€.For th€ sak€ of br€vibr, only highlights from th€s€ proc€dures will bepres€nted here. R€sults of th€ manmum R regres{tid procedurG willbe pres€nted, as it may b€ th€ most robust of lhe tachnigues us€d(SAS Institute, Inc., Cary NC). However, the variable3lhat emetg€d asbest esumatoE of the bird data did not differ subslanually b€twe€niraimum R analysis is a stepwise procedur€ that sequentially addsva.iabl€s to a r€gr$sion mod€l in order to madmize the .esidual485
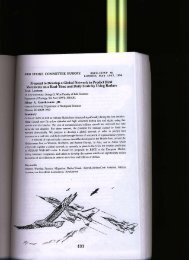
variance explained at each step. Appticauon of this procedurerevealed that4o.il0% of lhe totat variance in th€ greeding <strong>Bird</strong> Sudeyvultur€ data corld be erptained after 187 steps, beyond which n;itnprovement occured. MGt of the cumutative variance wasexplained io the tiEt few steps, however, and graphic disptay of theseresults showed that the tine rep.esenung cumutauve variance quicktybecame asymptotic app.oaching the maximum vatue (see Figure 3).The lirst ten steps shown in Figure 3 accounted for 33.6r/0 of the totalvanancs in the vulture data, ora3.3% ot the va.iance exptained by theenure analysis. For the Christmas Ai.d Count 27.86% of the totalva.iance was explained after 223 steps. Aqain, most of the variance(2?.34%ofihe variance in the vutture dara, orAo% ofthe totatvarianceexplained bythis p.ocedu.e) was accountedfor in thefirstten steps.6.^s5,u: .^5+ BtsS + CBCFigure 3. A comparison of.esutts from mutupte regression anatyseson the BBS and CBC against environmentat factore using a maximum Rsrepwise technique. The cuhutauve percent variance exptained bythe firstten steps ol these anatyses are represenreUror eactr suruey.As with- .!h:bivariate res'essions, murtipte resression anatysesrevealed that more variance coutd be exptained tor the Breeding'<strong>Bird</strong>sudey and 't may be a more retiabte technique than the Christmas<strong>Bird</strong> Counl Nevertheless, some of the sme key variabtes seemed tobe important to the vuttures in both summe, and winter. and the486
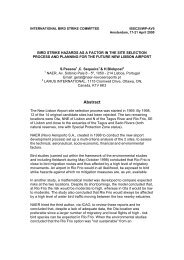
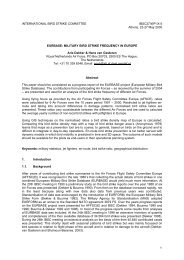
esulls were consistent with th€ biva.iate r€gresion anatysespr€vioBly performed. Coosistent results betr reen resr€s-siontschniqu* vrere r€assuring since r€lat€d factors that covarystatisti€lly could have mado interpr€tation of .esutts mor. ditftcuttTable 3 lists th€ liJst ten variabl€s add€d to each of these marimum Rreg.sssion models f6 ths BBS and CBC on a subset of thaenvironmental data set including only th€ b.oadest of vegetalionclasses. Thes6 analyses again rcred€d tllat tempeEt!rc variableswere important pr€dictoE of vultur€ abundanc66 d'r.ins both sunmsrand wint6r. Pr€cipitation and the distanca to pe.manent water alsosemed important in rhe$ analys€s. Th6e results also suppo.ted th€physiographic habitat preferences of vultures during both s€asons,with more open o. mixed habilats ihportant in summ€r, and forestedand wetland areas important in winter.TABLE 3. Envirombehtal variables add€d in the first teh steos ofmaximum R mutuple reg.essio modols of th€ Bre€ding <strong>Bird</strong> Surveyand Christmas <strong>Bird</strong> count on Turkey Vulture abundances.2 ArnualP..ciplt lion4 *lnhln Annusl T.npar.ture6 V€e Cl.* - W..dl..drs.v.nm7 Veg C1... - Shruh/Cft .paral3 M.rinun Annual i€mp€rat!.6I Numlre. of Fro.t-F.e. D.y.10 Dbt nc6 to Pehanentw'ter14Deoenbe.T.np..at!..Veg C|6.. - Shrub/ChapadalShihlD Arnu.l Tcnper.t!r.Annlal Preoipit liorD.ceib.. Pro.ipiLtimOec6mb6.T6.mrl RaioctrncoOista.ce to Pernan.nt W.ter3. SUMiIER VULTURE OISTRISUTION:The model surfac€ gen€rated from th€ BBS data revealed lhe summerdietribuuon and abundance pattems of Turkey Vult!rcB (Fisure 4).ost birds inhabit€d lhe southem hatf of the Unit€d Statos. Thehish€st concenlrations of vultllr€s w€r€ in broad areas of fie sorihemplains through T€xas, and th€ norida p€ninaula, but signincantbreeding populations of vultllrea occured at diveGe locationsthroughouttho couhtry. Hish concentrations of vultur€s in ar€as Erchas Califomia's central valley and norlhem coaslal reglo||, southemArizd'a, th€ Ohio River eall€y, and ths Chesapoaks Bay resion, as well|nor€ localiz€d populations, w€re evid€nt from th€s€487
esutts. p.ocedures_Thesatso reveatedbreedDgTorkeyedensive areasVuttureswherewere absenr orrne.nounrainousscarce. Most notabtedeswereof the north and west,H_a|ns.and tnevltturesnorthernatsoGreatwere m.e in rhe itensety r"*"r.o.i."" Jtl]_:* :lsr:.1srates. parricurarryoramaucalyMaine. rhisheterogeneous.""rv.r" .","j"j."distribuUonirreeding "tr"a"-r.. puU"..rloiTorkey Vuttures thrcuqh tha U-land,,om mo.e t. adirionarnot be impried, a"n" ,n"0" 'o, ,n*";,11,1@urd4, WINTER VULTUR€ OISTRIBUTION:surfaceIl^",-T1"sene.ated fro,n rheprocedu.cscBc darareveatedusins rhethcabovewinter distributionor andrurkey abundancevutturespatternsin r''e unirad stares (tsisuremhabiled rheof.sourheastem"*t p"ri"i".u#israres. rh;brds r,.*r".iwcre """""idr,_l"iin lhe sourheh ptains o, Teras andc@rrat ptainu,..*U,-"througttai.""U-.the Ftorida penihsuta. Drrds rsotated we.e cohceht ev'deht ations in severat otarcas otRiver the count'vairds orsuche'.yas*"-rheiisnat(eri"r,l. iit!'=arongouthernthe chesapeakeAnpalachians,Bav.and1i.l-l:*:r..9 lyrhis surrace was rhematontycrear ev,denceor.birdsrharwhichthesuhme,vasrin rhe westemreg"ron rorU.s.rher,uawinter.o"p"JioMostofthesei-.birds probabtyand.:ro!th America.migratedtttow.sCenUaiatso possibtenor.rutharysom6comptetedotthe \t|ttu,esrheir misrauonhadatuouh(s,rhe Ume "tastheseu,u cr,.i.,rn*counts occurre.tdiiearty inn€lethebaen padicuta.tywinter season, frrisrrr"navqani" u," "",iu,".n.r"u..wmtcnng poputauons,;-;;;,.;:il:;may have bcenr@auons counredir atthis somewas CBCthe case. Mioratoho,ven rhe habirar serec,".0..""*.rhus mav have", ,n.r."oi,Lx'JorDrscusstoN:Tu (ey_vultu.e distribuuon and abundance panernssb a numberwere co..etatedof envircnmentat factoF bot_' nese d,srr,bouon h-spatiallv ahd tempo-rrv.and abundanceh:r:..o.sdeous, and rhe ."""iliil;;"Jjffffi " l,.J;"" j:""U,ivanabres that each cont ibured inc.ementaly r" u," ",rr,..sceophysicari.JiU-if:11,.T*r".racrors, especra y rhce retated to::Tte.ature, oFurburron were rhe stronsest p,edicrors o, v"ir,,,".u*u""JJ""ipaitcrns. winte. vutiure poputario".same host"".a.t"aof geophysicat * t u,-JfactoE or' re,;h"fl1":;"itlc;;i;#;;;.i"#iiTi1"fu i,tii['?[Ui{88
3-'c si E>oit(t)ooctooia.\Zp Ei: ec6r0b..i,! a>€95'a -9 b3;:? ! ;E,;Y9ii9J-A R489
9l .EG1?.t!:io(JEIu)(E'EU'(J'i6:o.it>5 oh.9 9;.E;i?N-)!;5!6'lbt3"tS ^490
: : :..\ct(JEIu)vt.96ig9;o,:.t! u->,! orl!}EE()6 ,,t t:Scid.-ite.? *- -Lli: 5 h490
preferent ally selected cover types that varied b€tween summer andwinter. During summer, Ue bi.ds seemed to prefer heterogeneoushabitats throughout their rang€ such as shrubtand, savanna,chaFarral, or mixed croplands which a.e more open in naturs. Theyavoided heavily forested a.eas at tnis time ot year. Southem pinefo.ests were used during summer. but these forests have huch moreopen canopies than olher forest ct6sificatons and ar€ oflenass@iated wilh olher cover types such as weuands. perhaDs it ismore dinicult lo obsede or secure enough f@d to mi$ young inforested a.eas. or, potenuat nest sites ;outd be timited in heawOeciphering the habitat p.eferences of wintering vuttures was moreprcblematic. Th€ ma.iority of Turkey Vuttures that summered in thewestern U.S. departed th€ country for wintering grounds in Centraland South Ame.ica- This fact, combined with a sampting €ffortdisparity between easlern and westem No.th America. made thequality of available data very much lowe. an the west than th6 east.especialty during winter. Examinauon of the conunentat U.s. as awhole, recognizing that the corretatons were targety driv€n byeastern vulture populations, .eveated that wintering birds e,ftibited ;much stronger prefe.ence for fqested areas than breeding vuttures.Winte. roost sites were lakety chosen p.imarity for their thermat coverDense vegetation providirg communat nighttime roosting cover withthemal prctection as important to Tur&ey Vuttures during the winter,and fotests were presumabty favorable habitats (atso see Witke6onand Oebbon 1980, Sweeney 1944, Fraser and Coteman 1909.Thompson et al. 19901.Summarinng the major trends in these data, it is apparent that Tu.keyVultures consistenuy demonstEted prererences tor certainenvironmental lacloE in their set€ction of habitats th.oughout th€irrange and between seasons. They sought simitar geophysicalcondiuons, but prefered differeht physiographic envircnmentsbetween seasons. Breeding wttures sought more heterogeneous andopen habitats- Winte.irg vuttures prefered more densety for.stedhabitals. Thes6 preferences for va.ious environmentat factors coutdbe used to predict the distribution and abundance pattems of TurkeyVultures in the continental United States and may hetp flight ptann€rsand route designers to avoid areas of potentiat bird hazards to ttiqht49;]
coNcLUstoNs:Results from lhis study dchonstrated that environmental variablescould be used to hodcl and oredict the distribution and abundance ofTurkey vultures on a scalc neve. previously altempted, yet withrelatively fine rcsoluuon- A clearer picture of Turkey Vulturc habilatsclcction prcfe.ences has emerged. Turkcy Vulturcs rcspondedconsistenuy to a variety of external biouc and abiouc facioGihroughout thoir ranqe and between seasohs. Results of these effo.tshavc hclpcd gain insight intothis unique specics and will also be usedby the U-S- Department of Defense lo hinimizc bird strikc hazards toits aircraft. lt is hopcd that the tachniques developed can be appliedto ourer specics and thatthis work can promptfu.lher efiorts to betterunderstand ihc natural hisrory and ecology of the Turkey Vulture andat the same time, make the skies safer for aircraft that share thei.493
ACKNOWLEDGMENTS:-ttany tEopte hav€ assisted imh€asumbty in co ect_ng1:_d,!T!::r!q dSta fo' .!his proi€ct and rh€ attacrrec plper.oegrn_to I cannoitnahk them aI, but sevorat deserve sp€ciat ;entionca.l Bockh€r6.of tho Departn6nl of Environmentat. poputation, and:.j9::'_.:':_9r1*y-+*e u.niv€rsiv "r c"u-J"' *iIJ."'hi1Jpoessor and comminee chairmah fo. rhis proiect orher committ;om€mb€ra w€re Oavtd Chisza., Witson Crumpacke., At€xand€rCharlesCruz,Soirthwick, and Ca.ot Wessman. They a[ provided invatuabtj:_d:::__"ld^T-",:?.:" .ih this p.ojecr i"."ri u..itt,.nompson, ui"il.iuavrd Arrington, and chrisuhe Attins ofAjrcEfrthe dsAF<strong>Strike</strong>airdHazard Team provided much o,staustjcs. peterjohnthe bird strik€-Bruce pro;ided lh€ a.".ui"s ei.otrom.lhes,-.y l.i;Nauonat Biotogicat survey. .rames Lowe pr"uioJuch.islmas <strong>Bird</strong>ureCount data from ihe Nato.,at AudulonJcsryn--brownsocietrorrhe uscs ERos Data center provided.nro.malion lhucion severat of the envi.onmentat dara seG u*d herein.J,ohn gscheid and Daniet Haynes ofctREs and rhe,ceNauonatuaEsnowuenEr p.ovidedan;environmentat .tata. Micha€t Hodgs.m of tn€c€os.aphy:,".T9:1!:tat rhe univer6iv or cororaoi' provide jmucn-needed assistance in addressinq geographicsystemsi.romauonmanip-utauons and spauat a-ata anary"es.snepardsonKennethor Spectfuh Sciences and Softr*are, tnc. providedmnumerabte th;data transfdmauons fo. tnc many and diverseneededdataforsetsthis study. Jahes Zack of tne G6, n.tn.r" S...1.g, ".dc-artosraphy Lab at cU !,roduced th€ cohputer s-pr,i.. in u,i"ark Camara provided ilp.iassisrancs wiur u,"pr@eduresnri-eror,. staii"ii""rused in this p.oject. I am ind€bted to theh a[.494