2013 Environmental Scan - Community Services & Health Industry ...
2013 Environmental Scan - Community Services & Health Industry ...
2013 Environmental Scan - Community Services & Health Industry ...

Create successful ePaper yourself
Turn your PDF publications into a flip-book with our unique Google optimized e-Paper software.
THE CARE INDUSTRY – A TIME FOR ACTION<br />
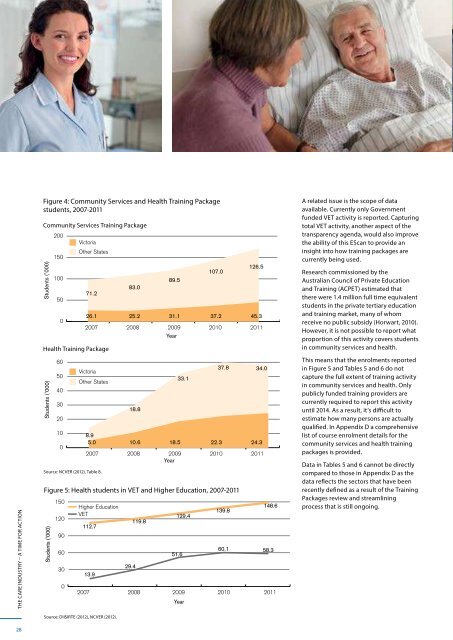
Figure 4: <strong>Community</strong> <strong>Services</strong> and <strong>Health</strong> Training Package<br />
students, 2007-2011<br />
<strong>Community</strong> <strong>Services</strong> Training Package<br />
Other States<br />
126.5<br />
150<br />
107.0<br />
100<br />
89.5<br />
83.0<br />
107.0<br />
126.5<br />
100 71.2<br />
50<br />
83.0<br />
89.5<br />
71.2<br />
50<br />
0<br />
26.1 25.2 31.1 37.2 45.3<br />
2007 2008 2009 2010 2011<br />
26.1 25.2 31.1 37.2 45.3<br />
0<br />
Year<br />
60<br />
2007 2008 2009 2010 2011<br />
<strong>Health</strong> Training Package<br />
Year<br />
37.8 34.0<br />
Victoria<br />
50 60<br />
33.1<br />
Other States<br />
37.8 34.0<br />
Victoria<br />
40 50<br />
33.1<br />
Other States<br />
30 40<br />
18.8<br />
Students Students (’000) (’000)<br />
Students Students (’000) (’000)<br />
200<br />
200<br />
150<br />
20 30<br />
10 20<br />
100<br />
Victoria<br />
Other States<br />
Victoria<br />
Source: NCVER (2012), Table 8.<br />
8.9<br />
5.0 10.6 18.5 22.3 24.3<br />
8.9<br />
2007 5.0 2008 10.6 2009 Year 18.5 2010 22.3 2011 24.3<br />
2007 2008 2009 2010 2011<br />
Year<br />
Figure 5: <strong>Health</strong> students in VET and Higher Education, 2007-2011<br />
Students (’000)<br />
0<br />
150<br />
120<br />
90<br />
60<br />
30<br />
0<br />
Higher Education<br />
VET<br />
112.7<br />
13.9<br />
2007<br />
18.8<br />
29.4<br />
119.8<br />
129.4<br />
51.6<br />
Year<br />
139.8<br />
148.6<br />
60.1 58.3<br />
2008 2009 2010 2011<br />
A related issue is the scope of data<br />
available. Currently only Government<br />
funded VET activity is reported. Capturing<br />
total VET activity, another aspect of the<br />
transparency agenda, would also improve<br />
the ability of this E<strong>Scan</strong> to provide an<br />
insight into how training packages are<br />
currently being used.<br />
Research commissioned by the<br />
Australian Council of Private Education<br />
and Training (ACPET) estimated that<br />
there were 1.4 million full time equivalent<br />
students in the private tertiary education<br />
and training market, many of whom<br />
receive no public subsidy (Horwart, 2010).<br />
However, it is not possible to report what<br />
proportion of this activity covers students<br />
in community services and health.<br />
This means that the enrolments reported<br />
in Figure 5 and Tables 5 and 6 do not<br />
capture the full extent of training activity<br />
in community services and health. Only<br />
publicly funded training providers are<br />
currently required to report this activity<br />
until 2014. As a result, it’s difficult to<br />
estimate how many persons are actually<br />
qualified. In Appendix D a comprehensive<br />
list of course enrolment details for the<br />
community services and health training<br />
packages is provided.<br />
Data in Tables 5 and 6 cannot be directly<br />
compared to those in Appendix D as the<br />
data reflects the sectors that have been<br />
recently defined as a result of the Training<br />
Packages review and streamlining<br />
process that is still ongoing.<br />
INDUSTRY VIEWS ON<br />
CURRENT TRAINING<br />
Less than two thirds of respondents to<br />
the CS&HISC online survey (60%) were<br />
satisfied with the quality of the training<br />
currently provided to students and existing<br />
workers. The most commonly raised<br />
concerns were:<br />
ww<br />
The speed with which some providers<br />
are graduating students may<br />
compromise quality training<br />
ww<br />
Capacity of e-learning and simulated<br />
learning environments to substitute<br />
for a workplace setting.<br />
A number of respondents would like a<br />
greater emphasis in current training on:<br />
ww<br />
Workplace learning and assessment<br />
ww<br />
Developing the skills of workplace<br />
supervisors.<br />
Poor quality and consistency of training<br />
outcomes undermines the confidence of<br />
employers in the value of qualifications<br />
and the reputation of RTO’s delivering<br />
quality training. In response we will<br />
leverage an action plan developed by key<br />
stakeholders in Children’s <strong>Services</strong> and<br />
Aged Care at a Training Quality Forum<br />
and broker the NWDF (which engages<br />
employers in planning and managing<br />
the development of their people) to work<br />
with RTOs to encourage good practice.<br />
Table 5: Enrolments in<br />
<strong>Community</strong> <strong>Services</strong> Training<br />
Package qualifications by sector,<br />
2009-2011<br />
Sector 2011<br />
%<br />
Change<br />
Aged care 40 106 49.3<br />
Alcohol and<br />
other drugs 3 401 58.9<br />
Case management 1 495 58.4<br />
Children's services 69 741 75.6<br />
<strong>Community</strong><br />
development 667 44.1<br />
<strong>Community</strong><br />
services general 33 197 47.8<br />
Disability services 14 812 52.2<br />
Education support 12 391 83.5<br />
Employment<br />
services 1 509 62.3<br />
Management and<br />
coordination 2 279 36.7<br />
Mental health 3 491 60.7<br />
Other areas 2 047 70.3<br />
Volunteering 935 24.7<br />
Youth, family<br />
services, child<br />
protection 6 387 35.9<br />
Total CHC08 192 458 59.7<br />
Table 6: Enrolments in<br />
HLT07 <strong>Health</strong> Training Package<br />
qualifications by sector,<br />
2009-2011<br />
Sector 2011<br />
%<br />
Change<br />
ATSI primary<br />
health care 1 918 25.8<br />
Ambulance 330 117.1<br />
Complementary &<br />
alternative health 5 094 17.9<br />
Dental/oral health 5 964 11.4<br />
Emergency<br />
response 7 546 -18.6<br />
General health<br />
services 19 641 10.6<br />
<strong>Health</strong> support<br />
services 1 761 -81.2<br />
<strong>Health</strong> technical 1 225 -22.3<br />
Nursing 22 922 18.7<br />
Population health 391 -1.3<br />
Total HLT07 66 792 -3.2<br />
ENVIRONMENTAL SCAN <strong>2013</strong> : SECTION THREE CURRENT IMPACT OF TRAINING PACKAGES<br />
Source: DIISIRTE (2012), NCVER (2012).<br />
28 29