2013 Environmental Scan - Community Services & Health Industry ...
2013 Environmental Scan - Community Services & Health Industry ...
2013 Environmental Scan - Community Services & Health Industry ...

You also want an ePaper? Increase the reach of your titles
YUMPU automatically turns print PDFs into web optimized ePapers that Google loves.
APPENDIX B<br />
APPENDIX C<br />
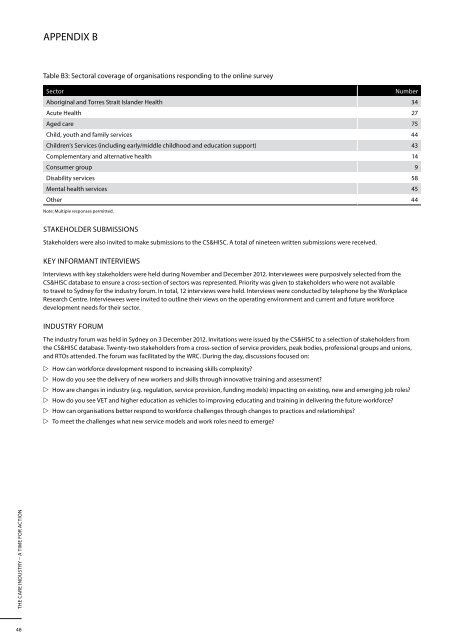
Table B3: Sectoral coverage of organisations responding to the online survey<br />
Sector<br />
Number<br />
Aboriginal and Torres Strait Islander <strong>Health</strong> 34<br />
Acute <strong>Health</strong> 27<br />
Aged care 75<br />
Child, youth and family services 44<br />
Children’s <strong>Services</strong> (including early/middle childhood and education support) 43<br />
Complementary and alternative health 14<br />
Consumer group 9<br />
Disability services 58<br />
Mental health services 45<br />
Other 44<br />
Note: Multiple responses permitted.<br />
STAKEHOLDER SUBMISSIONS<br />
Stakeholders were also invited to make submissions to the CS&HISC. A total of nineteen written submissions were received.<br />
KEY INFORMANT INTERVIEWS<br />
Interviews with key stakeholders were held during November and December 2012. Interviewees were purposively selected from the<br />
CS&HISC database to ensure a cross-section of sectors was represented. Priority was given to stakeholders who were not available<br />
to travel to Sydney for the industry forum. In total, 12 interviews were held. Interviews were conducted by telephone by the Workplace<br />
Research Centre. Interviewees were invited to outline their views on the operating environment and current and future workforce<br />
development needs for their sector.<br />
INDUSTRY FORUM<br />
The industry forum was held in Sydney on 3 December 2012. Invitations were issued by the CS&HISC to a selection of stakeholders from<br />
the CS&HISC database. Twenty-two stakeholders from a cross-section of service providers, peak bodies, professional groups and unions,<br />
and RTOs attended. The forum was facilitated by the WRC. During the day, discussions focused on:<br />
ww<br />
How can workforce development respond to increasing skills complexity<br />
ww<br />
How do you see the delivery of new workers and skills through innovative training and assessment<br />
ww<br />
How are changes in industry (e.g. regulation, service provision, funding models) impacting on existing, new and emerging job roles<br />
ww<br />
How do you see VET and higher education as vehicles to improving educating and training in delivering the future workforce<br />
ww<br />
How can organisations better respond to workforce challenges through changes to practices and relationships<br />
ww<br />
To meet the challenges what new service models and work roles need to emerge<br />
HEALTH & COMMUNITY SERVICES EXPENDITURE AND JOB DEMAND<br />
Table C1: Change in real government expenditure, selected community service areas, 2006-07 to 2010-11<br />
% increase in expenditure from previous year<br />
2006-07 2007-08 2008-09 2009-10 2010-11 2010-11 $m<br />
Aged care services 1 6.7 4.6 4.4 9.2 4.0 12 171<br />
Disability services 2 6.2 3.9 6.2 9.4 1.5 6 201<br />
Child protection and out of home care 3 14.3 13.9 13.6 13.5 3.9 3 114<br />
Children's services 4,5 6.6 5.6 33.0 4.3 7.0 5 358<br />
Homelessness services 6 -0.3 6.2 11.4 -1.6 48<br />
Source: Productivity Commission, 2012 (Report on Government <strong>Services</strong>).<br />
Notes:<br />
1. Total Expenditure on Aged Care <strong>Services</strong>, from Table 13A.6.<br />
2. Total expenditure on services (including actual payroll tax for NSW (for 2004-05–2007-08), Victoria (in part, for 2004-05–2007-08), SA (2006-07(in part)–2008-09), Tasmania and<br />
the NT), from Table 14A.5.<br />
3. State and Territory Government real recurrent expenditure on child protection and out of home care services (including intensive family support services), (2010-11 dollars), from Table 15A.1.<br />
4. Total government real expenditure on children’s services (2010-11 dollars) ($000), from Table 3a.<br />
5. The large increase in 2008-09 mainly reflects changes to the childcare rebate.<br />
6. Total recurrent expenditure on homelessness services, from Table 17A.5.<br />
Table C2: Change in real government and non-government recurrent health expenditure<br />
Government recurrent health expenditure1<br />
% increase in expenditure from previous year<br />
2006-07 2007-08 2008-09 2009-10 2010-11 2010-11 $m<br />
Public hospitals 4.4 5.7 6.8 4.5 4.5 33 400<br />
Private hospitals 1.5 1.1 8.4 2.5 8.8 3 671<br />
Medical services -0.1 3.9 8.3 7.5 4.8 16 610<br />
Dental services 2.4 -1.0 16.1 25.9 12.0 1 885<br />
Other health practitioners 4.8 16.9 26.1 9.2 4.0 1 340<br />
Medications 0.8 5.6 8.4 10.2 7.8 8 437<br />
Other health 2 2.3 7.4 11.4 10.1 1.3 15 958<br />
Non-government recurrent health expenditure 3<br />
Public hospitals 4.9 9.0 8.1 17.1 2.4 2 838<br />
Private hospitals 0.9 4.0 2.9 18.8 7.2 6 379<br />
Medical services 1.1 8.4 7.7 8.4 4.0 4 632<br />
Dental services 1.3 1.9 -0.9 2.7 6.1 5 805<br />
Other health practitioners 3.1 2.3 -4.6 -7.7 -1.5 2 403<br />
Medications 3.3 10.3 8.2 13.3 5.8 7 866<br />
Other health 2 2.8 3.9 3.4 5.0 -1.3 5 082<br />
Source: Productivity Commission (2012) (Report on Government <strong>Services</strong>.<br />
Notes:<br />
1. Government recurrent health expenditure, by area of expenditure (2009-10 dollars), from Table EA.2.<br />
2. Other health comprises patient transport services, community health, public health, aids and appliances, other non-institutional health nec., administration and research.<br />
3. Non-government recurrent health expenditure by area of expenditure (2009-10 dollars), from Table EA.3.<br />
THE CARE INDUSTRY – A TIME FOR ACTION<br />
ENVIRONMENTAL SCAN <strong>2013</strong> : APPENDICES<br />
48 49