Presentation - Kinross Gold
Presentation - Kinross Gold
Presentation - Kinross Gold

You also want an ePaper? Increase the reach of your titles
YUMPU automatically turns print PDFs into web optimized ePapers that Google loves.
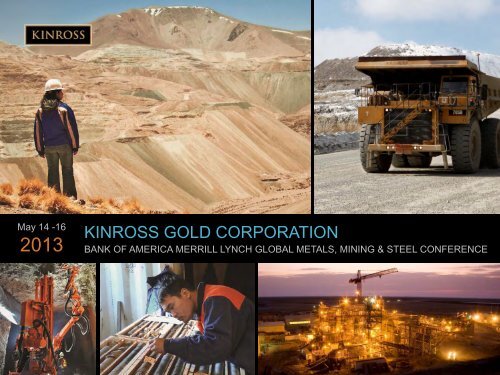
May 14 -16<br />
2013<br />
KINROSS GOLD CORPORATION<br />
BANK OF AMERICA MERRILL LYNCH GLOBAL METALS, MINING & STEEL CONFERENCE<br />
www.kinross.com<br />
1 1
CAUTIONARY STATEMENT ON FORWARD-LOOKING<br />
INFORMATION<br />
All statements, other than statements of historical fact, contained or incorporated by reference in this presentation, including any information as tothe<br />
future performance of <strong>Kinross</strong>, constitute “forward looking statements” within the meaning of applicable securities laws, including the provisions ofthe<br />
Securities Act (Ontario) and the provisions for “safe harbour” under the United States Private Securities Litigation Reform Act of 1995 and are based on<br />
expectations, estimates and projections as of the date of this presentation. Forward looking statements include, without limitation, possible events;<br />
opportunities; statements with respect to possible events or opportunities; estimates and the realization of such estimates; future development, mining<br />
activities, production and growth, including but not limited to cost and timing; success of exploration or development of operations; the future price of<br />
gold and silver; currency fluctuations; expected capital expenditures and requirements for additional capital; government regulation of mining operations<br />
and exploration; environmental risks; unanticipated reclamation expenses; and title disputes. The words “aim”, “pursue”, “plans”, “expects”, “subject to”,<br />
“budget”, “estimate”, “scheduled”, “timeline”, “potential”, “projected”, “pro forma”, “estimates”, “envision”, “view”, “forecasts”, “guidance”, “seek”,<br />
“strategy”, “study”, “target”, ‘priority”, “possible”, “illustrative”, “model”, “opportunity”, “option”, “objective”, “outlook”, “on track”, “potential”, “intends”,<br />
“anticipates” or “believes”, “thinks”, or variations of such words and phrases or statements that certain actions, events or results “may”, “can”, “could”,<br />
“would”, “should”, “might”, “indicates”, “will be taken”, “become”, “create”, “occur”, or “be achieved”, and similar expressions identify forward looking<br />
statements. Forward-looking statements are necessarily based upon a number of estimates and assumptions that, while considered reasonable by<br />
<strong>Kinross</strong> as of the date of such statements, are inherently subject to significant business, economic and competitive uncertainties and contingencies.<br />
Statements representing management’s financial and other outlook have been prepared solely for purposes of expressing their current views regarding<br />
the Company’s financial and other outlook and may not be appropriate for any other purpose. Many of these uncertainties and contingencies can affect,<br />
and could cause, <strong>Kinross</strong>’ actual results to differ materially from those expressed or implied in any forward looking statements made by, or on behalf of,<br />
<strong>Kinross</strong>. There can be no assurance that forward looking statements will prove to be accurate, as actual results and future events could differ materially<br />
from those anticipated in such statements. All of the forward looking statements made in this presentation are qualified by these cautionary statements,<br />
and those made in our filings with the securities regulators of Canada and the U.S., including but not limited to those cautionary statements made in the<br />
“Risk Factors” section of our most recently filed Annual Information Form, the “Risk Analysis” section of our FYE 2012 and Q1 2013 Management’s<br />
Discussion and Analysis, and the “Cautionary Statement on Forward-Looking Information” in our news release dated May 7, 2013, to which readers are<br />
referred and which are incorporated by reference in this presentation, all of which qualify any and all forward‐looking statements made in this<br />
presentation. These factors are not intended to represent a complete list of the factors that could affect <strong>Kinross</strong>. <strong>Kinross</strong> disclaims any intention or<br />
obligation to update or revise any forward‐looking statements or to explain any material difference between subsequent actual events and such<br />
forward‐looking statements, except to the extent required by applicable law.<br />
Other information<br />
Where we say "we", "us", "our", the "Company", or "<strong>Kinross</strong>" in this presentation, we mean <strong>Kinross</strong> <strong>Gold</strong> Corporation and/or one or more or all of its<br />
subsidiaries, as may be applicable. The technical information about the Company’s mineral properties (other than exploration activities) contained in<br />
this presentation has been prepared under the supervision of and verified by Mr. James K. Fowler, an officer of the Company who is a “qualified<br />
person” within the meaning of National Instrument 43-101 (“NI 43-101”). The technical information about the Company’s exploration activities contained<br />
in this presentation has been prepared under the supervision of and verified by Dr. Glenton Masterman, an officer of the Company who is a “qualified<br />
person” with the meaning of NI 43‐101.<br />
www.kinross.com<br />
2 2
KINROSS TODAY<br />
• Total gold resource base of 94 million ounces (1)<br />
• 9 mines produced 2.6 million ounces in 2012 (2)<br />
• Solid record of operational performance<br />
• Portfolio of development projects with significant potential<br />
(1) Refer to endnote #1.<br />
(2) Refer to endnote #2<br />
www.kinross.com<br />
3<br />
3
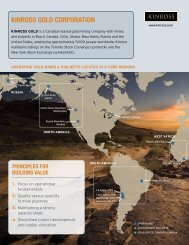
PRINCIPLES FOR BUILDING VALUE<br />
1. Focus on operational fundamentals<br />
2. Quality versus quantity in mine<br />
planning<br />
3. Maintaining a strong balance sheet<br />
4. Disciplined project development and<br />
capital allocation<br />
www.kinross.com<br />
4<br />
4
OPERATIONAL FUNDAMENTALS<br />
OPERATING MINES IN 4 CORE REGIONS<br />
• Diversified portfolio of assets located in some of the world’s best gold districts producing<br />
RUSSIA<br />
Fort Knox<br />
Kupol<br />
Dvoinoye<br />
Kettle River - Buckhorn<br />
Round Mountain<br />
NORTH AMERICA<br />
WEST AFRICA<br />
Tasiast<br />
Fruta del Norte<br />
Chirano<br />
2013 OUTLOOK (2,3)<br />
GLOBAL PORTFOLIO<br />
Operating mine<br />
Development project<br />
La Coipa<br />
Maricunga<br />
Paracatu<br />
Lobo-Marte<br />
SOUTH AMERICA<br />
gold equivalent production<br />
2.4 – 2.6 million ounces<br />
production cost of sales<br />
$740 - $790/oz. Au eq.<br />
www.kinross.com<br />
(2) Refer to endnote #2.<br />
(3) Refer to endnote #3.<br />
5 5
NORTH<br />
AMERICA<br />
• 2013 regional guidance (3) : 680 – 720koz. at $635 – 675/oz.<br />
• Well-run, stable open-pit and underground operations<br />
(3) Refer to endnote #3.<br />
www.kinross.com<br />
6<br />
6
OPERATIONAL FUNDAMENTALS<br />
NORTH AMERICA<br />
• Region on track to meet both production and production cost of<br />
sales guidance for 2013<br />
FIRST QUARTER 2013 OPERATING RESULTS<br />
• Slightly harder ore encountered at Fort Knox not expected to<br />
continue in Q2<br />
• Outstanding quarter at Kettle River-Buckhorn, with higher<br />
throughput compared to Q4 2012<br />
Fort Knox<br />
Kettle River - Buckhorn<br />
Round Mountain<br />
NORTH AMERICA<br />
2013E (3) : 680-720k oz.<br />
at $635-675/oz.<br />
• Round Mountain performed as anticipated<br />
OPERATION<br />
Q1 PRODUCTION<br />
(Au Eq. Oz.)<br />
Q1 PRODUCTION COST OF SALES (4)<br />
($/oz.)<br />
Fort Knox 93,252 $558<br />
Round Mountain (50%) 39,421 $804<br />
Kettle River – Buckhorn 39,870 $512<br />
NORTH AMERICA TOTAL 172,543 $597<br />
www.kinross.com<br />
(3) Refer to endnote #3.<br />
(4) Refer to endnote #4.<br />
7 7
SOUTH<br />
AMERICA<br />
• 2013 regional guidance (3) : 800 – 870koz. at $870 – $940/oz.<br />
• Largest operating region accounting for ~33% of annual production<br />
(3) Refer to endnote #3.<br />
www.kinross.com<br />
8<br />
8
OPERATIONAL FUNDAMENTALS<br />
SOUTH AMERICA<br />
• Region on track to meet both production and production cost of sales<br />
guidance for 2013<br />
FIRST QUARTER 2013 OPERATING RESULTS<br />
• Mill recoveries and throughput at Paracatu continued to show<br />
improvement<br />
• Lower production at Maricunga result of less favourable<br />
heap leach performance and lower grades from transitional ore as<br />
the bottom of the current phase is mined<br />
La Coipa<br />
Maricunga<br />
SOUTH AMERICA<br />
2013E (3) : 800-870koz.<br />
at $870-940/oz.<br />
Paracatu<br />
• Expect to suspend operations at La Coipa in the second half of 2013<br />
OPERATION<br />
Q1 PRODUCTION (2)<br />
(Au Eq. Oz.)<br />
Q1 PRODUCTION COST OF SALES (4)<br />
($/oz.)<br />
Paracatu 119,891 $831<br />
Maricunga 55,062 $1,091<br />
La Coipa 53,729 $704<br />
SOUTH AMERICA TOTAL 228,682 $861<br />
www.kinross.com<br />
(2) Refer to endnote #2.<br />
(3) Refer to endnote #3.<br />
(4) Refer to endnote #4.<br />
9 9
WEST<br />
AFRICA<br />
• 2013 regional production (3) : 415 – 480koz. at $890 – $950/oz.<br />
• Strong focus on increasing efficiency and performance in the region<br />
(3) Refer to endnote #3.<br />
www.kinross.com<br />
10<br />
10
OPERATIONAL FUNDAMENTALS<br />
WEST AFRICA<br />
• Region on track to meet both production and production cost of sales<br />
guidance for 2013<br />
WEST AFRICA<br />
2013E (3) : 415-480koz.<br />
at $890-950/oz.<br />
FIRST QUARTER 2013 OPERATING RESULTS<br />
Tasiast<br />
• Tasiast achieved highest quarterly production level since acquisition<br />
Chirano<br />
• Chirano performed ahead of expectations for the quarter<br />
OPERATION<br />
Q1 PRODUCTION (2)<br />
(Au Eq. Oz.)<br />
Q1 PRODUCTION COST OF SALES (4)<br />
($/oz.)<br />
Tasiast 62,757 $880<br />
Chirano (90%) 60,417 $730<br />
WEST AFRICA TOTAL 123,174 $808<br />
www.kinross.com<br />
(2) Refer to endnote #2.<br />
(3) Refer to endnote #3.<br />
(4) Refer to endnote #4.<br />
11 11
RUSSIA<br />
• 2013 regional guidance (3) : 505 – 535koz. at $550 – $580/oz.<br />
• Model for successfully operating in a remote region<br />
www.kinross.com<br />
(3) Refer to endnote #3.<br />
12<br />
12
OPERATIONAL FUNDAMENTALS<br />
RUSSIA<br />
• Region on track to meet both production and production cost of sales<br />
guidance for 2013<br />
Kupol<br />
FIRST QUARTER 2013 OPERATING RESULTS<br />
• As anticipated, Kupol mined an area of lower-grade material<br />
• Mill throughput and recoveries remained strong<br />
RUSSIA<br />
2013E (3) : 505-535koz.<br />
at $550-580/oz.<br />
OPERATION<br />
Q1 PRODUCTION<br />
(Au Eq. Oz.)<br />
Q1 PRODUCTION COST OF SALES (4)<br />
($/oz.)<br />
Kupol 124,498 $548<br />
www.kinross.com<br />
(3) Refer to endnote #3.<br />
(4) Refer to endnote #4.<br />
13 13
OPERATIONAL FUNDAMENTALS<br />
SOLID OPERATING RESULTS<br />
• Strong performance from operations delivered solid results in Q1 2013<br />
GOLD EQUIVALENT<br />
PRODUCTION (2)<br />
PRODUCTION COST OF<br />
SALES (4) ALL-IN SUSTAINING COST (5)<br />
588,358<br />
648,897<br />
$738<br />
$729<br />
$1,180<br />
$1,038<br />
Ounces<br />
$ per gold equivalent ounce<br />
$ per gold ounce<br />
Q1 2012 Q1 2013<br />
Q1 2012 Q1 2013<br />
Q1 2012 Q1 2013<br />
www.kinross.com<br />
(2) Refer to endnote #2.<br />
(4) Refer to endnote #4.<br />
(5) Refer to endnote #5.<br />
14 14
FOCUS ON COST MANAGEMENT<br />
CAPITAL DISCIPLINE CONTINUES IN 2013<br />
2012 estimate following<br />
project resequence<br />
$2.2<br />
Identified<br />
$200 million of<br />
capital reductions<br />
$2.0<br />
Actual 2012<br />
spend<br />
$1.9<br />
Continued focus<br />
on disciplined<br />
spending<br />
Capital Expenditures (US$ billions)<br />
$1.6<br />
February<br />
2012<br />
Q2 - Q3<br />
2012<br />
Full-year<br />
2012<br />
Expected<br />
2013 (3)<br />
www.kinross.com<br />
(3) Refer to endnote #3.<br />
15 15
PRINCIPLE TWO: QUALITY VERSUS QUANTITY<br />
2013 PRODUCTION & COSTS OUTLOOK (3)<br />
• 2013 outlook shaped by continued focus on cost control, margin improvement and free<br />
cash flow<br />
• 2013 all-in sustaining cost (5) expected to be $1,100 - $1,200 per gold ounce<br />
Region<br />
<strong>Gold</strong> Production<br />
(000 oz. Au eq.)<br />
% of Total<br />
Production<br />
Production Cost of Sales<br />
($/oz. Au eq.)<br />
South America 800 – 870 33% $870 – $940<br />
North America 680 – 720 28% $635 – $675<br />
West Africa<br />
(attributable)<br />
415 – 480 18% $890 – $950<br />
Russia 505 – 535 21% $550 – $580<br />
Total <strong>Kinross</strong>: 2.4 – 2.6 million 100%<br />
<strong>Gold</strong> equivalent: $740 – $790/oz.<br />
By-product: $690 – $740/oz.<br />
Assumptions: <strong>Gold</strong> price - $1,600/oz; Silver price - $30/oz.; Oil price - $90/bbl; Foreign exchange rates of: 2.05 Brazilian reais to the US dollar, 1.00 Canadian<br />
dollar to the US dollar, 32 Russian roubles to the US dollar, 475 Chilean pesos to the US dollar, 2.00 Ghanian cedi to the US dollar, 290 Mauritanian ouguiya to<br />
the US dollar, and 1.25 US dollars to the Euro.<br />
Key Sensitivities: Taking into account existing currency and oil hedges, 10% change in foreign exchange could result in an approximate $9 impact on production<br />
cost of sales per ounce. A $10 change in the price of oil could result in an approximate $2 impact on production cost of sales per ounce. The impact on royalties<br />
of a $100 change in the gold price could result in an approximate $3 impact on production cost of sales per ounce.<br />
www.kinross.com<br />
(3) Refer to endnote #3.<br />
(5) Refer to endnote #5.<br />
16 16
MAXIMIZING MARGINS & CASH FLOW<br />
THE KINROSS WAY FORWARD<br />
• 7 key areas form the basis of The <strong>Kinross</strong> Way Forward:<br />
1. MINE PLAN OPTIMIZATION<br />
2. CONTINUOUS IMPROVEMENT<br />
3. COST MANAGEMENT & LABOUR<br />
PRODUCTIVITY<br />
4. CAPITAL EFFICIENCY<br />
5. SUPPLY CHAIN MANAGEMENT<br />
6. ENERGY MANAGEMENT<br />
7. WORKING CAPITAL MANAGEMENT<br />
• Prioritizing cash flow<br />
• Optimizing pushback widths, mine sequencing<br />
• Exploiting zero / low-capex productivity improvements<br />
• Reducing unit consumption<br />
• Implementing better cost controls<br />
• Improving contractor management<br />
• Re-evaluating capital requirements<br />
• Managing potential deferral risks<br />
• Identified $200 million in capex reductions in 2012<br />
• Expanding globally-coordinated supply chain initiatives<br />
• Planning with greater accuracy<br />
• Establishing lower cost power purchase agreements<br />
• Reducing energy consumption<br />
• Enhancing inventory management<br />
• Reducing working capital requirements<br />
www.kinross.com<br />
17 17
CHOOSING QUALITY VERSUS QUANTITY<br />
MINERAL RESERVE & RESOURCE ESTIMATES (1)<br />
• Strategic decision to maintain gold price assumptions used for 2011:<br />
• Reserves - $1,200/oz.; resources -$1,400/oz.<br />
• Example of <strong>Kinross</strong>’ commitment to focus on higher quality, higher margin ounces<br />
PROVEN & PROBABLE GOLD<br />
RESERVES<br />
62.6<br />
59.6<br />
MEASURED & INDICATED<br />
GOLD RESOURCES<br />
INFERRED GOLD<br />
RESOURCES<br />
<strong>Gold</strong> ounces (millions)<br />
25.4<br />
20.3<br />
20.1<br />
14.4<br />
2011<br />
2012<br />
2011<br />
2012<br />
2011<br />
2012<br />
www.kinross.com<br />
(1) Refer to endnote #1.<br />
18 18
MAINTAINING A STRONG BALANCE SHEET<br />
SOLID FINANCIAL POSITION<br />
• Preserving balance sheet strength a priority objective<br />
• Repurchased convertible senior notes totaling $455 million on March 15, 2013<br />
• Redeemed in cash the remaining $5 million on April 30, 2013<br />
• Cumulative debt balance: $2.2 billion<br />
LIQUIDITY POSITION<br />
($ millions) As at March 31, 2013<br />
Cash and cash equivalents $1,421<br />
Available credit facilities $1,501<br />
Total liquidity $2,922<br />
www.kinross.com<br />
19 19
DISCIPLINED PROJECT DEVELOPMENT<br />
PORTFOLIO OF DEVELOPMENT PROJECTS<br />
• Optimized project sequencing, with Dvoinoye and Tasiast as key development priorities<br />
www.kinross.com<br />
20<br />
20
DISCIPLINED PROJECT DEVELOPMENT<br />
TASIAST ADVANCES TO FEASIBILITY STUDY<br />
• Pre-feasibility study selected optimum mill size for Tasiast expansion<br />
• Proceeding to a feasibility study on a 38,000 tpd mill<br />
• Expected to be complete in Q1 2014<br />
www.kinross.com<br />
21<br />
21
DISCIPLINED PROJECT DEVELOPMENT<br />
TASIAST ADVANCES TO FEASIBILITY STUDY<br />
• Feasibility study will explore a number of options to improve overall economics<br />
PRE-FEASIBILITY STUDY<br />
Estimated 10 million recoverable<br />
ounces<br />
OPPORTUNITY TO ADD VALUE<br />
Did not include other known mineral resource<br />
ounces<br />
Heavy fuel oil as energy source<br />
Exploring potential of lower-cost natural gas<br />
Did not include potential district<br />
exploration upside<br />
Tasiast is a large district with significant long-term<br />
exploration potential<br />
Throughput of 30,000 tpd<br />
Targeting higher production, lower costs with<br />
38,000 tpd mill<br />
www.kinross.com<br />
22 22
DVOINOYE<br />
RUSSIA<br />
• Dvoinoye continues to progress on budget and on schedule<br />
• Full production is expected to commence in the second half of 2013<br />
www.kinross.com<br />
23<br />
23
DISCIPLINED PROJECT DEVELOPMENT<br />
DVOINOYE REMAINS ON SCHEDULE<br />
• Full production expected to commence in<br />
the second half of 2013<br />
Surface Infrastructure<br />
• Underground development progressed<br />
ahead of plan<br />
• Surface infrastructure continues to progress<br />
on schedule<br />
• Expansion of the Kupol mill capacity to<br />
4,500 tpd is well underway<br />
Underground Development<br />
• Final completion expected to take place<br />
in Q3 2013<br />
www.kinross.com<br />
24 24
ENCOURAGING EXPLORATION RESULTS<br />
TASIAST DISTRICT EXPLORATION (6) Fennec<br />
• Drilling at step-out targets confirm presence of<br />
narrow, high-grade veins at C67, Fennec and C68<br />
C68 WEST<br />
• Drilling completed along 600 strike metres, testing<br />
the structure to an average depth of 100 metres<br />
below surface<br />
C67<br />
C68W<br />
C68E<br />
• Further step-out and infill drilling underway to<br />
examine vein continuity and assess mineral<br />
resource potential<br />
TASIAST<br />
www.kinross.com<br />
(6) Refer to endnote #6.<br />
25 25
ENCOURAGING EXPLORATION RESULTS<br />
KUPOL-WEST MOROSHKA (6)<br />
• Additional high-grade mineralization<br />
discovered at the Moroshka target<br />
located 5 km southeast of Kupol<br />
Kupol<br />
Moroshka trend<br />
(geochemistry)<br />
• Presence of high-grade mineralization<br />
over a strike length of 300 metres and<br />
a vertical range of 150 metres<br />
Moroshka<br />
vein<br />
• Similar geology to Kupol<br />
North<br />
• Encouraged by the potential to<br />
discover additional vein shoots along<br />
the Moroshka trend<br />
www.kinross.com<br />
(6) Refer to endnote #6.<br />
26 26
TAKING RESPONSIBILITY<br />
MAINTAINING OUR SOCIAL LICENSE TO OPERATE<br />
• Member of the Dow Jones Sustainability World Index<br />
• Member of the Jantzi Social Index<br />
• Listed among Canada’s top corporate citizens by both Maclean’s<br />
and Corporate Knights<br />
www.kinross.com<br />
27<br />
27
CONSISTENCY & DISCIPLINE<br />
ACTION PLAN FOR BUILDING VALUE<br />
• Operational fundamentals<br />
• Aggressive focus on cost management<br />
• Maximizing margin & free cash flow<br />
• Disciplined project development<br />
• Maintaining a strong balance sheet<br />
www.kinross.com<br />
28<br />
28
APPENDIX<br />
www.kinross.com<br />
29 29
APPENDIX<br />
ALL-IN SUSTAINING COSTS – Q1 2013<br />
$1,135<br />
$1,115<br />
$1,038<br />
$919<br />
$856<br />
$ per ounce<br />
<strong>Gold</strong>corp Newmont <strong>Kinross</strong> Barrick Yamana<br />
www.kinross.com<br />
Source: Company reports. For more information regarding <strong>Kinross</strong>’ all-in sustaining costs, please refer to endnote #5.<br />
30 30
APPENDIX<br />
RELATIVE VALUATION<br />
ENTERPRISE VALUE / 2013E EBITDA<br />
PRICE / NAV<br />
10.4<br />
1.37<br />
1.27 1.25 1.21<br />
1.00 0.95<br />
0.75<br />
8.2<br />
7.5<br />
6.9<br />
5.1<br />
4.2<br />
3.8<br />
GG AEM EGO AUY NEM ABX KGC<br />
AEM AUY GG NEM EGO ABX KGC<br />
www.kinross.com<br />
Source: Bank of America Merrill Lynch North America Precious Metals Weekly – May 10, 2013.<br />
31 31
UNITED STATES<br />
FORT KNOX, ALASKA (100%)<br />
• Production commenced in 1997<br />
• Heap leach production commenced in late 2009<br />
OPERATING RESULTS<br />
PRODUCTION<br />
(Au eq. oz.)<br />
PRODUCTION COST<br />
OF SALES ($/oz.) (4)<br />
FY 2012 359,948 $663<br />
FY 2011 289,794 $692<br />
2012 GOLD RESERVES AND RESOURCES (1)<br />
TONNES<br />
(thousands)<br />
GRADE<br />
(g/t)<br />
OUNCES<br />
(thousands)<br />
2P Reserves 237,745 0.47 3,609<br />
M&I Resources 99,824 0.43 1,375<br />
Inferred Resources 14,953 0.50 239<br />
www.kinross.com<br />
(1) Please refer to endnote #1.<br />
(4) Please refer to endnote #4.<br />
32 32
UNITED STATES<br />
ROUND MOUNTAIN (50%)<br />
• <strong>Kinross</strong>-operated JV with Barrick<br />
• Bulk tonnage open-pit operation<br />
• Commercial production began in 1977<br />
OPERATING RESULTS<br />
PRODUCTION<br />
(Au eq. oz.)<br />
PRODUCTION COST<br />
OF SALES ($/oz.) (4)<br />
FY 2012 192,330 $717<br />
FY 2011 187,444 $697<br />
2012 GOLD RESERVES AND RESOURCES (1)<br />
TONNES<br />
(thousands)<br />
GRADE<br />
(g/t)<br />
OUNCES<br />
(thousands)<br />
2P Reserves 64,123 0.60 1,242<br />
M&I Resources 40,182 0.72 925<br />
Inferred Resources 19,375 0.50 310<br />
www.kinross.com<br />
(1) Please refer to endnote #1.<br />
(4) Please refer to endnote #4.<br />
33 33
UNITED STATES<br />
KETTLE RIVER – BUCKHORN (100%)<br />
• Entered production in Q4 2008<br />
• Small foot-print, underground mine<br />
• Near-mine exploration targets<br />
OPERATING RESULTS<br />
PRODUCTION<br />
(Au eq. oz.)<br />
PRODUCTION COST<br />
OF SALES ($/oz.) (4)<br />
FY 2012 156,093 $482<br />
FY 2011 175,292 $420<br />
2012 GOLD RESERVES AND RESOURCES (1)<br />
TONNES<br />
(thousands)<br />
GRADE<br />
(g/t)<br />
OUNCES<br />
(thousands)<br />
2P Reserves 813 10.18 266<br />
M&I Resources 61 11.73 23<br />
Inferred Resources 85 9.97 27<br />
www.kinross.com<br />
(1) Please refer to endnote #1.<br />
(4) Please refer to endnote #4.<br />
34 34
RUSSIA<br />
KUPOL (100%)<br />
• Completed transaction increasing ownership to<br />
100% from 75% on April 27, 2011<br />
• High-grade underground mine with 3,500 tpd<br />
mill<br />
OPERATING RESULTS<br />
PRODUCTION<br />
(Au eq. oz.)<br />
PRODUCTION COST<br />
OF SALES ($/oz.) (4)<br />
FY 2012 578,252 $472<br />
FY 2011 587,048 $378<br />
<strong>Kinross</strong> increased its ownership in the Kupol mine to 100% on April 27, 2011. As a result, the results<br />
up to April 27, 2011 reflect 75% ownership, and results thereafter reflect 100% ownership.<br />
2012 GOLD RESERVES AND RESOURCES (1)<br />
TONNES<br />
(thousands)<br />
GRADE<br />
(g/t)<br />
OUNCES<br />
(thousands)<br />
2P Reserves 8,092 9.29 2,416<br />
M&I Resources - - -<br />
Inferred Resources 482 14.94 231<br />
www.kinross.com<br />
(1) Please refer to endnote #1.<br />
(4) Please refer to endnote #4.<br />
35 35
BRAZIL<br />
PARACATU (100%)<br />
• Plant 2 expansions now complete:<br />
• 3 rd ball mill commissioned in Q2 2011<br />
• 4 th ball mill commissioned in Q3 2012<br />
OPERATING RESULTS<br />
PRODUCTION<br />
(Au eq. oz.)<br />
PRODUCTION COST<br />
OF SALES ($/oz.) (4)<br />
FY 2012 466,709 $881<br />
FY 2011 453,396 $720<br />
2012 GOLD RESERVES AND RESOURCES (1)<br />
TONNES<br />
(thousands)<br />
GRADE<br />
(g/t)<br />
OUNCES<br />
(thousands)<br />
2P Reserves 1,387,842 0.40 17,978<br />
M&I Resources 395,756 0.32 4,040<br />
Inferred Resources 216,393 0.39 2,713<br />
www.kinross.com<br />
(1) Please refer to endnote #1.<br />
(2) Please refer to endnote #4.<br />
36 36
CHILE<br />
LA COIPA (100%)<br />
• Expect to suspend mining of the existing<br />
orebody in the second half of 2013<br />
• Continuing to assess the remaining reserves,<br />
resources and exploration potential<br />
• Including the future potential of La Coipa<br />
Phase 7 (Pompeya)<br />
OPERATING RESULTS<br />
PRODUCTION<br />
(Au eq. oz.)<br />
PRODUCTION COST<br />
OF SALES ($/oz.) (4)<br />
FY 2012 178,867 $966<br />
FY 2011 178,287 $762<br />
2012 GOLD RESERVES AND RESOURCES (1)<br />
TONNES<br />
(thousands)<br />
GRADE<br />
(g/t)<br />
OUNCES<br />
(thousands)<br />
2P Reserves 8,573 1.52 418<br />
M&I Resources 9,217 1.17 348<br />
Inferred Resources 2,676 3.31 285<br />
www.kinross.com<br />
(1) Please refer to endnote #1.<br />
(4) Please refer to endnote #4.<br />
37 37
CHILE<br />
MARICUNGA (100%)<br />
• Located in the highly prospective Maricunga<br />
District<br />
• High-altitude heap leach operation<br />
OPERATING RESULTS<br />
PRODUCTION<br />
(Au eq. oz.)<br />
PRODUCTION COST<br />
OF SALES ($/oz.) (4)<br />
FY 2012 236,369 $779<br />
FY 2011 236,249 $457<br />
2012 GOLD RESERVES AND RESOURCES (1)<br />
TONNES<br />
(thousands)<br />
GRADE<br />
(g/t)<br />
OUNCES<br />
(thousands)<br />
2P Reserves 185,584 0.72 4,313<br />
M&I Resources 141,395 0.64 2,907<br />
Inferred Resources 55,478 0.50 889<br />
www.kinross.com<br />
(1) Please refer to endnote #1.<br />
(4) Please refer to endnote #4.<br />
38 38
MAURITANIA<br />
TASIAST (100%)<br />
• Open-pit mine ~300 km north of the city of<br />
Nouakchott<br />
• Remote, flat, sparsely populated desert<br />
OPERATING RESULTS<br />
PRODUCTION<br />
(Au eq. oz.)<br />
PRODUCTION COST<br />
OF SALES ($/oz.) (4)<br />
FY 2012 185,334 $889<br />
FY 2011 200,619 $702<br />
2012 GOLD RESERVES AND RESOURCES (1)<br />
TONNES<br />
(thousands)<br />
GRADE<br />
(g/t)<br />
OUNCES<br />
(thousands)<br />
2P Reserves 149,651 1.66 7,965<br />
M&I Resources 226,094 0.93 6,757<br />
Inferred Resources 31,235 0.79 790<br />
www.kinross.com<br />
(1) Please refer to endnote #1.<br />
(4) Please refer to endnote #4.<br />
39 39
GHANA<br />
CHIRANO (90%)<br />
• 90% owned by <strong>Kinross</strong>; Government of Ghana<br />
holds a 10% carried interest<br />
• 9 open-pits and 2 recently-discovered<br />
underground deposits<br />
• Achieved first gold pour in 2005<br />
OPERATING RESULTS (2)<br />
PRODUCTION<br />
(Au eq. oz.)<br />
PRODUCTION COST<br />
OF SALES ($/oz.) (4)<br />
FY 2012 263,911 $721<br />
FY 2011 235,661 $693<br />
2012 GOLD RESERVES AND RESOURCES (1)<br />
TONNES<br />
(thousands)<br />
GRADE<br />
(g/t)<br />
OUNCES<br />
(thousands)<br />
2P Reserves 20,217 2.65 1,722<br />
M&I Resources 7,036 1.76 398<br />
Inferred Resources 4,624 1.97 293<br />
www.kinross.com<br />
(1) Please refer to endnote #1.<br />
(2) Please refer to endnote #2.<br />
(4) Please refer to endnote #4.<br />
40 40
ENDNOTES<br />
1) For more information regarding <strong>Kinross</strong>’ mineral reserve and mineral resources estimates please refer to our Annual<br />
Mineral Reserve and Mineral Resource Statement as at December 31, 2012 contained in our news release dated<br />
February 13, 2013, which is available on our website at www.kinross.com.<br />
2) Unless otherwise noted, gold equivalent production, gold equivalent ounces sold and production cost of sales<br />
figures in this presentation are based on <strong>Kinross</strong>’ 90% share of Chirano production and do not include production<br />
from Crixas, due to the sale of <strong>Kinross</strong>’ 50% ownership completed June 28, 2012.<br />
3) For more information regarding <strong>Kinross</strong>’ production, cost and capital expenditures outlook for 2013, please refer to<br />
the news release dated February 13, 2013, available on our website at www.kinross.com.<br />
4) Production cost of sales per gold equivalent ounce from continuing operations is a non-GAAP measure defined as<br />
attributable production cost of sales divided by the attributable number of gold equivalent ounces sold. Production<br />
cost of sales is equivalent to total production cost of sales per the financial statements less depreciation, depletion<br />
and amortization and impairment charges. For more information about this non-GAAP measure, and a<br />
reconciliation of this non-GAAP financial measure for the year ended December 31, 2012, please refer to the news<br />
release dated February 13, 2012, and for the three months ended March 31, 2013, please refer to the news release<br />
dated May 7, 2013, under the heading “Reconciliation of non-GAAP financial measures”, both of which are available<br />
on our website at www.kinross.com.<br />
5) All-in sustaining cost per ounce is defined as the sum of: production cost of sales; net of silver by-product credits;<br />
general & administrative expenses; sustaining business development and exploration costs; sustaining capital<br />
(including related capitalized interest); and a portion of other operating costs. For more information, please refer to<br />
the news release dated February 13, 2013, available on our website at www.kinross.com.<br />
6) For more information relating to <strong>Kinross</strong>’ exploration and for a link to the appendix of drill results relating to Tasiast<br />
and Kupol, please refer to the news release dated February 13, 2013, available on our website at www.kinross.com.<br />
www.kinross.com<br />
41 41
KINROSS GOLD CORPORATION<br />
25 York Street, 17 th Floor │Toronto, ON │ M5J 2V5<br />
www.kinross.com<br />
www.kinross.com<br />
42 42