(1985). Levine's Atlas of Corporate Interlocks. Connections ... - INSNA
(1985). Levine's Atlas of Corporate Interlocks. Connections ... - INSNA
(1985). Levine's Atlas of Corporate Interlocks. Connections ... - INSNA

Create successful ePaper yourself
Turn your PDF publications into a flip-book with our unique Google optimized e-Paper software.
I<br />
I<br />
I<br />
I<br />
I<br />
1 0 3<br />
Moon-shifting the ten points for the corporations<br />
results in the somewhat changed map in Figure 7 . The corporations<br />
ore now centered with respect to their directors<br />
but the directors are not yet centered with respect<br />
to the corporations . Mean-shifting the fifteen points for<br />
the directors corrects this problem . But now, unfortunately,<br />
the problem Is reversed . American Airlines is<br />
properly centered with respect to the previous locutions<br />
<strong>of</strong> John Leitch and William Beers, but they themselves<br />
hove been moved to their own centered positions .<br />
Still this is not the solution, although the configuration<br />
is relatively clear . It can be proven that by<br />
simply repeating this procedure, one map after another,<br />
again and again, the maps converge to a "stabile" map .I3)<br />
It is stabile in the sense that if it is subjected to<br />
any more averaging (any more movement <strong>of</strong> the corporations<br />
and directors), nothing happens : The map gets "smaller"<br />
(the outer points, and therefore all other points, keep<br />
moving toward the center) but the relative locations<br />
stay constant . This is the centroid solution .<br />
Computing moons once again produces a third set <strong>of</strong><br />
locations, now twice-removed from the original drawing .<br />
Repeating this process . again and again, gets closer to o<br />
solution . Continuing for ten steps, ten steps removed<br />
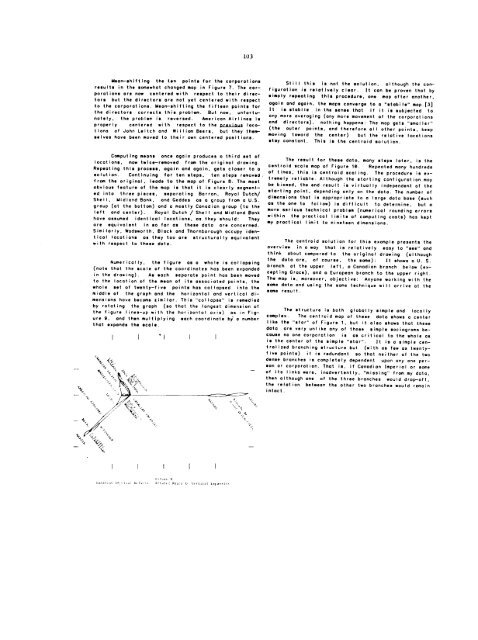
from the original, leads to the map <strong>of</strong> Figure 8 . The most<br />
obvious feature <strong>of</strong> the map is that it is clearly segmented<br />
into three pieces, separating Barron, Royal Dutch/<br />
Shell . Midland Bank, and Geddes as a group from a U .S .<br />
group (at the bottom) and a mostly Canadian group (to the<br />
left and center) . Royal Dutch / Shell and Midland Son k<br />
have assumed identical locations, as they should : They<br />
are equivalent in so for as these data ore concerned .<br />
Similarly, Wadsworth, Block and Thornborough occupy identical<br />
locations am they too ore structurally equivalent<br />
with respect to these data .<br />
Numerically, the figure as a whole is collapsing<br />
(note that the scale <strong>of</strong> the coordinates has been expanded<br />
in the drawing) . As each separate point has been moved<br />
to the location <strong>of</strong> the mean <strong>of</strong> its associated points, the<br />
whole set <strong>of</strong> twenty-five points has collapsed into the<br />
middle <strong>of</strong> the graph and the horizontal and vertical dimensions<br />
hove become similar . This "collapse" is remedied<br />
by rotating the graph (so that the longest dimension <strong>of</strong><br />
the figure lines-up with the horizontal axis) as in Figure<br />
9, and then multiplying each coordinate by% a number<br />
that expands the scale .<br />
The result for these data, many steps later, is the<br />
centroid scale map <strong>of</strong> Figure 10 . Repeated many hundreds<br />
<strong>of</strong> times, this is centroid scaling . The procedure is extremely<br />
reliable . Although the starting configuration may<br />
be biased . the end result is virtually independent <strong>of</strong> the<br />
starting point, depending only on the data . The number <strong>of</strong><br />
dimensions that is appropriate to a large data base (such<br />
as the one to follow) is difficult to determine, but a<br />
more serious technical problem (numerical rounding errors<br />
within the practical limits <strong>of</strong> computing costs) has kept<br />
my practical limit to nineteen dimensions .<br />
The centroid solution for this example presents the<br />
overview in a way that is relatively easy to "see" and<br />
think about compared to the original drawing (although<br />
the data are, <strong>of</strong> course, the some) : It shows a U . S .<br />
branch at the upper left, a Canadian branch below (excepting<br />
Grace), and a European branch to the upper right .<br />
The mop is, moreover, objective : Anyone working with the<br />
same data and using the some technique will arrive at the<br />
same result .<br />
The structure is both globally simple and locally<br />
complex . The centroid mop <strong>of</strong> these data shows a center<br />
like the "star" <strong>of</strong> Figure 1, but it also shows that these<br />
data are very unlike any <strong>of</strong> those simple sociogroms because<br />
no one corporation is as critical to the whole as<br />
is the center <strong>of</strong> the simple "star" . It is a simple centralized<br />
branching structure but (with as few as twentyfive<br />
points) it is redundant so that neither <strong>of</strong> the two<br />
dense branches is completely dependent upon any one person<br />
or corporation . That is, if Canadian Imperial or some<br />
<strong>of</strong> its links were, inadvertently, "missing" from my data,<br />
then although one <strong>of</strong> the three branches would drop-<strong>of</strong>f,<br />
the relation between the other two branches would remain<br />
intact .