(1985). Levine's Atlas of Corporate Interlocks. Connections ... - INSNA
(1985). Levine's Atlas of Corporate Interlocks. Connections ... - INSNA
(1985). Levine's Atlas of Corporate Interlocks. Connections ... - INSNA

Create successful ePaper yourself
Turn your PDF publications into a flip-book with our unique Google optimized e-Paper software.
1 1 7<br />
M = 1 .0 - (g s /c s )/(g d/c d )<br />
where :<br />
g is the sum <strong>of</strong> all links<br />
density in the matrix .<br />
c is the sum <strong>of</strong> the cells contained in all sparse blocks .<br />
s<br />
gd is the sum <strong>of</strong> all links in blocks <strong>of</strong> density higher than the overall<br />
density .<br />
c d is the sum <strong>of</strong> all cells in dense blocks .<br />
in blocks <strong>of</strong> density less than the over-all<br />
If the density <strong>of</strong> all blocks is the same throughout the matrix then<br />
the ratio <strong>of</strong> the mean density <strong>of</strong> sparse blocks to the mean density <strong>of</strong> the<br />
dense blocks would be 1 .0 and the value <strong>of</strong> M would be 0 .0 indicating no blocking<br />
. On the other hand, if the mean density <strong>of</strong> the sparse blocks is exactly<br />
zero, then the value <strong>of</strong> M would be 1 .0 indicating optimal blocking .<br />
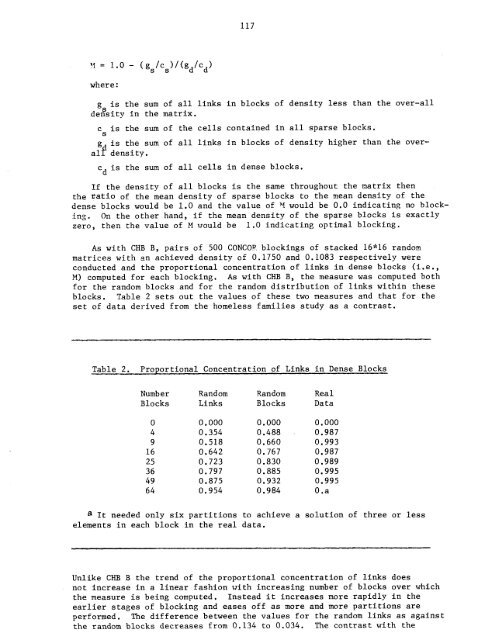
As with CHB B, pairs <strong>of</strong> 500 CONCORR blockings <strong>of</strong> stacked 16*16 random<br />
matrices with an achieved density <strong>of</strong> 0 .1750 and 0 .1083 respectively were<br />
conducted and the proportional concentration <strong>of</strong> links in dense blocks (i .e .,<br />
M) computed for each blocking . As with CHB B, the measure was computed both<br />
for the random blocks and for the random distribution <strong>of</strong> links within these<br />
blocks . Table 2 sets out the values <strong>of</strong> these two measures and that for the<br />
set <strong>of</strong> data derived from the homeless families study as a contrast .<br />
Table 2 . Proportional Concentration <strong>of</strong> Links in Dense Blocks<br />
Number<br />
Blocks<br />
Random<br />
Links<br />
Random<br />
Blocks<br />
Real<br />
Data<br />
0 0 .000 0 .000 0 .000<br />
4 0 .354 0 .488 0 .987<br />
9 0 .518 0 .660 0 .993<br />
16 0 .642 0 .767 0 .987<br />
25 0 .723 0 .830 0 .989<br />
36 0 .797 0 .885 0 .995<br />
49 0 .875 0 .932 0 .995<br />
64 0 .954 0 .984 O .a<br />
a It needed only six partitions to achieve a solution <strong>of</strong> three or less<br />
elements in each block in the real data .<br />
Unlike CHB B the trend <strong>of</strong> the proportional concentration <strong>of</strong> links does<br />
not increase in a linear fashion with increasing number <strong>of</strong> blocks over which<br />
the measure is being computed . Instead it increases more rapidly in the<br />
earlier stages <strong>of</strong> blocking and eases <strong>of</strong>f as more and more partitions are<br />
performed . The difference between the values for the random links as against<br />
the random blocks decreases from 0 .134 to 0 .034 . The contrast with the