2011 Annual Report & Financial Statements - Kengen
2011 Annual Report & Financial Statements - Kengen
2011 Annual Report & Financial Statements - Kengen

Create successful ePaper yourself
Turn your PDF publications into a flip-book with our unique Google optimized e-Paper software.
Executive Performance Overview<br />
Executive Performance Overview<br />
KenGen<br />
KenGen<br />
14<br />
<strong>2011</strong> ANNUAL REPORT & FINANCIAL STATEMENTS<br />
(Continued)<br />
<strong>2011</strong> ANNUAL REPORT & FINANCIAL STATEMENTS<br />
15<br />
1. Operating & Business <strong>Report</strong><br />
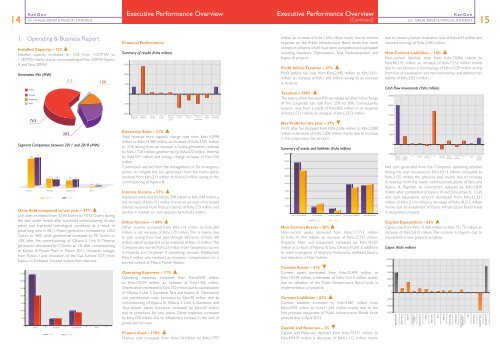
Installed Capacity – 12%<br />
Installed capacity increased by 12% from 1,057MW to<br />
1,181MW mainly due to commissioning of the 120MW Kipevu<br />
III and Tana 20MW.<br />
Generation Mix (MW)<br />
Hydro’s<br />
Thermals<br />
Geothermal<br />
Wind<br />
<strong>2011</strong><br />
763<br />
262<br />
5.5 150<br />
Segment Comparison between <strong>2011</strong> and 2010 (MW)<br />
763<br />
761<br />
262<br />
140<br />
Hydro’s Thermals Geothermal Wind<br />
<strong>2011</strong> 2010<br />
150 150<br />
5.5 5.5<br />
Units Sold compared to last year – 37%<br />
Unit sales increased from 3,596 Gwhrs to 4,933 Gwhrs during<br />
the year under review after successful commissioning of new<br />
plants and improved hydrological conditions as a result of<br />
good long rains in <strong>2011</strong>. Hydro generation increased by 1,252<br />
Gwhrs or 58%, while geothermal increased by 90 Gwhrs or<br />
10% after the commissioning of Olkaria II Unit III. Thermal<br />
generation decreased by 7 Gwhrs or 1% after commissioning<br />
of Kipevu III Power Plant in March <strong>2011</strong>. However outages<br />
from Kipevu I and relocation of the Gas Turbine (GT) from<br />
Kipevu to Embakasi reduced output from thermal.<br />
3500<br />
3000<br />
2500<br />
2000<br />
1500<br />
1000<br />
500<br />
0<br />
Hydro’s Thermals Geothermal Wind<br />
<strong>2011</strong> 2010<br />
<strong>Financial</strong> Performance<br />
Summary of results (Kshs million)<br />
15000<br />
10000<br />
5000<br />
0<br />
-5000<br />
-10000<br />
2010 profit<br />
before Tax<br />
Electricity<br />
Revenue<br />
Interest<br />
Income<br />
Other<br />
Income<br />
Realised<br />
gains &<br />
loses<br />
Operating<br />
Costs<br />
Manpower<br />
Costs<br />
Depreciation<br />
&<br />
Amortisation<br />
Finace<br />
Costs<br />
<strong>2011</strong> profit<br />
before Tax<br />
Electricity Sales – 31%<br />
Total revenue from capacity charge rose from Kshs.10,998<br />
million to Kshs.14,389 million, an increase of Kshs.3,391 million<br />
or 31%, arising from an increase in hydro-generation revenue<br />
by Kshs.1,728 million, geothermal by Kshs.672 million, thermal<br />
by Kshs.597 million and energy charge increase of Kshs.343<br />
million.<br />
Commission earned from the management of the emergency<br />
power to mitigate the low generation from the hydro plants<br />
declined from Kshs.211 million to Kshs.63 million owing to the<br />
commissioning of Kipevu III.<br />
Interest Income – 57%<br />
Interest income rose from Kshs.398 million to Kshs.549 million, a<br />
net increase of Kshs.151 million mainly on account of increased<br />
interest received from Treasury bonds of Kshs.273 million and<br />
decline in interest on cash deposits by Kshs.83 million.<br />
Other Income – 149%<br />
Other income increased from Kshs.114 million to Kshs.284<br />
million, a net increase of Kshs.170 million. This is mainly due<br />
to gain arising from fuel pass-through efficiency of Kshs.189<br />
million, sale of sludge and scrap materials of Kshs.15 million. The<br />
Company also earned Kshs.23 million from Geophysics survey<br />
in Rwanda and Orpower 4 cementing services. Additionally<br />
Kshs.3 million was received as insurance compensation for a<br />
burned turbine at Mesco Power Station.<br />
Operating Expenses – 17%<br />
Operating expenses increased from Kshs.8,558 million<br />
to Kshs.10,014 million, an increase of Kshs.1456 million.<br />
Depreciation increased by Kshs.752 million due to capitalization<br />
of Olkaria II Unit 3, Kiambere, Tana and Kipevu III. Operations<br />
and maintenance costs increased by Kshs.90 million due to<br />
commissioning of Kipevu III, Olkaria II Unit 3, Kiambere, and<br />
Tana power plants. Insurance increased by Kshs.69 million<br />
due to premiums for new plants. Other expenses increased<br />
by Kshs.108 million due to inflationary increase in the cost of<br />
goods and services.<br />
Finance Cost – 170%<br />
Finance cost increased from Kshs.741million to Kshs.1,997<br />
million, an increase of Kshs.1,256 million mainly due to interest<br />
expense on the Public Infrastructure Bond funds that were<br />
utilized on projects which have been completed and capitalized<br />
including Kiambere Optimization, Tana Redevelopment and<br />
Kipevu III projects.<br />
Profit before Taxation – 47%<br />
Profit before tax rose from Kshs.2,485 million to Kshs.3,651<br />
million, an increase of Ksh.1,166 million, owing to an increase<br />
in revenue.<br />
Taxation – 296%<br />
The expiry of the five-year IPO tax rebate resulted in the change<br />
of the corporate tax rate from 25% to 30%. Consequently,<br />
taxation rose from a credit of Kshs.802 million to an expense<br />
of Kshs.1,571 million, an increase of Kshs.2,373 million.<br />
Net Profit for the year – 37%<br />
Profit after tax dropped from Kshs.3,286 million to Kshs.2,080<br />
million, a decrease of Kshs.1,206 million mainly due to increase<br />
in the corporation tax amount.<br />
Summary of assets and liabilities (Kshs million)<br />
160000<br />
140000<br />
120000<br />
100000<br />
80000<br />
60000<br />
40000<br />
20000<br />
0<br />
Non Current Assets Current Assets Current Liabilities Non Current Liabilities Capital & Reserves<br />
<strong>2011</strong> 2010<br />
Non Current Assets – 20%<br />
Non-current assets increased from Kshs.117,717 million<br />
to Kshs.141,454 million, an increase of Kshs.23,737 million.<br />
Property, Plant and Equipment increased by Kshs.14,555<br />
million as a result of Kipevu III, Tana, Olkaria II Unit 3, additions<br />
to work-in-progress of Sang’oro, Kindaruma, wellhead, Eburru<br />
and relocation of Gas Turbine.<br />
Current Assets – 41%<br />
Current assets decreased from Kshs.32,849 million to<br />
Kshs.19,539 million, a decrease of Kshs.13,310 million mainly<br />
due to utilisation of the Public Infrastructure Bond funds in<br />
implementation of projects.<br />
Current Liabilities – 62%<br />
Current liabilities increased by Kshs.4,287 million from<br />
Kshs.6,969 million to Kshs.11,256 million mainly due to the<br />
first principal repayment of Public Infrastructure Bonds funds<br />
amount due in April 2012.<br />
Capital and Reserves – 2%<br />
Capital and Reserves declined from Kshs.70,531 million to<br />
Kshs.69.419 million, a decrease of Kshs.1,112 million mainly<br />
due to treasury bonds revaluation loss of Kshs.633 million and<br />
retained earnings of Kshs.2,080 million.<br />
Non Current Liabilities – 10%<br />
Non-current liabilities rose from Kshs.73,066 million to<br />
Kshs.80,318 million, an increase of Kshs.7,252 million mainly<br />
due to net increase in borrowings of Kshs.4,529 million arising<br />
from loss on revaluation and new borrowings and deferred tax<br />
liability of Kshs.3,031 million.<br />
Cash Flow movements (Kshs million)<br />
25000<br />
20000<br />
15000<br />
10000<br />
5000<br />
0<br />
-5000<br />
30 June<br />
2010 Cash<br />
& Cash<br />
equivalents<br />
Cash<br />
Generated<br />
from<br />
Operations<br />
Tax Paid<br />
Investment<br />
Income<br />
Interest<br />
Repayment<br />
Capex<br />
Investment<br />
in Securities<br />
Redemption<br />
of<br />
Securities<br />
Repayment<br />
of<br />
Borrowings<br />
New Loans<br />
Dividends<br />
Paid<br />
30 June<br />
<strong>2011</strong> Cash<br />
& Cash<br />
equivalents<br />
Net cash generated from the Company’s operating activities<br />
during the year increased to Kshs.4,513 million compared to<br />
Kshs.2,125 million the previous year, mainly due to increase<br />
in revenue from the newly commissioned plants of Tana and<br />
Kipevu III. Payment to contractors reduced by Kshs.5,810<br />
million after completion of Kipevu III and Tana projects. Cash<br />
and cash equivalents amount decreased from Kshs.21,331<br />
million to Kshs.3,116 million, a decrease of Kshs.18,215 million<br />
mainly due to investment of Public Infrastructure Bond funds<br />
in designated projects.<br />
Capital Expenditure - 43%<br />
Capex rose from Kshs.13,360 million to Kshs.19,170 million, an<br />
increase of Kshs.5,810 million. The increase is majorly due to<br />
investment in new projects as below:<br />
Capex (Kshs million)<br />
25000<br />
20000<br />
15000<br />
10000<br />
5000<br />
0<br />
-5000<br />
-10000<br />
-15000<br />
2010 Balance B/F<br />
Olkaria II Unit 3<br />
Kipevu III<br />
Redevelopment<br />
of Tana<br />
Kindaruma Unit 3<br />
Sangoro<br />
Olkaria I & IV<br />
Eburu<br />
Wellhead<br />
Purchase of Rigs<br />
GT Relocation<br />
Geotherm Resource<br />
Development<br />
Coal<br />
Other Projects<br />
Capitalised Projects<br />
<strong>2011</strong> Balance C/F