2011 Annual Report & Financial Statements - Kengen
2011 Annual Report & Financial Statements - Kengen
2011 Annual Report & Financial Statements - Kengen

Create successful ePaper yourself
Turn your PDF publications into a flip-book with our unique Google optimized e-Paper software.
Notes to the <strong>Financial</strong> <strong>Statements</strong>(Continued)<br />
Notes to the <strong>Financial</strong> <strong>Statements</strong>(Continued)<br />
KenGen<br />
KenGen<br />
66<br />
<strong>2011</strong> ANNUAL REPORT & FINANCIAL STATEMENTS For The Year Ended 30 June <strong>2011</strong><br />
For The Year Ended 30 June <strong>2011</strong> <strong>2011</strong> ANNUAL REPORT & FINANCIAL STATEMENTS<br />
67<br />
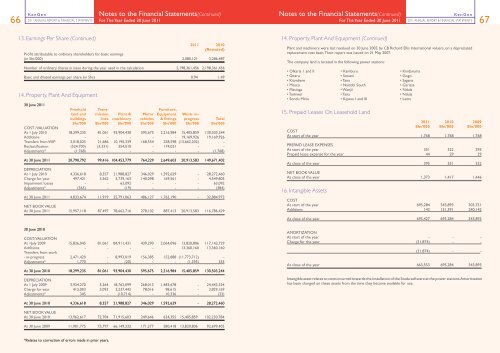
13. Earnings Per Share (Continued) 14. Property, Plant And Equipment (Continued)<br />
<strong>2011</strong> 2010<br />
(Restated)<br />
Profit attributable to ordinary shareholders for basic earnings<br />
(in Shs’000) 2,080,121 3,286,487<br />
Number of ordinary shares in issue during the year used in the calculation 2,198,361,456 2,198,361,456<br />
Basic and diluted earnings per share (in Shs) 0.94 1.49<br />
14. Property, Plant And Equipment<br />
30 June <strong>2011</strong><br />
Freehold Trans- Furniture,<br />
land and mission Plant & Motor Equipment Work- inbuildings<br />
lines machinery vehicles & fittings progress Total<br />
Shs’000 Shs’000 Shs’000 Shs’000 Shs’000 Shs’000 Shs’000<br />
COST /VALUATION<br />
At 1 July 2010 18,299,235 81,061 93,904,430 595,675 2,216,984 15,405,859 130,503,244<br />
Additions - - - - - 19,169,926 19,169,926<br />
Transfers from WIP 3,018,025 21,686 10,195,339 168,554 258,598 (13,662,202) -<br />
Reclassification (524,700) (3,331) 354,010 - 174,021 - -<br />
Adjustments* (1,768) - - - - - (1,768)<br />
At 30 June <strong>2011</strong> 20,790,792 99,416 104,453,779 764,229 2,649,603 20,913,583 149,671,402<br />
DEPRECIATION<br />
At 1 July 2010 4,336,618 8,357 21,988,827 346,029 1,592,629 - 28,272,460<br />
Charge for year 497,421 3,562 3,739,163 140,098 169,561 - 4,549,805<br />
Impairment losses - - 63,092 - - - 63,092<br />
Adjustments* (365) - (19) - - - (384)<br />
At 30 June <strong>2011</strong> 4,833,674 11,919 25,791,063 486,127 1,762,190 - 32,884,973<br />
NET BOOK VALUE<br />
At 30 June <strong>2011</strong> 15,957,118 87,497 78,662,716 278,102 887,413 20,913,583 116,786,429<br />
Plant and machinery were last revalued on 30 June 2005, by CB Richard Ellis International valuers, on a depreciated<br />
replacement cost basis. Their report was issued on 21 May 2007.<br />
The company land is located in the following power stations:<br />
• Olkaria 1 and II • Kamburu • Kindaruma<br />
• Gitaru • Sosiani • Gogo<br />
• Kiambere • Tana • Sagana<br />
• Mesco • Nairobi South • Garissa<br />
• Masinga • Wanjii • Ndula<br />
• Turkwel • Tana • Ndula<br />
• Sondu Miriu • Kipevu I and III • Lamu<br />
15. Prepaid Leases On Leasehold Land<br />
<strong>2011</strong> 2010 2009<br />
Shs’000 Shs’000 Shs’000<br />
COST<br />
At start of the year 1,768 1,768 1,768<br />
PREPAID LEASE EXPENSES<br />
At start of the year 351 322 293<br />
Prepaid lease expense for the year 44 29 29<br />
At close of the year 395 351 322<br />
NET BOOK VALUE<br />
At close of the year 1,373 1,417 1,446<br />
16. Intangible Assets<br />
COST<br />
At start of the year 695,284 543,893 303,751<br />
Additions 143 151,391 240,142<br />
At close of the year 695,427 695,284 543,893<br />
30 June 2010<br />
COST/VALUATION<br />
At 1July 2009 15,826,045 81,061 84,911,431 439,290 2,064,096 13,820,806 117,142,729<br />
Additions - - - - 13,360,160 13,360,160<br />
Transfers from work<br />
- in-progress 2,471,420 - 8,993,019 156,385 152,888 (11,773,712) -<br />
Adjustments* 1,770 - (20) - - (1,395) 355<br />
At 30 June 2010 18,299,235 81,061 93,904,430 595,675 2,216,984 15,405,859 130,503,244<br />
DEPRECIATION<br />
At 1 July 2009 3,924,270 5,264 18,762,099 268,013 1,483,678 - 24,443,324<br />
Charge for year 412,003 3,093 3,237,442 78,016 98,615 - 3,829,169<br />
Adjustments* 345 - (10,714) - 10,336 - (33)<br />
AMORTIZATION<br />
At start of the year - - -<br />
Charge for the year (31,874) - -<br />
(31,874) - -<br />
At close of the year 663,553 695,284 543,893<br />
Intangible asset relates to costs incurred towards the installation of the Scada software at the power stations. Amortisation<br />
has been charged on these assets from the time they became available for use.<br />
At 30 June 2010 4,336,618 8,357 21,988,827 346,029 1,592,629 - 28,272,460<br />
NET BOOK VALUE<br />
At 30 June 2010 13,962,617 72,704 71,915,603 249,646 624,355 15,405,859 102,230,784<br />
At 30 June 2009 11,901,775 75,797 66,149,332 171,277 580,418 13,820,806 92,699,405<br />
*Relates to correction of errors made in prior years.