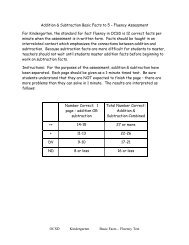
OCSD 3rd Grade Math Assessment 3.5
OCSD 3rd Grade Math Assessment 3.5
OCSD 3rd Grade Math Assessment 3.5

Create successful ePaper yourself
Turn your PDF publications into a flip-book with our unique Google optimized e-Paper software.
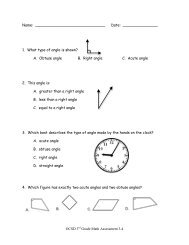
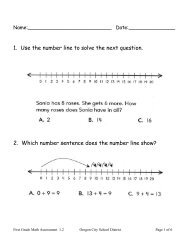
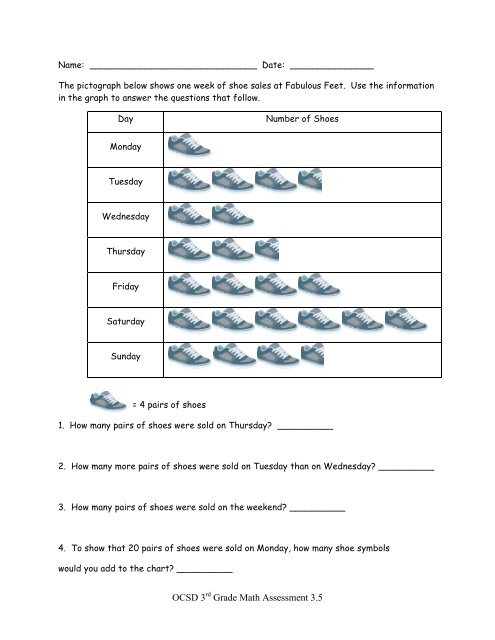
Name: ______________________________ Date: _______________<br />
The pictograph below shows one week of shoe sales at Fabulous Feet. Use the information<br />
in the graph to answer the questions that follow.<br />
Day<br />
Number of Shoes<br />
Monday<br />
Tuesday<br />
Wednesday<br />
Thursday<br />
Friday<br />
Saturday<br />
Sunday<br />
= 4 pairs of shoes<br />
1. How many pairs of shoes were sold on Thursday __________<br />
2. How many more pairs of shoes were sold on Tuesday than on Wednesday __________<br />
3. How many pairs of shoes were sold on the weekend __________<br />
4. To show that 20 pairs of shoes were sold on Monday, how many shoe symbols<br />
would you add to the chart __________<br />
<strong>OCSD</strong> 3 rd <strong>Grade</strong> <strong>Math</strong> <strong>Assessment</strong> <strong>3.5</strong>
The frequency table below shows the survey results for how students arrive at school<br />
each day. Use the table to answer the questions below.<br />
X<br />
X<br />
X<br />
X<br />
X<br />
X<br />
X<br />
X X X<br />
X X X<br />
X X X X<br />
X X X X X<br />
X X X X X<br />
walk bike bus car scooter<br />
5. How many students do NOT ride in a vehicle (car or bus) to school ______________<br />
6. Three times as many students ride the bus to school as which other option<br />
_______________<br />
7. The number of students who go by car is the same as which two options combined<br />
___________________________________________________________________<br />
8. How many students answered this survey _______________<br />
<strong>OCSD</strong> 3 rd <strong>Grade</strong> <strong>Math</strong> <strong>Assessment</strong> <strong>3.5</strong>
The bar graph below shows the kind of pets that 3 rd grade students at Lewiston<br />
Elementary have. Use the graph to answer the questions that follow.<br />
3 rd <strong>Grade</strong> Pets – Lewiston Elementary<br />
9. How many students have no pets at all ____________________<br />
10. How many more students have dogs than birds ____________________<br />
11. Which two animals together have the same number of votes as cats<br />
___________________________________________________________________<br />
12. Why do you think that horses are the least common pet _____________________<br />
___________________________________________________________________<br />
___________________________________________________________________<br />
<strong>OCSD</strong> 3 rd <strong>Grade</strong> <strong>Math</strong> <strong>Assessment</strong> <strong>3.5</strong>