View Newsletter - Chemical Insight & Forecasting
View Newsletter - Chemical Insight & Forecasting
View Newsletter - Chemical Insight & Forecasting

Create successful ePaper yourself
Turn your PDF publications into a flip-book with our unique Google optimized e-Paper software.
A monthly compilation of SRIC<br />
report abstracts and news<br />
June 2008<br />
CEH Marketing Research Report Abstract<br />
ACRYLONITRILE-BUTADIENE-STYRENE RESINS<br />
By Emanuel V. Ormonde and Kazuteru Yokose<br />
Acrylonitrile-butadiene-styrene resins (ABS) are the largest-volume engineering thermoplastic resin. ABS is a bridge between<br />
commodity plastics (e.g., polystyrene) and higher-performance engineering thermoplastics (e.g., polycarbonate). ABS resins<br />
are composed mainly of styrene (over 50%) and varying amounts of butadiene and acrylonitrile. The styrene base provides<br />
rigidity and ease of processability and acrylonitrile offers chemical resistance and heat stability. The butadiene portion of ABS<br />
supplies toughness and impact strength. The composition of ABS resins can vary widely, allowing the production of many<br />
different grades which can thus be tailored for different end-use applications.<br />
Large-volume applications for ABS resins include appliance parts (including electrical/electronics) and automotive/<br />
transportation uses. Approximately 60% of total world consumption of ABS resins was for these two main end uses. In these<br />
markets, ABS competes with specialty thermoplastics such as polycarbonates, as well as with commodity polymers such as<br />
polyvinyl chloride and polypropylene resins. Additionally, ABS resins are frequently used in polymer blends, notably with<br />
polycarbonate (PC/ABS) for many differing applications.<br />
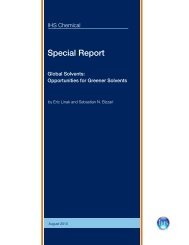
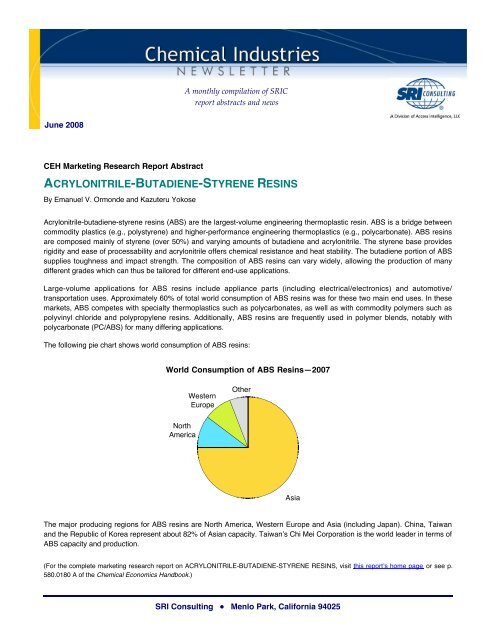
The following pie chart shows world consumption of ABS resins:<br />
World Consumption of ABS Resins—2007<br />
Western<br />
Europe<br />
Other<br />
North<br />
America<br />
Asia<br />
The major producing regions for ABS resins are North America, Western Europe and Asia (including Japan). China, Taiwan<br />
and the Republic of Korea represent about 82% of Asian capacity. Taiwan’s Chi Mei Corporation is the world leader in terms of<br />
ABS capacity and production.<br />
(For the complete marketing research report on ACRYLONITRILE-BUTADIENE-STYRENE RESINS, visit this report’s home page or see p.<br />
580.0180 A of the <strong>Chemical</strong> Economics Handbook.)<br />
SRI Consulting ● Menlo Park, California 94025
June 2008<br />
<strong>Chemical</strong> Industries <strong>Newsletter</strong><br />
CEH Marketing Research Report Abstract<br />
CHLORINATED METHANES<br />
By James Glauser with Chiyo Funada<br />
This report covers the four chlorinated methanes—methyl chloride, methylene chloride, chloroform and carbon tetrachloride<br />
(CTC). These chlorinated methanes are chiefly used as precursors—methyl chloride for silicones and other materials,<br />
methylene chloride for its solvent properties, chloroform for hydrochlorofluorocarbon-22 (HCFC-22) and CTC for<br />
chlorofluorocarbons-11 and -12 (CFC-11 and CFC-12).<br />
Most of the growth forecast for chlorinated methanes is in Asian countries (China in particular), while demand will decline in<br />
developed countries due to Montreal Protocol legislation on fluorocarbons. Other than in Asia, which will continue to see<br />
growth in HCFC-22 production past 2010, a major transition to HFC-32 (using methylene chloride) and HFC-245fa and HFC-<br />
365mfc (using carbon tetrachloride) will occur globally in developed countries.<br />
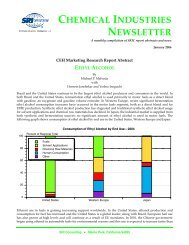
The following pie charts show world consumption of these four chlorinated methanes.<br />
World Consumption of Methyl Chloride—2007<br />
C/E Europe<br />
India<br />
Taiwan<br />
Other<br />
Rep. of Korea<br />
Thailand<br />
Japan<br />
United<br />
States<br />
World Consumption of Methylene Chloride—2007<br />
Thailand<br />
Mexico<br />
Other Asia<br />
Taiwan<br />
Rep. of Korea<br />
Middle East/Africa<br />
C/E Europe<br />
Central/South<br />
America<br />
India<br />
Other<br />
China<br />
China<br />
Japan<br />
Western<br />
Europe<br />
United<br />
States<br />
Western<br />
Europe<br />
World Consumption of Chloroform—2007<br />
Rep. of Korea<br />
C/E Europe<br />
Mexico<br />
India<br />
Other<br />
Oceania<br />
Japan<br />
World Consumption of Carbon Tetrachloride—2007<br />
India<br />
Mexico<br />
C/E Europe Central/South America<br />
Japan<br />
Western<br />
Europe<br />
United<br />
States<br />
China<br />
China<br />
Western<br />
Europe<br />
United<br />
States<br />
2 Visit us at www.sriconsulting.com
<strong>Chemical</strong> Industries <strong>Newsletter</strong> June 2008<br />
Worldwide, government regulations in developed countries have had a significant impact on the demand and use of<br />
chlorinated solvents in the past quarter century. Chlorinated methanes have been somewhat less affected than other types of<br />
chlorinated products (e.g., chlorinated ethanes), since they are used to a large extent as intermediates. Except for methylene<br />
chloride, workers and the general public are usually not exposed to chlorinated methanes.<br />
In September 2007, Parties to the Montreal Protocol on Substances that Deplete the Ozone Layer agreed to speed up the<br />
phaseout of hydrofluorocarbons (HCFCs). HCFCs were meant to replace chlorofluorocarbons (CFCs), but have been<br />
identified as a greenhouse gas (GHG). The accelerated phaseout requires developed nations to phase out HCFC by 2020,<br />
from 2040 in the original treaty. The new agreement freezes production of HCFCs at 2013 levels. In addition, developed<br />
countries have agreed to reduce production and consumption by 75% by 2010 and 90% by 2015, with the final phaseout in<br />
2020. Developing countries have agreed to cut production and consumption by 10% in 2015, by 35% by 2020, and 67.5% by<br />
2025, with final phaseout in 2030. A small amount, 2.5%, will be allowed in developing countries during the 2030–2040 period<br />
for “servicing” purposes.<br />
By 2010, HCFC-22 (R-22) producers will have to comply with the U.S. EPA’s HCFC consumption and production limits of the<br />
Montreal Protocol. The question is whether consumers will switch to the more expensive HFC blend–based equipment unless<br />
absolutely forced to. There currently is no ban on selling R-22-based AC/refrigerant equipment. Only equipment manufactured<br />
after 2010 cannot be filled with virgin R-22. If AC/refrigerant producers stockpile equipment, they can continue to purchase R-<br />
22 for the first fill, which may drive demand forward, within EPA limits, for virgin R-22 or for reclaimed R-22 (of which there is<br />
very little today). The greatest share of consumption is the service demand for existing equipment.<br />
(For the complete marketing research report on CHLORINATED METHANES, visit this report’s home page or see p. 635.2000 A of the<br />
<strong>Chemical</strong> Economics Handbook.)<br />
CEH Marketing Research Report Abstract<br />
CUMENE<br />
By Elvira O. Camara Greiner<br />
Essentially all cumene worldwide is consumed for the production of phenol and acetone. As a result, demand for cumene is<br />
strongly tied to the phenol market. Trade in cumene accounts for only 4% of world production. The largest exporters of<br />
cumene are the United States (to Germany and the Netherlands) and Japan (to the Republic of Korea). Taiwan also imports<br />
large volumes of cumene for phenol production.<br />
Increased demand for bisphenol A and phenolic resins will result in strong demand for phenol in Asia (excluding Japan). As a<br />
result, consumption of cumene for phenol is forecast to grow rapidly in the region. China is forecast to add significant cumene<br />
capacity during 2007–2012 to supply its phenol/acetone plants that are slated to come on stream during the same period.<br />
Downstream bisphenol A and polycarbonate plants are also planned in the region. The world cumene operating rate was good<br />
in 2007, and as long as phenol/acetone demand remains high for bisphenol A and phenolic resins, the world operating rate<br />
should remain healthy (also taking into consideration the new cumene capacity in the Middle East).<br />
Cumene peroxidation is the largest source of phenol and acetone. Demand for phenol, rather than acetone, determines<br />
capacity utilization. With the exception of bisphenol A, phenol and acetone have no common markets. Historically, phenol has<br />
been the more desirable product. Various alternative phenol processes that bypass acetone have been developed that<br />
typically involve benzene-to-phenol conversion, using different catalysts. However, these new processes are not expected to<br />
affect cumene demand in the very near future.<br />
(For the complete marketing research report on CUMENE, visit this report’s home page or see p. 638.5000 A of the <strong>Chemical</strong> Economics<br />
Handbook.)<br />
Visit us at www.sriconsulting.com 3
June 2008<br />
<strong>Chemical</strong> Industries <strong>Newsletter</strong><br />
CEH Marketing Research Report Abstract<br />
FLUOROCARBONS<br />
By Ray K. Will with Hiroaki Mori<br />
The fully halogenated chlorofluorocarbons (CFCs) and the partially halogenated hydrochlorofluorocarbons (HCFCs) (as well<br />
as hydrobromofluorocarbons [HBFCs], the Halons, carbon tetrachloride, methyl chloroform and methyl bromide) are<br />
stratospheric ozone depleters. Depletion of the ozone layer is a critical issue because that layer protects the earth from<br />
unacceptably high levels of ultraviolet radiation. High levels of ultraviolet radiation affect both human health and the<br />
environment through higher incidences of skin cancer, cataracts, immune system suppression, potentially reduced yields of<br />
certain crops, potential damage to aquatic plankton and, thereby, the global food chain, and increased formation of groundlevel<br />
ozone and smog.<br />
Fluorocarbon products that do not contain chlorine and/or bromine (i.e., fully fluorinated and hydrofluorinated [HFC] products)<br />
are not stratospheric ozone depleters and production of these products is not being eliminated by the Montreal Protocol. They<br />
are however, restricted by the U.S. Clean Air Act and must be recovered instead of released to the atmosphere. Similar<br />
national environmental laws implement the Montreal Protocol in the various nations that have ratified the agreement. The<br />
extent to which some HFC fluorocarbons, particularly HFC-134a, contribute to climatic change or global warming has become<br />
the subject of significant environmental concern, particularly in Europe, and raises questions about the continued use of these<br />
ODP-free CFC-replacement chemicals.<br />
As a result of the Montreal Protocol and Kyoto Protocol and subsequent amendments and ratification by individual countries,<br />
there are current and proposed regulations limiting the production, consumption and trade of CFCs, HCFCs and HFCs. Over<br />
the past two decades, the global fluorocarbons market has undergone a number of major transitions toward a greater use of<br />
non-ozone-depleting HFCs and non-global-warming, nonfluorocarbon alternatives in emissive applications.<br />
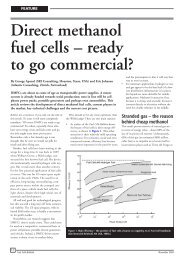
The following pie chart shows world consumption of fluorocarbons in 2007:<br />
World Consumption of Fluorocarbons—2007<br />
Central/South America Other<br />
Japan<br />
Other<br />
Asia<br />
North<br />
America<br />
Europe<br />
China<br />
Consumption of fluorocarbons in the largest market segment, refrigeration and air-conditioning, has been negatively impacted<br />
by the following:<br />
• Prevention of fluorocarbon escape from refrigeration and air-conditioning systems<br />
• Bans on fluorocarbon venting during system maintenance<br />
• Reuse (recycling) of fluorocarbons<br />
• Use of nonfluorocarbon alternatives in refrigeration such as ammonia and hydrocarbons (i.e., isobutane)<br />
4 Visit us at www.sriconsulting.com
<strong>Chemical</strong> Industries <strong>Newsletter</strong> June 2008<br />
Overall, the segment has many alternatives for the now-banned CFCs and soon-to-be-banned HCFCs in both new equipment<br />
and for servicing existing equipment. Non-fluorocarbon-based products, such as hydrocarbons, have been introduced and are<br />
now the established standard in Europe and Japan for home refrigeration. The major alternative for CFC-12 in vehicle airconditioning<br />
as well as home refrigeration in the United States, HFC-134a, grew strongly in the late 1990s, as the developed<br />
countries adopted this alternative to CFC-12. In 2003–2007, HFC-134a consumption in Japan declined, while in Europe and<br />
North America, consumption increased. In developing countries, consumption caused by the transition to HFC-134a from<br />
CFC-12 has generally lagged behind that of developed countries, except in China, where growth in the production of<br />
automobiles has caused strong HFC-134a consumption for mobile air-conditioning.<br />
Over the next five years, North American consumption of fluorocarbons will increase at a moderate average annual rate while<br />
the European market is expected to decline slowly; Japanese consumption will grow slowly. China is the world’s fastest<br />
growing fluorocarbon market.<br />
Compared with the United States, the European Union has been significantly more aggressive in its production reduction and<br />
scheduled reduction of HCFC production, and it is implementing restrictions on the use of HFCs in compliance with Kyoto<br />
Protocol goals to limit the emissions of global warming gases. The largest-volume fluorocarbons produced in Europe in 2007<br />
were HCFC-22, HFC-134a, HCFC-141b, HCFC-142b and HFC-365mfc.<br />
In 2007, the largest-volume fluorocarbon used as a refrigerant and coolant in Europe was HFC-134a, followed by HCFC-22,<br />
then blends based on HFC-143a, HFC-152a, HFC-125 and HFC-32. HFC-134a will be banned from automotive air<br />
conditioners in new vehicle models in 2011.<br />
Despite the 1996 production ban in developed countries, a continuing availability of CFCs has dampened the demand for CFC<br />
alternatives; however, this market is approaching insignificance as air-conditioning and refrigeration equipment ages to<br />
obsolescence and the energy efficiency of new equipment makes replacement an attractive option for equipment using CFCs.<br />
In the United States, stockpiled and recycled CFCs have allowed the continued operation of older refrigeration and airconditioning<br />
equipment.<br />
Chinese production of fluorocarbons has more than doubled over the last five years. In 2007 China was the world’s largest<br />
producer of HCFC-22 and ranked second to the United States in total fluorocarbon production, having surpassed Europe and<br />
Japan. China has rapidly emerged as the world’s second-largest market for fluorocarbons after the United States. China is<br />
different from the other major fluorocarbon consumers—the United States, Europe and Japan—because it is classified as a<br />
developing country and as such, can rely on HCFCs longer than the developed countries, as allowed under the Montreal<br />
Protocol.<br />
Consumption in China’s largest market segment, refrigeration and air-conditioning, is growing quickly. A major portion of<br />
China’s domestic refrigeration and air-conditioning equipment still uses HCFC-22, unlike the use of HFC-134a for the same<br />
purposes in the United States. Hydrocarbon refrigerants also account for a significant portion of China’s household<br />
refrigeration. As much as 85% of China’s HFC-134a consumption is used in the domestic automobile industry for mobile airconditioning.<br />
(For the complete marketing research report on FLUOROCARBONS, visit this report’s home page or see p. 543.7000 A of the <strong>Chemical</strong><br />
Economics Handbook.)<br />
CEH Marketing Research Report Abstract<br />
LINEAR LOW-DENSITY POLYETHYLENE (LLDPE) RESINS<br />
By Andrea V. Borruso<br />
The world polyethylene (PE) business is undergoing rather extensive restructuring and consolidation. A number of mergers<br />
and acquisitions, alliances and joint ventures have recently taken place, designed to improve competitiveness, reduce costs,<br />
expand scale, enhance market position and expand geographic coverage.<br />
Visit us at www.sriconsulting.com 5
June 2008<br />
<strong>Chemical</strong> Industries <strong>Newsletter</strong><br />
In addition, the construction of new projects in the Middle East and China in the last three years increases fears from existing<br />
producers outside the low-feedstock-cost region that a major downturn will occur when all the new capacity is on stream by<br />
2009–2010.<br />
The increasing cost of ethylene, driven by a sustained high crude oil price and the inability of converters to pass on the full<br />
extent of such large price increases, makes the traditional margin fluctuations a thing of the past with expectations that<br />
upstream integration is becoming an essential component of the economic success of PE operations outside the lowfeedstock-cost<br />
areas.<br />
In the current new business model, an asset foothold in the Middle East has become an essential component of business<br />
success, while owning technology and a large economy of scale have become a common goal for most producers.<br />
Consolidation continues to be one of the leading issues facing the industry. It is a natural response to economic conditions that<br />
occur as products become commodities and interact with business cycles. The result of consolidation is fewer and larger<br />
players and less fragmentation and an increasing focus on technical competencies.<br />
The short-term outlook for PE indicates that from the middle of 2008, LDPE, HDPE and LLDPE will have increments of<br />
capacity larger than increments of demand, with the result of a declining utilization rate. LDPE and HDPE will be the two<br />
products in larger oversupply, while LLDPE shows the best supply/demand balance among the three.<br />
This report provides historical data on linear low-density polyethylene (LLDPE) production and consumption with 2007 as the<br />
base year for supply and demand information and a forecast of production capacity and consumption to 2012. Geographical<br />
coverage is focused on North America, Western and Central/Eastern Europe, Japan and the Middle East. Summaries for<br />
LLDPE supply/demand data are included for Central and South America, Africa, Other Asia and Oceania. Many producing and<br />
consuming country official statistics, particularly trade, still do not distinguish between LLDPE and low-density polyethylene<br />
(LDPE) for reporting purposes and combine the two as LDPE. This report provides product balance LLDPE-only statistics.<br />
Capacity reporting also presents some complexity due to the allocation factor of the swing capacity to LLDPE and HDPE for<br />
each plant. While all the capacity tables report the total swing capacity, the LLDPE allocated capacity has been reported in<br />
summary in each country table.<br />
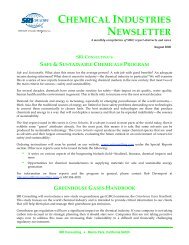
LLDPE has established itself as the third major member of the world polyethylene business along with LDPE and HDPE. The<br />
following pie chart shows world consumption of LLDPE:<br />
World Consumption of LLDPE—2007<br />
Africa<br />
Mexico<br />
Central/Eastern Europe Oceania<br />
Canada<br />
Middle East<br />
Japan<br />
Central/South<br />
America<br />
China<br />
Other Asia<br />
United<br />
States<br />
Western<br />
Europe<br />
The largest influence on future global LLDPE growth rates will be world economic growth. The replacement of LDPE down to<br />
hard-core levels is now limited to Asia and the rest of the world, as in North and South America, Europe and Japan such<br />
penetration appears to have substantially slowed. The fast growth of catalyst development activity has also created the<br />
possibility of penetrating new nonpolyethylene markets (such as PVC, metals and paper), some of which may include highervalue<br />
products. Material substitution will continue and new LLDPE products will create additional market opportunities. One<br />
6 Visit us at www.sriconsulting.com
<strong>Chemical</strong> Industries <strong>Newsletter</strong> June 2008<br />
offset to volume growth is the continuing trend toward downgauging, which is expected to have a small negative impact on<br />
consumption growth.<br />
World demand should be sustained by good growth for LLDPE and moderate growth for PE. However, the International<br />
Monetary Fund (IMF) has been forecasting a slowing of economic growth in the world during 2007–2010, which in conjunction<br />
with the impact of high oil prices will have a negative effect on the demand growth rate. Reasonably good market growth is<br />
expected, built on consumer confidence in the world’s ability to recover after the Iraq war.<br />
(For the complete marketing research report on LINEAR LOW-DENSITY POLYETHYLENE [LLDPE] RESINS, visit this report’s home page or<br />
see p. 580.1320 A of the <strong>Chemical</strong> Economics Handbook.)<br />
CEH Marketing Research Report Abstract<br />
METHANOL<br />
By Guillermo A. Saade<br />
Over the last two decades, a major shift in regional methanol capacity and production has occurred. Countries with large<br />
reserves of natural gas and often limited domestic consumption have built world-scale methanol facilities to monetize their lowcost<br />
natural gas. The largest producing region/country in 2007 was China; in 2012, it will continue to have the largest capacity<br />
and be the largest producer.<br />
Another significant factor is that the size of the new mega-methanol plants (1.0–2.0 million metric tons per year) is much larger<br />
than existing plants. Thus, they will have reduced fixed costs, as well as greatly reduced natural gas costs due to strategically<br />
located feedstock giving a significant cost advantage. This will drive down the cost of methanol, and cause major shifts in trade<br />
patterns. Locations for these large new methanol plants are (or will be) Iran, Saudi Arabia, Oman, and Trinidad and Tobago.<br />
These natural gas–advantaged countries export much of their product to developed regions such as North America, Western<br />
Europe and Japan. Consequently, producers in the more economically developed regions have shut down inefficient methanol<br />
capacity as cheaper imports have become more readily available. For example, Japan, once a major producer, now has no<br />
operating capacity. North American capacity accounted for 50% of world capacity as recently as the mid-1980s, but in 2007,<br />
accounted for less than 2%. This trend will continue, and in some regions, the effective capacity will be different from the<br />
nameplate capacity, as a result of expected idling of capacity.<br />
The following pie chart shows world consumption of methanol:<br />
World Consumption of Methanol—2007<br />
Canada<br />
Africa<br />
Central/South America Other<br />
Japan<br />
Central/Eastern<br />
Europe<br />
Other Asia<br />
China<br />
Middle East<br />
United<br />
States<br />
Western<br />
Europe<br />
Visit us at www.sriconsulting.com 7
June 2008<br />
<strong>Chemical</strong> Industries <strong>Newsletter</strong><br />
Worldwide, formaldehyde production is the largest consumer of methanol. This demand is driven by the construction industry<br />
since formaldehyde is used primarily to produce adhesives for the manufacture of various construction board products.<br />
Historically, the major end product has been plywood, but in developed countries, demand is also driven by the expanding use<br />
of engineering board products such as OSB (oriented strandboard). These wood composite products require more<br />
formaldehyde-based resin per square foot of board than plywood. Demand for formaldehyde is highly dependent on general<br />
economic conditions, and, as an example, a slowdown in construction can considerably reduce formaldehyde demand.<br />
The second-largest market for methanol worldwide is methyl tertiary-butyl ether (MTBE). In the United States, consumption<br />
increased substantially when the Clean Air Act Amendments (CAAA) of 1990 mandated that oxygenated compounds be<br />
added to gasoline as one aspect of a program to alleviate air pollution. In recent years, MTBE has come under environmental<br />
attack, primarily because it has been found in groundwater that has come into contact with leaking underground gasoline<br />
tanks. California—formerly the leading consumer of MTBE—banned the use of MTBE at the end of 2003 and several states<br />
followed suit. Methanol consumption for MTBE has been on the decline in the United States since 1999 and it is likely that<br />
MTBE’s consumption will decline further at a steady level, supported only by export-driven demand.<br />
Acetic acid is the third-largest methanol derivative. A major portion of acetic acid is consumed for the production of vinyl<br />
acetate monomer (VAM). Demand for acetic acid tracks the demand for VAM, which (globally) is projected to grow at a<br />
moderate average annual rate from 2007 to 2012.<br />
(For the complete marketing research report on METHANOL, visit this report’s home page or see p. 674.5000 A of the <strong>Chemical</strong> Economics<br />
Handbook.)<br />
CEH Product Review Abstract<br />
NATURAL GAS<br />
By Sean Davis<br />
As world energy demand increases and alternative energy sources such as water, wind and solar power fail to make<br />
significant enough contributions to ease emissions from traditional fossil fuel–derived manufacturing, more countries are<br />
deferring to readily abundant, cleaner-burning natural gas to meet domestic energy requirements. The five countries with the<br />
largest natural gas reserves are (in order) Russia, Iran, Qatar, Saudi Arabia and the United States; these countries account for<br />
almost 65% of world proved natural gas reserves.<br />
Estimates of reserves can change over time as production depletes the reserve base. New reserve additions result from<br />
exploration in new areas as well as extension of existing reserves through drilling. In regions of the world such as Russia, the<br />
Middle East and Asia Pacific, the potential to add new reserves through exploration activities is very significant. Although oil<br />
has been the historical focus of the bulk of world exploration activity, the upside potential of the natural gas resource base<br />
continues to attract the interest of the international gas majors. Lower costs, higher efficiencies and environmental advantages<br />
have made natural gas a viable energy source.<br />
North America was the largest natural gas–consuming region in 2007, followed closely by Central and Eastern Europe and<br />
Asia and Oceania, which surpassed Western European consumption beginning in 2006. Consumption for both Asia/Oceania<br />
and the Middle East has grown significantly in the past few years and is forecast to continue further development through<br />
2012.<br />
In 2007, U.S. domestic natural gas production accounted for 80% of total U.S. natural gas consumption. Imports of natural gas<br />
originate mainly from Canada. Over the past few years LNG imports from Egypt and Nigeria have increased.<br />
Overall, Western European consumption has continued to increase because of increases in demand in the industrial and<br />
power generating sectors, and steady increases in all other sectors. Currently, natural gas accounts for about a quarter of<br />
Western Europe’s total energy usage. It is expected that gas consumption will continue to increase in Western Europe.<br />
The following pie chart shows world consumption of natural gas:<br />
8 Visit us at www.sriconsulting.com
<strong>Chemical</strong> Industries <strong>Newsletter</strong> June 2008<br />
World Consumption of Natural Gas—2007<br />
Central/South America<br />
Middle East<br />
Africa<br />
North<br />
America<br />
Western<br />
Europe<br />
Asia/<br />
Oceania<br />
Central/Eastern<br />
Europe<br />
Russia remains by far the largest producer of natural gas in Eastern Europe. Approximately 25% of total natural gas output is<br />
exported to Western Europe to meet declining supply. Further expansion and development of transmission lines between<br />
Russia, other CIS countries and Western Europe will lead to further growth; however, current growth is slow.<br />
(For the complete product review on NATURAL GAS, visit this report’s home page or see p. 229.2000 A of the <strong>Chemical</strong> Economics<br />
Handbook.)<br />
CEH Marketing Research Report Abstract<br />
POLYETHYLENE TEREPHTHALATE (PET)<br />
SOLID-STATE RESINS<br />
By Elvira O. Camara Greiner with Issho K. Nakamura<br />
Development and growth of the global PET solid-state resin market since 1996 has been impressive. Thirty-two years after<br />
their introduction in the mid-1970s, global consumption of these resins continues to grow at high single-digit rates. Three<br />
regions (North America, Europe and Asia) accounted for the majority of world production and consumption.<br />
Asia and the Middle East are expected to achieve double-digit consumption growth through 2012. Eastern Europe and South<br />
America have created import opportunities. Asian and Middle Eastern producers are expected to be the major suppliers of<br />
PET exports to Eastern Europe, Central and South America, and Oceania. Continued overcapacity and relatively lower<br />
feedstock costs compared with North America and Western Europe will be the primary drivers of Asian exports.<br />
The last remaining untapped major market for PET is beer packaging, but substantial conversion has yet to materialize. Use of<br />
PET beer bottles is gaining strength primarily in developing countries, such as Russia and China. In China, poor glass quality<br />
and the low capital barrier for PET have led to an increase in the number of beer bottles produced over the years. Globally,<br />
beer accounts for approximately 5% of the PET beverage market and of that, Russia alone consumes approximately 60%. In<br />
the United States, use of PET in beer packaging is insignificant and confined to niche markets. But in Western Europe, strong<br />
PET growth is expected from beer conversion. Bottle resins for beer have been embraced in Germany and the switch from<br />
glass could support moderate double-digit PET consumption growth rates.<br />
The following pie chart shows world consumption of PET solid-state resins:<br />
Visit us at www.sriconsulting.com 9
June 2008<br />
<strong>Chemical</strong> Industries <strong>Newsletter</strong><br />
World Consumption of PET Solid-State Resins—2007<br />
Taiwan<br />
Oceania Thailand<br />
Canada<br />
India Other<br />
Africa<br />
United<br />
Japan<br />
States<br />
Middle East<br />
Mexico<br />
Central/South<br />
America<br />
Central/Eastern<br />
Europe<br />
China<br />
Western<br />
Europe<br />
PET bottle resin is a very important material driving growth in the developed economies, but growth of PET fiber remains<br />
dominant in terms of total polyester. PET growth is driven differently depending on the geographic region. In North America<br />
and Western Europe, PET growth is associated primarily with PET bottle resins; demand for PET fiber has been in decline<br />
since the late 1990s. PET growth in most other regions is primarily associated with PET fiber. Global polyester growth will<br />
continue to be driven by Asia and, more specifically, by the Chinese market.<br />
Because of persistent low margins, the global PET industry saw considerable consolidation in the last two years. Future<br />
success for improved margins will come from new and more economical technologies, perhaps more consolidation,<br />
rationalization of uneconomical capacity, vertical integration, and larger economies of scale.<br />
(For the complete marketing research report on POLYETHYLENE TEREPHTHALATE [PET] SOLID-STATE RESINS, visit this report’s home<br />
page or see p. 580.1180 A of the <strong>Chemical</strong> Economics Handbook.)<br />
SCUP Report Abstract<br />
OVERVIEW OF THE SPECIALTY CHEMICALS INDUSTRY<br />
By Uwe Fink with Yosuke Ishikawa, Wei Yang and Ray Will<br />
Specialty chemicals are produced by a complex, interlinked industry. In the strictest sense, specialty chemicals are chemical<br />
products that are sold on the basis of their performance, rather than for their composition. They can be single-chemical entities<br />
or formulations/combinations of several chemicals whose composition sharply influences the performance and processing of<br />
the customer’s product. Products and services in the specialty chemicals industry require intensive knowledge and powerful<br />
innovation.<br />
Commodity chemicals, at the other extreme, are sold strictly on the basis of their chemical composition. They are singlechemical<br />
entities. The commodity chemical product of one supplier is generally readily interchangeable with that of any other.<br />
Market-oriented specialty chemicals are groups of chemicals that are utilized by a specific industry or market, such as<br />
electronic chemicals or oil field chemicals. Functional specialty chemicals, on the other hand, are groups of products that serve<br />
the same defined function, such as adhesives, antioxidants or biocides. Technology-oriented specialty chemicals include<br />
nanochemicals and materials—particles, layers or composites—where at least one dimension is in the nanometer range, and<br />
biotechnology products, which include chemicals that are synthesized, modified and isolated from biomass by man or nature.<br />
In several specialty chemical markets prices have been falling, especially when volumes have increased and production has<br />
shifted overseas to places like China/Southeast Asia. This is a natural tendency of shifting from specialty to commodity<br />
10 Visit us at www.sriconsulting.com
<strong>Chemical</strong> Industries <strong>Newsletter</strong> June 2008<br />
chemicals over time. In the last three years, energy and raw material input prices have risen considerably; however, these cost<br />
increases have not always been passed on to customers through price increases.<br />
Over the last decade, the specialty chemicals industry has experienced slower growth and lower overall profitability within a<br />
more competitive environment than in the preceding decade. Between 2007 and 2012, the overall growth rate is forecast to be<br />
moderate.<br />
For the United States, Western Europe and Japan, the following segments are expected to experience good growth: specialty<br />
polymers, advanced ceramic materials, separation membranes, nutraceutical ingredients, and nanoscale chemicals. High<br />
growth rates are found in various subsegments.<br />
Five industries or subsegments in the three major regions are stagnating or declining—anticorrosion coatings, photographic<br />
chemicals, pesticides, textile chemicals and synthetic dyes. Pesticides is the largest of these industries. Contributing to the<br />
stagnation of pesticide consumption is the increased planting of genetically modified (GM) crops. The planted area for GM<br />
crops increased to 100 million hectares, an increase of more than 10%. <strong>Chemical</strong> consumption for photographic film<br />
manufacturing and development is forecast to decline significantly through 2012 because of the changeover from analog to<br />
digital cameras in consumer photography. Total sales of photofinishing solutions are expected to decline slowly through 2012.<br />
(For the complete June 2008 report, OVERVIEW OF THE SPECIALTY CHEMICALS INDUSTRY, visit this report’s home page or see vol. 2 of<br />
Specialty <strong>Chemical</strong>s—Strategies for Success.)<br />
SCUP REPORTS SCHEDULED FOR 2008<br />
Report Title Author Status<br />
Specialty <strong>Chemical</strong>s Business Overview Uwe Fink Published<br />
Nutraceuticals Laszlo Somogyi Published<br />
High Performance Anticorrosion Coatings Eric Linak Published<br />
High Performance Thermoplastics Fred Hajduk In production<br />
Lube Oil Additives Stefan Müller In production<br />
Water Management Ray Will In preparation<br />
Thermosetting Powder Coatings Eric Linak In production<br />
Electronic <strong>Chemical</strong>s: Semiconductor/IC Process <strong>Chemical</strong>s Uwe Fink In preparation<br />
Oil Field <strong>Chemical</strong>s Peter Allison In preparation<br />
Food Additives Laszlo Somogyi In preparation<br />
Flame Retardants Uwe Fink In preparation<br />
Biocides Stefan Müller In preparation<br />
Radiation Curable Coatings Uwe Fink In preparation<br />
To view a list of SCUP reports for sale separately, please see our website at<br />
http://www.sriconsulting.com/SCUP/Public/Reports/ . For additional information, please contact:<br />
R. J. Chang, Director<br />
Specialty <strong>Chemical</strong>s Update Program<br />
SRI Consulting<br />
4300 Bohannon Drive, Suite 200<br />
Menlo Park, CA 94025<br />
Tel. (650) 384-4300 Fax: (650) 330-1149<br />
Visit us at www.sriconsulting.com 11
June 2008<br />
<strong>Chemical</strong> Industries <strong>Newsletter</strong><br />
CEH REPORTS AND PRODUCT<br />
REVIEWS IN PREPARATION<br />
Report Title<br />
Acrylonitrile<br />
Air Separation Gases<br />
Animal Feeds: Phosphate Suppl.<br />
Butylenes<br />
Carbon Black<br />
Chlorine/Sodium Hydroxide<br />
Controlled Release Fertilizers<br />
Cyclohexane<br />
Cyclohexanol/Cyclohexanone<br />
Ethylene–Vinyl Alcohol Resins<br />
Explosives<br />
Fluoropolymers<br />
Glycerin<br />
Inorganic Pigments<br />
Monochloroacetic Acid<br />
Nitrile Elastomers<br />
Normal Paraffins<br />
Nylon Fibers<br />
Organometallics<br />
Petrochemical Industry Overview<br />
Phenol<br />
Plastics Recycling<br />
Polyacetal Resins<br />
Polyamide Elastomers<br />
Polycarbonate Resins<br />
Polyphenylene Sulfide<br />
Polypropylene Resins<br />
Polystyrene<br />
Polyvinyl Acetate<br />
Propylene<br />
SAN Resins<br />
Silicates and Silicas<br />
Sodium Chloride<br />
Sorbitol<br />
Specialty Inorganic Fibers<br />
Specialty Organic Fibers<br />
Unsaturated Polyester Resins<br />
Vinyl Acetate<br />
Zeolites<br />
Author<br />
Barbara Sesto<br />
Bala Suresh<br />
Jim Glauser<br />
Sean Davis<br />
Jim Glauser<br />
Eric Linak<br />
Mike Malveda<br />
Vimala Francis<br />
Henry Chinn<br />
Henry Chinn<br />
Stefan Schlag<br />
Ray Will<br />
Ralf Gubler<br />
Ray Will<br />
Vimala Francis<br />
Uwe Löchner<br />
Bob Modler<br />
Mike Malveda<br />
Bala Suresh<br />
Sean Davis<br />
Elvira Greiner<br />
Jim Glauser<br />
Thomas Kälin<br />
Uwe Löchner<br />
Henry Chinn<br />
RJ Chang<br />
Andrea Borruso<br />
Koon-Ling Ring<br />
Henry Chinn<br />
Michael Devanney<br />
Emanuel Ormonde<br />
Don Lauriente<br />
Stefan Schlag<br />
Sebastian Bizzari<br />
Bala Suresh<br />
Fred Hajduk<br />
Henry Chinn<br />
Henry Chinn<br />
Sean Davis<br />
This list is provided for the benefit of <strong>Chemical</strong> Economics<br />
Handbook users who may simultaneously be undertaking their<br />
own studies in these areas. Clients are welcome to write or call<br />
us in order to discuss the work in progress.<br />
CEH REPORTS AVAILABLE SEPARATELY<br />
To obtain a list of CEH marketing research reports or product<br />
reviews for sale separately, please see our website at<br />
http://www.sriconsulting.com/CEH/Public/Reports/ or<br />
contact:<br />
Koon-Ling Ring, Director<br />
<strong>Chemical</strong> Economics Handbook Program<br />
SRI Consulting<br />
4300 Bohannon Drive, Suite 200<br />
Menlo Park, CA 94025<br />
Tel. (650) 384-4300 Fax: (650) 330-1149<br />
12 Visit us at www.sriconsulting.com
<strong>Chemical</strong> Industries <strong>Newsletter</strong> June 2008<br />
CHEMICAL INDUSTRIES NEWSLETTER<br />
The <strong>Chemical</strong> Industries <strong>Newsletter</strong> is published monthly by SRI Consulting. The contents of the <strong>Newsletter</strong> are drawn from current research<br />
and publications of SRIC’s multiclient programs. Readers are welcome to call or write for more information about the subjects and programs<br />
mentioned (see addresses and telephone/fax numbers below).<br />
SRI Consulting offers the world’s most comprehensive ongoing multiclient databases on the chemical industry. The major multiclient programs<br />
include<br />
<strong>Chemical</strong> Economics Handbook<br />
Directory of <strong>Chemical</strong> Producers<br />
The China Report Canada Mexico<br />
Process Economics Program China Middle East<br />
Specialty <strong>Chemical</strong>s Update Program East Asia South/Central America<br />
World Petrochemicals Europe United States<br />
India<br />
Companies may participate in these continuing programs for the chemical industry through annual subscriptions or by purchasing individual<br />
reports. Each program is supported by inquiry and consulting privileges; electronic access is also available for all of these products.<br />
SRI Consulting.......................................................John Pearson, President and CEO<br />
George Intille, Senior Vice President<br />
Ralf Gubler, Vice President<br />
Russell Heinen, Vice President<br />
Linda Henderson, Vice President<br />
<strong>Chemical</strong> Economics Handbook..................................Koon-Ling Ring, Director<br />
Directory of <strong>Chemical</strong> Producers....................................Carolyn Read, Director<br />
Process Economics Program.....................Greg Bohlmann, Assistant Director<br />
Production/Databases ...................................................Steven F. Read, Director<br />
Specialty <strong>Chemical</strong>s Update Program..................................RJ Chang, Director<br />
World Petrochemicals............................................................Ed Gartner, Director<br />
About SRI Consulting<br />
SRI Consulting provides the world’s most comprehensive ongoing databases on the chemical industries. We offer an array of research-based<br />
programs designed to provide clients with specific market intelligence and analysis. These programs, combined with strategic information<br />
services, help clients define new market opportunities, identify and communicate future challenges, formulate and implement business<br />
strategies, and develop innovative products, processes and services. SRIC provides creative yet practical strategies, supported by renowned<br />
industry and technology expertise and delivered by multidisciplinary teams working closely with clients to ensure implementation. SRI<br />
Consulting is a division of Access Intelligence, LLC.<br />
About Access Intelligence, LLC<br />
Access Intelligence, LLC is a full-service global information and marketing solutions provider of competitive business-to-business information.<br />
The company publishes daily news services, premium-value newsletters, subscription-based websites, magazines, directories, and<br />
databases.<br />
SRI Consulting<br />
Headquarters<br />
_________________________ International Offices ____________________________<br />
Menlo Park, CA Europe, Middle East and Africa Beijing<br />
John Pearson, President and CEO Alfred-Escher-Strasse 34 Suite 1606, Tower B, Global Trade Center<br />
4300 Bohannon Drive, Suite 200 CH 8002 Zürich, Switzerland 36 North Third Ring Road East<br />
Menlo Park, CA 94025 Telephone: 41 44 283 63 33 Dongcheng District, Beijing 100013<br />
Telephone: (650) 384-4300 Fax: 41 44 283 63 30 China<br />
Fax: (650) 330-1149 zürich@sriconsulting.com Telephone: 8610-58256826<br />
menlopark@sriconsulting.com Fax: 8610-58256830<br />
beijing@sriconsulting.com<br />
U.S. Offices<br />
East Asia<br />
Houston<br />
Takeda Honcho Building, 8th Floor<br />
2002 Timberloch Place, Suite 110 2-1-7 Nihonbashi Honcho<br />
The Woodlands, TX 77380<br />
Chuoku, Tokyo 103-0023, Japan<br />
Telephone: (281) 203-6280 Telephone: 81 3 5202-7320<br />
Fax: (281) 203-6287 Fax: 81 3 5202-7333<br />
houston@sriconsulting.com<br />
tokyo@sriconsulting.com<br />
<strong>Chemical</strong> Industries <strong>Newsletter</strong><br />
Ellen Blue, Editor<br />
© 2008 by SRI Consulting.<br />
All rights reserved. Unauthorized reproduction prohibited.<br />
Visit us at www.sriconsulting.com 13