Regional Tropical Precipitation Change ... - Academia Sinica
Regional Tropical Precipitation Change ... - Academia Sinica
Regional Tropical Precipitation Change ... - Academia Sinica

You also want an ePaper? Increase the reach of your titles
YUMPU automatically turns print PDFs into web optimized ePapers that Google loves.
1SEPTEMBER 2006 C H O U E T A L . 4209<br />
Averages from 1961 to 1990 are used to represent current<br />
climate. The CO 2 concentration is doubled around<br />
2070–99. Two experiments with the ECHAM4 model<br />
coupled to the mixed layer ocean model (ML) done by<br />
the MPI are also used. The first is a control experiment,<br />
which is a 1000-yr run; data between years 800 and 899<br />
are used. The other experiment is an equilibrium<br />
doubled CO 2 run for 50 yr. Data between years 30 and<br />
50 are used since data before year 30 are spinup. Output<br />
from these simulations is used to examine mechanisms<br />
for regional tropical precipitation change under<br />
global warming.<br />
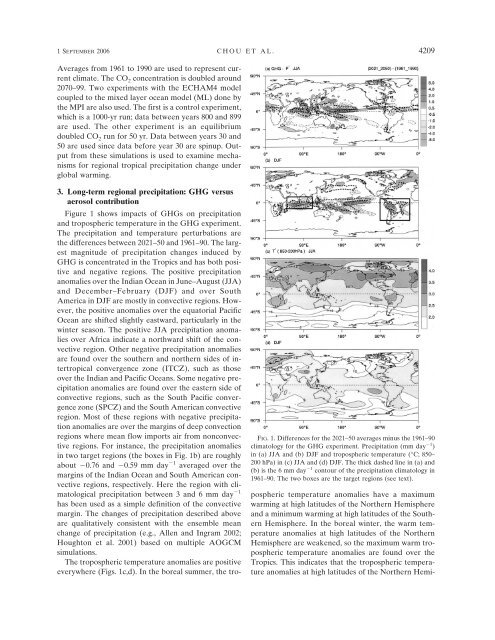
FIG. 1. Differences for the 2021–50 averages minus the 1961–90<br />
climatology for the GHG experiment. <strong>Precipitation</strong> (mm day 1 )<br />
in (a) JJA and (b) DJF and tropospheric temperature (°C; 850–<br />
200 hPa) in (c) JJA and (d) DJF. The thick dashed line in (a) and<br />
(b) is the 6 mm day 1 contour of the precipitation climatology in<br />
1961–90. The two boxes are the target regions (see text).<br />
3. Long-term regional precipitation: GHG versus<br />
aerosol contribution<br />
Figure 1 shows impacts of GHGs on precipitation<br />
and tropospheric temperature in the GHG experiment.<br />
The precipitation and temperature perturbations are<br />
the differences between 2021–50 and 1961–90. The largest<br />
magnitude of precipitation changes induced by<br />
GHG is concentrated in the Tropics and has both positive<br />
and negative regions. The positive precipitation<br />
anomalies over the Indian Ocean in June–August (JJA)<br />
and December–February (DJF) and over South<br />
America in DJF are mostly in convective regions. However,<br />
the positive anomalies over the equatorial Pacific<br />
Ocean are shifted slightly eastward, particularly in the<br />
winter season. The positive JJA precipitation anomalies<br />
over Africa indicate a northward shift of the convective<br />
region. Other negative precipitation anomalies<br />
are found over the southern and northern sides of intertropical<br />
convergence zone (ITCZ), such as those<br />
over the Indian and Pacific Oceans. Some negative precipitation<br />
anomalies are found over the eastern side of<br />
convective regions, such as the South Pacific convergence<br />
zone (SPCZ) and the South American convective<br />
region. Most of these regions with negative precipitation<br />
anomalies are over the margins of deep convection<br />
regions where mean flow imports air from nonconvective<br />
regions. For instance, the precipitation anomalies<br />
in two target regions (the boxes in Fig. 1b) are roughly<br />
about 0.76 and 0.59 mm day 1 averaged over the<br />
margins of the Indian Ocean and South American convective<br />
regions, respectively. Here the region with climatological<br />
precipitation between 3 and 6 mm day 1<br />
has been used as a simple definition of the convective<br />
margin. The changes of precipitation described above<br />
are qualitatively consistent with the ensemble mean<br />
change of precipitation (e.g., Allen and Ingram 2002;<br />
Houghton et al. 2001) based on multiple AOGCM<br />
simulations.<br />
The tropospheric temperature anomalies are positive<br />
everywhere (Figs. 1c,d). In the boreal summer, the tropospheric<br />
temperature anomalies have a maximum<br />
warming at high latitudes of the Northern Hemisphere<br />
and a minimum warming at high latitudes of the Southern<br />
Hemisphere. In the boreal winter, the warm temperature<br />
anomalies at high latitudes of the Northern<br />
Hemisphere are weakened, so the maximum warm tropospheric<br />
temperature anomalies are found over the<br />
Tropics. This indicates that the tropospheric temperature<br />
anomalies at high latitudes of the Northern Hemi-