Download Full Journal - Pakistan Academy of Sciences
Download Full Journal - Pakistan Academy of Sciences
Download Full Journal - Pakistan Academy of Sciences

You also want an ePaper? Increase the reach of your titles
YUMPU automatically turns print PDFs into web optimized ePapers that Google loves.
256 Aneela Yasmin et al<br />
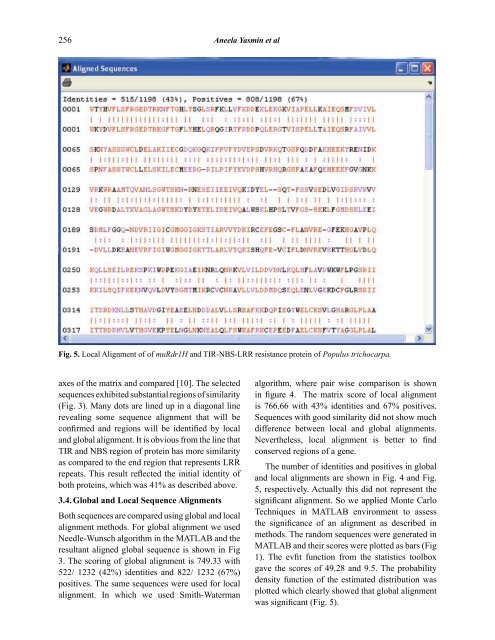
Fig. 5. Local Alignment <strong>of</strong> <strong>of</strong> muRdr1H and TIR-NBS-LRR resistance protein <strong>of</strong> Populus trichocarpa.<br />
axes <strong>of</strong> the matrix and compared [10]. The selected<br />
sequences exhibited substantial regions <strong>of</strong> similarity<br />
(Fig. 3). Many dots are lined up in a diagonal line<br />
revealing some sequence alignment that will be<br />
<br />
and global alignment. It is obvious from the line that<br />
TIR and NBS region <strong>of</strong> protein has more similarity<br />
as compared to the end region that represents LRR<br />
<br />
both proteins, which was 41% as described above.<br />
3.4. Global and Local Sequence Alignments<br />
Both sequences are compared using global and local<br />
alignment methods. For global alignment we used<br />
Needle-Wunsch algorithm in the MATLAB and the<br />
resultant aligned global sequence is shown in Fig<br />
3. The scoring <strong>of</strong> global alignment is 749.33 with<br />
522/ 1232 (42%) identities and 822/ 1232 (67%)<br />
positives. The same sequences were used for local<br />
alignment. In which we used Smith-Waterman<br />
algorithm, where pair wise comparison is shown<br />
<br />
is 766.66 with 43% identities and 67% positives.<br />
Sequences with good similarity did not show much<br />
difference between local and global alignments.<br />
<br />
conserved regions <strong>of</strong> a gene.<br />
The number <strong>of</strong> identities and positives in global<br />
and local alignments are shown in Fig. 4 and Fig.<br />
5, respectively. Actually this did not represent the<br />
<br />
Techniques in MATLAB environment to assess<br />
<br />
methods. The random sequences were generated in<br />
MATLAB and their scores were plotted as bars (Fig<br />
<br />
gave the scores <strong>of</strong> 49.28 and 9.5. The probability<br />
density function <strong>of</strong> the estimated distribution was<br />
plotted which clearly showed that global alignment