Download Full Journal - Pakistan Academy of Sciences
Download Full Journal - Pakistan Academy of Sciences
Download Full Journal - Pakistan Academy of Sciences

You also want an ePaper? Increase the reach of your titles
YUMPU automatically turns print PDFs into web optimized ePapers that Google loves.
Wavelet Characterization <strong>of</strong> Turbulence 299<br />
Residuals<br />
S<br />
<br />
A j<br />
D j<br />
j<br />
4<br />
2<br />
0<br />
-2<br />
50 100 150 200 250 300 350<br />
Histogram<br />
Auto correlations<br />
Cumulative histogram<br />
S, A<br />
j<br />
and D<br />
j<br />
are the signal, principal part j level<br />
and residual part j level. Mathematically, the<br />
relation between principal and residual part j level<br />
by mathematical is:<br />
A<br />
j1<br />
A<br />
j<br />
D<br />
j<br />
The wavelet used in the study by Haar <strong>of</strong> the level 5,<br />
j<br />
the dyadic scale is a 2 for level 5 the resolution<br />
is given by 1/a, or 2 -j . In order to approach the<br />
cyclic study maximum and minimum values, we<br />
have carried out wavelet analysis <strong>of</strong> ionospheric<br />
turbulence. In Fig. 6 the variation is presented in<br />
the form <strong>of</strong> different resolutions at level 5 <strong>of</strong> Haar<br />
wavelet type in the detailed and approximated part<br />
the cyclic variation is also presented at different<br />
level. In the detailed and approximated part at<br />
the lowest resolution several peaks are appeared.<br />
The expression <strong>of</strong> Haar wavelet in continuous<br />
time series function is represented as follows:<br />
1<br />
{ 1;0 t<br />
2<br />
{ 0; otherwise,<br />
1<br />
2<br />
t <br />
0<br />
f ( t)<br />
{ 1;<br />
t0<br />
t t0<br />
The corresponding wavelet in discrete time series<br />
{ 1; n 1 h { 1;<br />
n 2<br />
h n<br />
{0;otherwise<br />
0<br />
<br />
The quantity h 1/ 0<br />
2 is a constant. Fig. 7 shows<br />
wavelet 1-D analysis <strong>of</strong> ionospheric turbulence at<br />
<strong>Pakistan</strong> air space. Present data is non-linear there<br />
is local minimum in this period which depicts a<br />
positive skewness <strong>of</strong> frequency histogram:<br />
FFT - Spectrum<br />
Frequency<br />
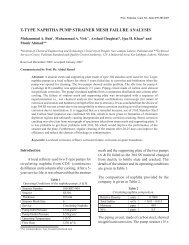
Fig. 8. The graph <strong>of</strong> residual, autocorrelation, FFTspectrum,<br />
histogram, cumulative histogram obtained from<br />
wavelet analysis F 2<br />
layer.for ionospheric turbulence.<br />
s a<br />
5<br />
d5<br />
d<br />
4<br />
d3<br />
d<br />
2<br />
d1<br />
The Fig. 8 manifests the residual, autocorrelation,<br />
FFT-spectrum, histogram, cumulative histogram<br />
<strong>of</strong> ionospheric turbulence F 2<br />
layer. For an<br />
advance and more recent analysis <strong>of</strong> ionospheric<br />
turbulence at <strong>Pakistan</strong> air space, between 1 to 365<br />
components data point, we have constructed model<br />
<strong>of</strong> ionospheric turbulence. We have used wavelet<br />
transformation which is a common method <strong>of</strong><br />
analyzing ionospheric plasma turbulence [8-10].