Create successful ePaper yourself
Turn your PDF publications into a flip-book with our unique Google optimized e-Paper software.
M.R.K.Prabhakara Rao and B.C.Negi<br />
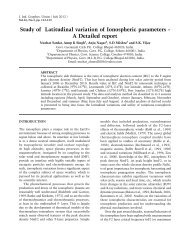
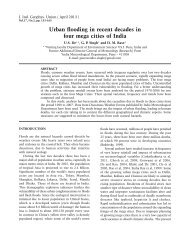
Figure 1. Location Map of villages covered by Geoelectrical surveys in Agra district.<br />
Jalnigam at Agra to arrive at an approximate<br />
correlation between total dissolved solid (TDS) count<br />
of ground water and resistivity of the different<br />
geoelectric layers. The TDS count of the water<br />
samples varied from 500 mg/l to 3000mg/l (Table 1).<br />
While the safe limit for human consumption is about<br />
1000 mg/l, people in some villages are forced to use<br />
water with higher TDS count also due to scarcity.<br />
Geophysical studies: Geoelectrical surveys were<br />
carried out in twenty-five villages located in Kiraoli and<br />
Kheragarh tehsils of Agra district (Fig.1) to locate well<br />
sites for drilling. The results of resistivity surveys are<br />
correlated with hydrogeological data including litholog<br />
data of existing bore wells for estimating the<br />
characteristic resistivity ranges of various lithological<br />
units (Anjaneyulu et al. 1992). Resistivity profiling<br />
with an electrode separation of 30 m was carried out<br />
employing Wenner configuration to find out the lateral<br />
variation of the salinity of the shallow aquifer. The<br />
resistivity soundings with a maximum separation of<br />
AB=1000 m were carried out to find out the thickness<br />
of various sand, clay and sandy clay layers and their<br />
nature (with reference to salinity) employing<br />
Schlumberger configuration. The preliminary<br />
interpretation of the sounding data was done using<br />
the curve matching technique (Orellana & Mooney<br />
1966) and further refined with the help of the<br />
inversion program (Jupp & Vozoff 1975).<br />
QUALITATIVE APPRAISAL<br />
The sounding curves at different locations of the<br />
study area show different trends. In general, K and Q<br />
type of curves or combinations of these types of curves<br />
are obtained over the region wherein the alluvial<br />
thickness is high or salinity of the deeper horizons is<br />
high. H and A type of curves are or combinations of<br />
these type of curves are obtained in the rest of the<br />
region where both depth to hard rock (sand stone) and<br />
salinity are less (Fig.3) showing an increasing trend<br />
in the resistivity for larger electrode separations.<br />
Sounding curves obtained in north eastern part<br />
(ending with descending type of curves) indicated the<br />
last layer (depth probed by sounding) to have low<br />
resistivity compared to the over lying layer. (S1, S2,<br />
S4 and S9 in Fig.3). The alluvium overlying the<br />
bedrock has much lower resistivity due to high salinity<br />
and or clay content as revealed in these four sounding<br />
curves (Prabhakar Rao et al. 1993). However, the<br />
descending trend in the last part of curve S5 in<br />
220