
You also want an ePaper? Increase the reach of your titles
YUMPU automatically turns print PDFs into web optimized ePapers that Google loves.
J. Ind. Geophys. Union (2003)<br />
Vol.7, No.4, pp.219-226<br />
Geoelectrical investigations for locating potable aquifers in<br />
parts of Agra District, U.P., India<br />
M.R.K.Prabhakara Rao and B.C.Negi<br />
National Geophysical Research Institute, Hyderabad - 500 007<br />
ABSTRACT<br />
Heavy withdrawals of groundwater for irrigation and limited recharge due to recurrent drought<br />
resulted in acute scarcity of drinking water in Kheragarh and Kiraoli Tehsils of Agra district, U.P.<br />
The geoelectrical methods comprising resistivity profiling and sounding aided by the<br />
hydrogeological data including litholog data of existing bore wells and chemical analysis data of<br />
water samples from a number of wells helped in delineating fresh water pockets underlying or<br />
overlying or at some places sandwiched between saline water zones.<br />
INTRODUCTION<br />
Agra district, located along southern fringe of the<br />
Indo-gangetic plain has a semi arid climate. Many<br />
villages in the district face severe scarcity of drinking<br />
water either due to poor yield of wells or salinity of<br />
available sources. In the alluvial covered areas of<br />
eastern part, the scarcity is primarily due to poor<br />
quality of groundwater pertaining mainly to salinity.<br />
The south westren part is covered by hard compact<br />
sandstones where the scarcity is mainly due to absence<br />
of weathered/fractured sand stone. Hence, the<br />
resistivity surveys were carried out to delineate the<br />
weathered/fractured rock in the westren part while in<br />
the eastern part, the target was delineation of<br />
freshwater pockets in a saline environment.<br />
GEOLOGY<br />
The study area is underlain by rocks belonging to<br />
Upper Bhander series of Upper Vindhyan system.<br />
These rocks are covered by thick alluvium at places.<br />
The geological sequence of the area is as follows:<br />
Quarternary Recent to Upper Younger alluvium<br />
Pleistocene older alluvium<br />
laterite and clay<br />
—————— Unconformity ———————————<br />
Precambrian Upper Vindhyan Upper Bhander<br />
system<br />
Sandstone<br />
Lower Rewa<br />
sandstone<br />
—————— Unconformity ———————————<br />
Delhi system<br />
HYDROGEOLOGY<br />
Ground water occurs mostly in the unconsolidated<br />
sediments comprising of layers having different<br />
proportions of sand, clay and kankar. In sandstones,<br />
ground water occurs in weathered and fractured zones.<br />
Weathered aquifers are in unconfined condition where<br />
as fractured aquifers are in semi confined condition.<br />
According to Handa (1964), the area is characterized<br />
by low to moderate aquifer permeabilities, low rainfall<br />
and high evapo-transpiration losses resulting in the<br />
increase of brackishness of groundwater. Based on<br />
satellite imagery studies, Rajiv Mohan, Lakshman Rao<br />
& Hira Singh (1987) have reported Kiraoli Tehsil and<br />
surrounding areas as being strongly saline. Usually<br />
fresh water aquifers overlie the deeper brackish zone<br />
as seen in Chit village. At some locations fresh water<br />
pockets underlie the brackish water layers as observed<br />
in Mahuakhera village. A third case also exist where<br />
the multi layered freshwater and saline water pockets<br />
exist. The annual departure of rain fall is reported<br />
to be –265 mm. in Agra district (Kidwai & Mukherji<br />
1988). They also reported that out of the 14<br />
hydrograph stations monitored by CGWB in Agra<br />
district, 13 wells showed declining trend of<br />
groundwater table in the range of 0.24-1.88 meters<br />
while only one well showed raising trend of 2.2m<br />
during May 1986-and May 1987. The low rainfall led<br />
to the limited recharge to freshwater aquifers resulting<br />
in decline of ground water level. Kwarnadi and<br />
Utangan rivers form the major drainage of the area.<br />
Kwarnadi is ephimeral while Utangan is a perennial<br />
river.<br />
Chemical Analysis: Chemical analysis of water<br />
samples was carried out at the laboratory of the U.P.<br />
219
M.R.K.Prabhakara Rao and B.C.Negi<br />
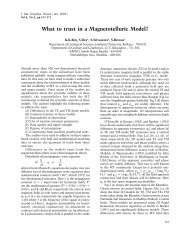
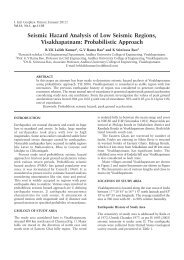
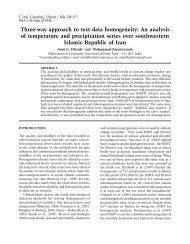
Figure 1. Location Map of villages covered by Geoelectrical surveys in Agra district.<br />
Jalnigam at Agra to arrive at an approximate<br />
correlation between total dissolved solid (TDS) count<br />
of ground water and resistivity of the different<br />
geoelectric layers. The TDS count of the water<br />
samples varied from 500 mg/l to 3000mg/l (Table 1).<br />
While the safe limit for human consumption is about<br />
1000 mg/l, people in some villages are forced to use<br />
water with higher TDS count also due to scarcity.<br />
Geophysical studies: Geoelectrical surveys were<br />
carried out in twenty-five villages located in Kiraoli and<br />
Kheragarh tehsils of Agra district (Fig.1) to locate well<br />
sites for drilling. The results of resistivity surveys are<br />
correlated with hydrogeological data including litholog<br />
data of existing bore wells for estimating the<br />
characteristic resistivity ranges of various lithological<br />
units (Anjaneyulu et al. 1992). Resistivity profiling<br />
with an electrode separation of 30 m was carried out<br />
employing Wenner configuration to find out the lateral<br />
variation of the salinity of the shallow aquifer. The<br />
resistivity soundings with a maximum separation of<br />
AB=1000 m were carried out to find out the thickness<br />
of various sand, clay and sandy clay layers and their<br />
nature (with reference to salinity) employing<br />
Schlumberger configuration. The preliminary<br />
interpretation of the sounding data was done using<br />
the curve matching technique (Orellana & Mooney<br />
1966) and further refined with the help of the<br />
inversion program (Jupp & Vozoff 1975).<br />
QUALITATIVE APPRAISAL<br />
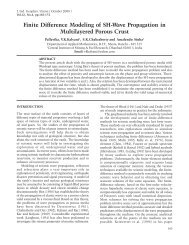
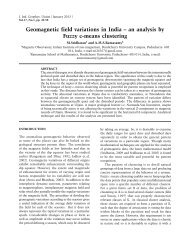
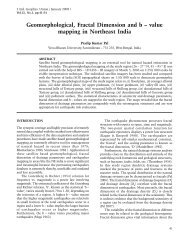
The sounding curves at different locations of the<br />
study area show different trends. In general, K and Q<br />
type of curves or combinations of these types of curves<br />
are obtained over the region wherein the alluvial<br />
thickness is high or salinity of the deeper horizons is<br />
high. H and A type of curves are or combinations of<br />
these type of curves are obtained in the rest of the<br />
region where both depth to hard rock (sand stone) and<br />
salinity are less (Fig.3) showing an increasing trend<br />
in the resistivity for larger electrode separations.<br />
Sounding curves obtained in north eastern part<br />
(ending with descending type of curves) indicated the<br />
last layer (depth probed by sounding) to have low<br />
resistivity compared to the over lying layer. (S1, S2,<br />
S4 and S9 in Fig.3). The alluvium overlying the<br />
bedrock has much lower resistivity due to high salinity<br />
and or clay content as revealed in these four sounding<br />
curves (Prabhakar Rao et al. 1993). However, the<br />
descending trend in the last part of curve S5 in<br />
220
Geoelectrical investigations for locating potable aquifers in parts of Agra District, U.P., India<br />
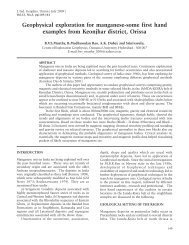
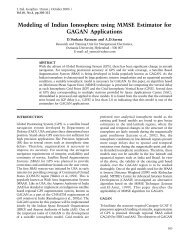
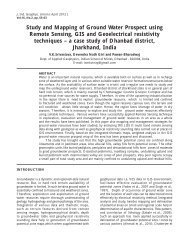
Figure 2. Wenner resistivity profile across fresh-saline Water transition zones at Imlabeda village.<br />
Singrawali village of western part is due to fractured<br />
nature of the deeper formation in this region but not<br />
due to salinity. Second type of sounding curves show<br />
a marginal rise in resistivity at larger separations after<br />
the initial steep fall in resistivity which may be due<br />
to the presence of fresh water as seen at Palisadar and<br />
Gobra villages (S3, S8 and S10 in Fig.3). A third type<br />
of sounding curves are also obtained which end with<br />
an increasing trend (S6, S7, S10,S11 and S12 in Fig.<br />
3.) corresponding to the bed rock which is sand stone<br />
of Bhander series.<br />
QUANTITATIVE INTERPRETATION<br />
Approximate resistivity ranges of various litho units has<br />
been obtained by correlation of interpreted layer<br />
parameters from the resistivity sounding data with<br />
lithology of the nearby existing wells (Dhar et al1995).<br />
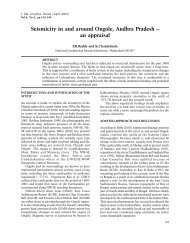
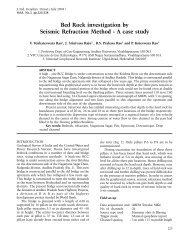
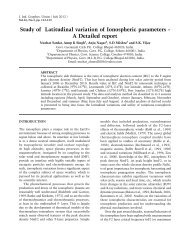
Fig.4 shows such correlation of the sounding data at<br />
Dura village with litholog. Attempts are made to<br />
constrain to the extent possible, the interpreted<br />
thickness of the various lithological units to the<br />
thickness from drilling data. Clay encountered at a depth<br />
of 6-10m and clay and kankar at 10-15 m is represented<br />
by a resistivity of 7.3 and 24 ohm m. respectively. Below<br />
these two layers, a layer comprising hard clay with some<br />
amount of kankar and fresh water bearing sand layer<br />
are revealed with resistivities of 17 and 27 ohm m<br />
respectively. In this area the wells are drilled up to this<br />
type of sand layer to construct wells. It was<br />
recommended to stop drilling at depth of 22 m because<br />
below the depth of 25 m, occurrence of saline water zone<br />
is indicated as shown by a layer of 3.5 ohm m resistivity.<br />
The soundings (S2) carried out in Chit village shows<br />
fresh water pocket at shallow depth of 25 m only, below<br />
which brackish water was expected. Based on the above<br />
comparative study of the resistivity ranges of various<br />
formations and their salanity values, it has been<br />
approximately found that the resistivities below 10 ohm<br />
m correspond to aquifer with salinity and the<br />
resistivities above 10 Ohm m and below 50 ohm m<br />
correspond to clay and sand or weathered sand stone<br />
with fresh water. However, formations with resistivities<br />
close to 10 Ohm m may yield potable water but may<br />
turn into saline if excess pumping is carried out.<br />
221
M.R.K.Prabhakara Rao and B.C.Negi<br />
Figure 3. Some typical resistivity sounding curves along with computed curves.<br />
Figure 4. Correlation of layer parameter from sounding data with litholog.<br />
222
Geoelectrical investigations for locating potable aquifers in parts of Agra District, U.P., India<br />
DISTRIBUTION OF SALINE AND FRESH WATER<br />
AQUIFERS<br />
(a) North-Eastern part of the surveyed area<br />
Wenner profiling carried out in North-South direction<br />
near Imlabeda village has clearly brought out the lateral<br />
variation in salinity of the shallow aquifer. The depth<br />
of probing for electrode separation of 30m corresponds<br />
to the shallow aquifer in the area surveyed. The profile<br />
(Fig.2) shows a decrease in apparent resistivity from<br />
70 ohm m to 8.5 ohm m. The TDS count of two<br />
water samples collected from wells falling near the<br />
profile is 950 and 1600 mg/l corresponding to apparent<br />
resistivities of 50 ohm m and 15 ohm m, respectively.<br />
In the northern part of the profile the salinity is less<br />
compared to southern part. Based on this profile, two<br />
resistivity soundings were carried out at the two ends<br />
of the profile to find out the vertical distribution of<br />
salinity. The sounding S3at the northern end shows<br />
no indication of brackishness up to 22 m (see table I).<br />
Below 22m depth a layer of 100 m thickness and<br />
9 Ohm m resistivity is present. The sounding results<br />
at the southern end (S6 in Table I) clearly show the<br />
brackish layer right from the top with 5.5 Ohm m<br />
resistivity. But the TDS value of the water sample near<br />
S3 is also close to the upper safe limit of the TDS<br />
count (1000 mg/l) and the resistivity is close to the<br />
safe limit (about 10 Ohm m). The distance between<br />
the two sounding points being around 700 meters, it<br />
clearly shows that the lateral variation of salinity is very<br />
rapid or high in this area which gives a warning that<br />
even fresh water wells may turn saline if heavy pumping<br />
is carried out in excess to the capacity of the well.<br />
Variation of litho units both laterally and vertically<br />
is seen in the Geoelectric section AA’ (Fig.5). Top 20<br />
m with a resistivity of 14 ohm m to 23 ohm m may<br />
comprise different proportions of clay, kankar and sand<br />
constituting top fresh aquifer. The underlying<br />
sediments are mainly saline from Dura to Abhedpura<br />
with entrapped potable aquifer zones at places. Saline<br />
aquifer is indicated by resistivity of 2.5 to 5 ohm m.<br />
while that of the fresh aquifer is 10-24 ohm m. Fresh<br />
water pockets occur at depths 20 to 35m at Dura and<br />
Ikaram nagar.In addition to the above fresh water zone<br />
another zone is expected at depth of 35 and 60m at<br />
Abhedpura and Ikaram Nagar respectively. The<br />
sounding results at Palisadar and Arsena are indicative<br />
of the occurrences of potable water through out the<br />
entire depth probed by the soundings with the<br />
likelihood of thicker granular zones at Arsena as<br />
indicated by layer of resistivity 28 Ohm m. This is<br />
well supported by the TDS count at Palisadar (500 mg/<br />
l) and Arsena (1000 mg/l). The variation in TDS is<br />
also reflected in the geoelectric section by the lateral<br />
variation in resistivity of the layer below the sand layer<br />
which is 12.5 ohm m. at Palisadar and 11 ohm m. at<br />
Arsena respectively. Water samples in Dura and<br />
Ikaramnagar villages showed TDS counts of 3000 mg/<br />
l and Abhedpura 2500 mg/l corresponding to clay and<br />
sand with brackish water as shown in geoelectric<br />
section (Fig.5). Depth to hard rock varies from about<br />
70 to 120 m along this profile. Basement at Arsena<br />
could not be probed due to non-availability of space<br />
for larger electrode separations. Another reason could<br />
be that the current could not penetrate down due to<br />
high degree of salinity of the layer above the bed rock.<br />
Hence the interface is shown as dotted line in the<br />
geoelectric section (Fig.5).<br />
(b) South eastern part of the Study area<br />
The fence diagram (Fig.6) shows the variation of<br />
salinity in the area both laterally and vertically. Similar<br />
to the geo electric section, the fresh water occurs at<br />
shallow depth but the range of resistivity is higher<br />
(25-50 ohm m) to that of geoelctric section (20-30)<br />
ohm m. Both situations of fresh water overlying saline<br />
water and vice versa also exist in this area. At<br />
Mahuakhera, Bhaker and Aila villages, brackish water<br />
(6-8 ohm resistivity) is sandwiched between two<br />
aquifers. The top aquifer alone is fresh at chit while<br />
the aquifer at Birheru is potable all along within the<br />
probed depth. In the central portion of the surveyed<br />
area, there exist numerous alluvial patches and places<br />
with intermontane alluvial fills. Here, the overburden<br />
is less saline compared to that of the eastern most as<br />
revealed by resistivity of 10-25 ohm m. Here the lower<br />
range of resistivity is due to predominance of clay in<br />
the aquifer but not due to salinity. A well drilled at<br />
Noni on recommendation of present investigation has<br />
yielded potable water of about 8,000 gph. At this<br />
location, thin layers of sand sandwiched between layers<br />
of clay and kankar form the aquifer. A comparison of<br />
the sounding curve S11 (Fig 3) with the lithlog<br />
indicates the resistivity of clay and kankar to be of the<br />
order of 10-15 ohm m for clay and kankar. Because of<br />
less thickness of different layers compared to the<br />
depth of occurrence, layers of fine sand have not been<br />
revealed as separate layers in the sounding curve. Hard<br />
clay and sticky clay along with fine sand in different<br />
proportions has been indicated as s single layer<br />
represented by a resistivity of 16 ohm.m between a<br />
depth of 11-24 m followed by a of layer of resistivity<br />
of 10.5 ohm m below 24 m. The depth to bed rock at<br />
this location is estimated to be about 130 m but the<br />
well was drilled only up to 76 m. If the bore was<br />
drilled further deeper it could have met some more<br />
acquifers.<br />
223
M.R.K.Prabhakara Rao and B.C.Negi<br />
Figure 5. Depth section AA’ between Dura and Arsena deduced from resistivity sounding data.<br />
Figure 6. Fence diagram around Bhaker in Eastern alluvial part of Agra district showing possible Litho units derived<br />
from electrical sounding interpretation Numbers in layers represent Electrial resistivity of the deduced lithological units.<br />
224
Geoelectrical investigations for locating potable aquifers in parts of Agra District, U.P., India<br />
HARD ROCK COVERED WESTERN REGION<br />
In the villages covered by hard rock, the source finding<br />
was comparatively much easier because of no salinity<br />
and existence of weathered and underlying fractured<br />
sandstone. The resistivity of compact sandstone is of<br />
the order of 150-300 ohm. m in most of the soundings<br />
in the region. The resistivity sounding carried out near<br />
an existing well near Singrawali village agress quite<br />
well with the well section. Weathered sand stone in<br />
the form of loose sand forms the aquifer in this bore<br />
well. The aquifer is struck at a depth of 38 m and<br />
yielded up to 46 m where the drilling was terminated.<br />
Another sounding in this village shows similar<br />
situation with a resistivity of 32 ohm.m for weathered<br />
sand stone which is expected from 50 m depth below<br />
ground level and continues up to 70m. The ground<br />
water prospects at Basai Jagnair (S12 in Fig.3) is even<br />
better because of a substantial thickness of (53 m) of<br />
a weathered/fractured layer as deduced from the<br />
sounding interpretation (Table 1). In all the villages<br />
in this area, the salinity problem is not prevalent<br />
which is also revealed by higher range of resistivities.<br />
CONCLUSIONS<br />
Electrical resistivity investigations aided by lithologs<br />
of the existing wells have made the delineation of<br />
fresh/saline water aquifers possible. Based on the<br />
above study, the area can be divided into two distinct<br />
parts namely the alluvial covered eastern and central<br />
part where the scarcity is mainly due to salinity and<br />
south western part which is mostly covered by hard<br />
sand stone. In the first part, the brackish-fresh water<br />
conditions have been revealed to be highly variable<br />
both laterally and vertically. The location of well sites<br />
was carefully done by comparing TDS count of water<br />
samples and resistivities of corresponding layers near<br />
the existing wells. Particularly, where the resistivity<br />
range of the aquifer falls near to the lower side of range<br />
(about 10 ohm m), care should be taken to select those<br />
sites with larger layer thickness. Another ambiguity<br />
is that the order of resistivities bordering 10 ohm m<br />
may correspond to sandy aquifer with brackish water<br />
and/or predominantly clayey horizon with potable<br />
water. Such problem could be solved with the help of<br />
information on the local hydrogeology and chemical<br />
analysis data. In the hard rock covered region, the<br />
success of the wells mainly depends on the weathered<br />
/ fractured nature of the rock.<br />
ACKNOWLEDGMENTS<br />
The authors thank Director, N.G.R.I, Hyderabad for<br />
his permission to publish this paper and Dr. R.L. Dhar<br />
for his guidance and suggestions at various stages of<br />
the work and this manuscript. Help rendered by<br />
authorities of U.P. Jalnigam during the field work is<br />
gratefully acknowledged. Constructive suggestions of<br />
the reviewers are greatfully acknowledged.<br />
REFERENCES<br />
Anjaneyulu, G.R 1992, Dhar,R.L., Prabhakar Rao<br />
M.R.K., Negi,B.C and Gupta C.P (1992)<br />
Geophysical investigations for ground water in<br />
Kheragarh Tehsil, Agra district, U.P, NGRI,<br />
Technical Report<br />
Dhar,R.L.,Prabhakar Rao, M.R.K,Gupta., C.P., and<br />
Negi B.C (1995).Delineation of Fresh water zones<br />
in salinity infested Aquifers of Agra district, U.P.<br />
India.Journal of Association of Exploration<br />
Geophysics, vol XVI No.3 pp 157 to 165.<br />
Handa, B.K., 1964.Calcium carbonate saturation of<br />
aquifer in India. Proc; International Geological<br />
congress, part II pp 88-101<br />
Jupp, D.L.B. & Vozooff, K., 1975. Stable Iterative<br />
methods for the inversion of geophysical data.<br />
Geophy. J.Res.,3, 957-976.<br />
Kidwai, A.L. & Mukherji, S.,1988. Effect of drought<br />
on groundwater regime in the state of Utter<br />
Pradesh during 1987 Abroad assessment: Bhujal<br />
News, Jan-March 1988, pp 21-29.<br />
Orellana,E.,& Mooney, H.M.,1966. Master tables and<br />
curves for Vertical Electrical sounding over layered<br />
Structures, Madrid,Interciencia, Spain.<br />
Prabhakar Rao M.R.K., Dhar R.L., Negi,B.C and<br />
Gupta,C.P(1993) Application of resistivity<br />
techniques for location of potable aquifers in<br />
Kiraoli and Fatehbad Tehsils of Agra district.,<br />
U.P., NGRI Technical report.<br />
Rajiv Mohan, Lakshman Rao & Hira Singh 1987.<br />
Groundwater targeting using Remote sensing<br />
and electrical resistivity method in parts of saline<br />
tracts of Agra district U.P. Journal Association<br />
of Exploration Geophysicists, Vol. VIII, No. 2,<br />
pp. 99-109.<br />
(Accepted 2003 August 28. Received 2003 August 21; in original form 2003 July 3)<br />
225
226<br />
Name of Sounding No.Resistivities (Ohm-m.) Thickness (m.) T.D.S Count<br />
Villlage (g No.) p1 p2 p3 p4 p5 p6 p7 H1 h2 h3 h4 h5 h6 (mg./ litre) Remarks<br />
Bhaker 1 41 8 23 7 32 ——-<br />
Chit 2 28 17 5 17 2 ——-<br />
Imalabeda 3 46 63 22 9 20 1 1 20 100 950<br />
Imalabeda 6 30 5.5 120 1 160 1600 Not Recommended<br />
Birheru 4 19 50 18 1 9 ——-<br />
Singravali 5 12 27 270 88 1 7 42 ——-Recommended upto 45m<br />
Ikaram Nagar 7 46 23 18 2.5 10 5 115 5 17 15 26 11 32 3000 Bore well up to 45m<br />
Gobra 8 270 20 35 13 17 1 1 3 10 Bore well up to 100 m.<br />
Babarodh 9 55 95 15 8 1 2 130 1000 Bore well up to 90 m.<br />
Palisadar 10 670 360 11 22 10 250 1 6 15 20 70 500 .<br />
Noni 11 55 15 10 9999 1 23 107 Recommended & drilled<br />
successfully<br />
Basai Jagnair 12 23 60 122 3 53<br />
Mahuakhere 13 25 7 23 12 32 Bore well upto 100m.<br />
Top aquifer may be brackish.<br />
Fresh aquifer expected below<br />
50m depth.<br />
Aila 14 16 38 6 21 1 10 63 Not recommended<br />
M.R.K.Prabhakara Rao and B.C.Negi