Saltwater intrusion in Southern Eyre Peninsula, December 2009
Saltwater intrusion in Southern Eyre Peninsula, December 2009
Saltwater intrusion in Southern Eyre Peninsula, December 2009

Create successful ePaper yourself
Turn your PDF publications into a flip-book with our unique Google optimized e-Paper software.
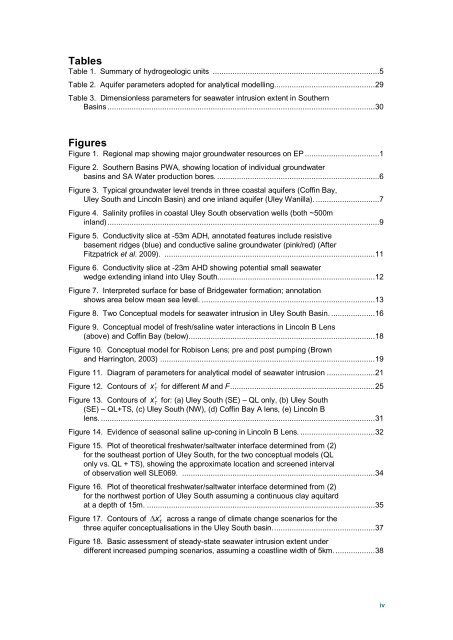
Tables<br />
Table 1. Summary of hydrogeologic units ............................................................................5<br />
Table 2. Aquifer parameters adopted for analytical modell<strong>in</strong>g .............................................. 29<br />
Table 3. Dimensionless parameters for seawater <strong><strong>in</strong>trusion</strong> extent <strong>in</strong> <strong>Southern</strong><br />
Bas<strong>in</strong>s .......................................................................................................................... 30<br />
Figures<br />
Figure 1. Regional map show<strong>in</strong>g major groundwater resources on EP ..................................1<br />
Figure 2. <strong>Southern</strong> Bas<strong>in</strong>s PWA, show<strong>in</strong>g location of <strong>in</strong>dividual groundwater<br />
bas<strong>in</strong>s and SA Water production bores. ..........................................................................6<br />
Figure 3. Typical groundwater level trends <strong>in</strong> three coastal aquifers (Coff<strong>in</strong> Bay,<br />
Uley South and L<strong>in</strong>coln Bas<strong>in</strong>) and one <strong>in</strong>land aquifer (Uley Wanilla). .............................7<br />
Figure 4. Sal<strong>in</strong>ity profiles <strong>in</strong> coastal Uley South observation wells (both ~500m<br />
<strong>in</strong>land) ............................................................................................................................9<br />
Figure 5. Conductivity slice at -53m ADH, annotated features <strong>in</strong>clude resistive<br />
basement ridges (blue) and conductive sal<strong>in</strong>e groundwater (p<strong>in</strong>k/red) (After<br />
Fitzpatrick et al. <strong>2009</strong>). ................................................................................................ 11<br />
Figure 6. Conductivity slice at -23m AHD show<strong>in</strong>g potential small seawater<br />
wedge extend<strong>in</strong>g <strong>in</strong>land <strong>in</strong>to Uley South........................................................................ 12<br />
Figure 7. Interpreted surface for base of Bridgewater formation; annotation<br />
shows area below mean sea level. ............................................................................... 13<br />
Figure 8. Two Conceptual models for seawater <strong><strong>in</strong>trusion</strong> <strong>in</strong> Uley South Bas<strong>in</strong>. .................... 16<br />
Figure 9. Conceptual model of fresh/sal<strong>in</strong>e water <strong>in</strong>teractions <strong>in</strong> L<strong>in</strong>coln B Lens<br />
(above) and Coff<strong>in</strong> Bay (below). .................................................................................... 18<br />
Figure 10. Conceptual model for Robison Lens; pre and post pump<strong>in</strong>g (Brown<br />
and Harr<strong>in</strong>gton, 2003) .................................................................................................. 19<br />
Figure 11. Diagram of parameters for analytical model of seawater <strong><strong>in</strong>trusion</strong> ...................... 21<br />
Figure 12. Contours of x<br />
T<br />
for different M and F .................................................................. 25<br />
Figure 13. Contours of x<br />
T<br />
for: (a) Uley South (SE) – QL only, (b) Uley South<br />
(SE) – QL+TS, (c) Uley South (NW), (d) Coff<strong>in</strong> Bay A lens, (e) L<strong>in</strong>coln B<br />
lens. ............................................................................................................................. 31<br />
Figure 14. Evidence of seasonal sal<strong>in</strong>e up-con<strong>in</strong>g <strong>in</strong> L<strong>in</strong>coln B Lens. .................................. 32<br />
Figure 15. Plot of theoretical freshwater/saltwater <strong>in</strong>terface determ<strong>in</strong>ed from (2)<br />
for the southeast portion of Uley South, for the two conceptual models (QL<br />
only vs. QL + TS), show<strong>in</strong>g the approximate location and screened <strong>in</strong>terval<br />
of observation well SLE069. ........................................................................................ 34<br />
Figure 16. Plot of theoretical freshwater/saltwater <strong>in</strong>terface determ<strong>in</strong>ed from (2)<br />
for the northwest portion of Uley South assum<strong>in</strong>g a cont<strong>in</strong>uous clay aquitard<br />
at a depth of 15m. ........................................................................................................ 35<br />
Figure 17. Contours of x<br />
T<br />
across a range of climate change scenarios for the<br />
three aquifer conceptualisations <strong>in</strong> the Uley South bas<strong>in</strong>. .............................................. 37<br />
Figure 18. Basic assessment of steady-state seawater <strong><strong>in</strong>trusion</strong> extent under<br />
different <strong>in</strong>creased pump<strong>in</strong>g scenarios, assum<strong>in</strong>g a coastl<strong>in</strong>e width of 5km. .................. 38<br />
iv