ANNUAL REPORT 2005 - Lukoil
ANNUAL REPORT 2005 - Lukoil
ANNUAL REPORT 2005 - Lukoil

You also want an ePaper? Increase the reach of your titles
YUMPU automatically turns print PDFs into web optimized ePapers that Google loves.
<strong>ANNUAL</strong> <strong>REPORT</strong> <strong>2005</strong>
CONTENTS<br />
ADDRESS TO SHAREHOLDERS 2<br />
MAIN FINANCIAL AND OPERATING INDICATORS 5<br />
EVENTS IN <strong>2005</strong> 8<br />
ACQUISITIONS AND DISCOVERIES IN <strong>2005</strong> 14<br />
EXPLORATION & PRODUCTION 16<br />
Geological Exploration, Oil & Gas Reserves 20<br />
Licensing 29<br />
Field Development and Oil Production 30<br />
Field Development and Gas Production 35<br />
OIL DELIVERIES 40<br />
REFINING, PETROCHEMICALS AND MARKETING 44<br />
Refining 44<br />
Gas Processing 51<br />
Petrochemicals 51<br />
Petroleum Product Marketing 53<br />
International Trade 56<br />
TECHNOLOGY AND INNOVATION 58<br />
Intensification of Oil & Gas Production 58<br />
Energy-saving Technologies 61<br />
Information Technologies 61<br />
SOCIAL RESPONSIBILITY 64<br />
Protecting the Environment 64<br />
Labour and Industrial Safety 68<br />
Personnel and Social Programs 69<br />
Social Policy and Charity Activities 72<br />
CORPORATE GOVERNANCE 76<br />
Dividends 78<br />
The Market for Company Securities 79<br />
Board of Directors and Management Committee 81<br />
Corporate Governance and Informational Openness 87<br />
LUKOIL IN THE CASPIAN REGION 90<br />
FINANCIAL ACCOUNTS 100<br />
REFERENCE INFORMATION 180<br />
1<strong>ANNUAL</strong> <strong>REPORT</strong>, <strong>2005</strong>
<strong>ANNUAL</strong> <strong>REPORT</strong>, <strong>2005</strong><br />
ADDRESS TO SHAREHOLDERS<br />
Dear Shareholders,<br />
This year, 2006, has special importance for us as the year<br />
when LUKOIL marks its fifteenth anniversary. Since its creation<br />
the Company has gone from strength to strength, scaling<br />
new heights and consistently improving efficiency in all<br />
aspects of its business, thereby increasing shareholder<br />
returns. LUKOIL has emerged as the undisputed leader<br />
among Russian private oil & gas companies in recent years<br />
thanks to huge efforts to achieve a breakthrough in both quantity<br />
and quality. From where we are today, we can confidently<br />
say that LUKOIL has successfully travelled the road from a<br />
local vertically integrated oil company to a transnational corporation,<br />
working successfully on all major international hydrocarbon<br />
markets and on a level with the global market leaders in<br />
main business segments.<br />
Chairman of the LUKOIL<br />
Board of Directors<br />
We are happy to report that <strong>2005</strong> was the best year in<br />
Valery Grayfer<br />
LUKOIL's history. We achieved our main task, which is to<br />
increase considerably shareholder value of the Company.<br />
We are pleased to note that LUKOIL shares occupied leading positions on the Russian market in <strong>2005</strong><br />
and their price rose by 95.7%.<br />
Net income of LUKOIL in the reporting year was $6,443 million, which is 51.7% more than in 2004.<br />
Return on average capital employed rose from 19.3% to 23.3%.<br />
We are glad to note that the Company has steadily increased its dividends. Recommended dividends<br />
for <strong>2005</strong> reached 33 roubles ($1.20) per share, offering 1.3% dividend yield and representing over<br />
15% of <strong>2005</strong> net profit. Overall shareholder return last year was at a record level of 99%.<br />
Conditions on the world hydrocarbon market were particularly favorable in <strong>2005</strong>. However, high export duties<br />
and mineral extraction tax enforced under Russian law took away most extra export revenue, obtained due<br />
to oil prices above $25 per barrel. Thus major growth of company value and improvement of its financial<br />
results were mainly achieved thanks to increased efficiency of LUKOIL in all aspects of its business.<br />
Our efforts in the Exploration & Production segment during the reporting year were focused on<br />
increase of current production volumes and on ensuring consistent, long-term growth of production<br />
through increase of the resource base.<br />
Oil production in <strong>2005</strong> totaled 90.16 million tonnes and gas production was 7.57 billion cubic meters.<br />
Average daily production of hydrocarbons was 1.94 million barrels of oil equivalent, which is 5.4%<br />
more than in 2004.<br />
2
The Company successfully increased its resource potential<br />
last year through both geological exploration and acquisitions.<br />
LUKOIL discovered a new high-quality oil field in the<br />
Northern Caspian. The field is the largest oil discovery of<br />
the last decade in Russia.<br />
As part of energetic expansion of its international Exploration<br />
& Production segment, LUKOIL acquired Nelson Resources<br />
Limited, which owns significant reserves in Kazakhstan.<br />
This acquisition increased the share of international projects<br />
in overall LUKOIL hydrocarbon production from 5.2% to<br />
6.8%, which fully coincides with the Company's development<br />
strategy. LUKOIL also significantly strengthened its<br />
competitive positions in Kazakhstan, advancing from ninth to<br />
fourth biggest hydrocarbon producer in that country.<br />
The Company continued consolidation of its Exploration &<br />
Production assets in <strong>2005</strong>, buying the remaining half of<br />
SeverTEK, which has licenses to develop fields in the<br />
Nenets Autonomous District and the Republic of Komi, and<br />
consolidating another company, Tursunt. LUKOIL also<br />
acquired a 66% interest in Geoilbent.<br />
President of LUKOIL<br />
Vagit Alekperov<br />
LUKOIL continued its strategy of transformation from an oil company into an oil & gas company. The<br />
Board of Directors approved a long-term program for development of Company gas business, targeting<br />
rapid increase in natural gas production. The share of gas in overall production of hydrocarbons by<br />
the Company will increase to 33%. The main aim of the program is to increase value of the Company<br />
by commercializing gas reserves.<br />
In the reporting year, the Company commissioned the Nakhodkinskoye gas field, which is one of the<br />
fields in the Bolshekhetskaya Depression. Development of fields in this region is integral to LUKOIL's<br />
gas business strategy. We view development of this business as one of the main preconditions for<br />
sustainable development of the Company as a whole in the long term.<br />
In the Refining & Marketing segment the Company prioritized improvement of product quality, as<br />
well as modernization of production facilities and development of the marketing network. The program<br />
of modernization of LUKOIL's refineries is intended to improve their technical and economic<br />
parameters, and to enable output of high-quality petroleum products, matching Euro-3 and Euro-4<br />
standards, as well as reducing environmental impact. LUKOIL is the first Russian oil company to begin<br />
large-scale production of Euro-4 diesel fuel with improved environmental characteristics and to launch<br />
mass sales of the new fuel. According to the plan for development of LUKOIL's Russian refineries,<br />
annual production of diesel fuel to Euro-4 standards will exceed 10 million tonnes by 2010.<br />
3ADDRESS TO SHAREHOLDERS
<strong>ANNUAL</strong> <strong>REPORT</strong>, <strong>2005</strong><br />
LUKOIL significantly extended its marketing network in <strong>2005</strong>, enabling the Company to bring its products<br />
to the end-user worldwide. LUKOIL bought the Finnish companies Oy Teboil Ab and Suomen<br />
Petrooli Oy, giving the Group access to the Finnish petroleum market. The Company also took steps<br />
to expand its presence on the East European retail market, particularly in Hungary and Macedonia.<br />
Cooperation between LUKOIL and ConocoPhillips was continued in <strong>2005</strong>. The joint venture,<br />
Naryanmarneftegaz, was set up as part of the strategic partnership. This company develops hydrocarbon<br />
reserves in the promising Timan-Pechora oil & gas province in northern European Russia.<br />
ConocoPhillips has a 30% interest in the company, which is managed on a parity basis. ConocoPhillips<br />
also increased its stake in LUKOIL share capital to 16.1% by the end of <strong>2005</strong>. According to conditions<br />
of the shareholder agreement, the ConocoPhillips stake in LUKOIL can go as high as 20%.<br />
In all spheres of our business we take special care to ensure that our operations do not represent a<br />
threat to society and the environment. We give top priority to health and well-being of our employees<br />
and of local populations in regions where the Company carries out its operations. LUKOIL's efforts in<br />
the environmental sphere aim to improve product quality by application of the latest technologies and<br />
to maintain high environmental standards in production processes. Our goal is to avoid negative impact<br />
on the environment and achieve rational use of natural resources.<br />
Finally, we recognize the absolute importance and value of our people, who deserve much of the credit for<br />
growth in efficiency of the Company and for resulting increase of shareholder value. LUKOIL therefore lends<br />
special importance to social policy, to raising the professional skills of personnel and to issues of motivation.<br />
Looking back at the 15-year history of the Company we are pleased to acknowledge major operating<br />
successes and success in increasing shareholder value. This has ensured a high level of income to<br />
our shareholders and investors. We see huge potential for development of LUKOIL Group in the<br />
future and believe that we can realize that potential thanks to high-quality assets, strong financial and<br />
operating indicators, cutting-edge technologies, and talented people.<br />
We believe that LUKOIL, supported by You the Shareholders, is fully capable of achieving new successes<br />
in the future.<br />
Total Shareholder<br />
Return, %<br />
Chairman of the LUKOIL<br />
Board of Directors<br />
Valery Grayfer<br />
120<br />
100<br />
80<br />
99.0<br />
President of LUKOIL<br />
Vagit Alekperov<br />
60<br />
54.8<br />
40<br />
34.1<br />
20<br />
0<br />
2003<br />
2004<br />
<strong>2005</strong><br />
4
MAIN FINANCIAL AND OPERATING INDICATORS<br />
<strong>2005</strong> 2004 Growth, %<br />
MAIN FINANCIAL INDICATORS<br />
Sales, $ million 55,774 33,845 64.8<br />
Operating income, $ million 9,388 6,034 55.6<br />
EBITDA, $ million 10,404 7,203 44.4<br />
Income before income taxes, $ million 8,910 6,008 48.3<br />
Net income, $ million 6,443 4,248 51.7<br />
Basic EPS, $ 7.91 5.20 52.1<br />
ROACE, % 23.3 19.3<br />
Capital expenditures, $ million 4,177 3,447 21.2<br />
Share price (end of year), $ 59.40 30.35 95.7<br />
Dividend per share, roubles 33 28 17.9<br />
MAIN OPERATING INDICATORS<br />
Oil reserves, million barrels 16,114 15,972 0.9<br />
Gas reserves, trillion cubic feet 25,298 24,598 2.8<br />
Hydrocarbon reserves, million boe 20,330 20,072 1.3<br />
Oil production, thousand tonnes 90,158 86,200 4.6<br />
Natural gas production, million cubic meters 2,628 1,828 43.8<br />
Associated gas production, million cubic meters 4,941 4,645 6.4<br />
Hydrocarbon production, thousand boe per day 1,942 1,842 5.4<br />
Refinery throughputs, million tonnes 47.55 44.03 8.0<br />
Gas processing, million cubic meters 2,679 2,579 3.9<br />
Petrochemical products output, million tonnes 2.18 2.24 –2.7<br />
Crude oil exports, million tonnes 45.82 46.30 –1.0<br />
Petroleum products exports, million tonnes 16.6 14.1 17.7<br />
Crude oil sales, million tonnes 46.59 47.67 –2.3<br />
Wholesale sales of petroleum products, million tonnes 65.97 52.93 24.6<br />
Retail sales of petroleum products, million tonnes 10.67 8.22 29.7<br />
Retail network (including franchises), filling stations 5,830 5,405 7.9<br />
Number of employees, thousand 145.4 162.8 –10.7<br />
5
LUKOIL IS ONE OF THE MAJOR<br />
INTERNATIONAL INTEGRATED OIL & GAS COMPANIES<br />
UKRAINE<br />
FINLAND<br />
BELARUS<br />
ESTONIA<br />
LATVIA<br />
LITHUANIA<br />
POLAND<br />
RUSSIA<br />
USA<br />
HUNGARY<br />
SERBIA AND<br />
MONTENEGRO<br />
COLOMBIA<br />
VENEZUELA<br />
ROMANIA<br />
MOLDOVA<br />
BULGARIA<br />
TURKEY<br />
CYPRUS<br />
EGYPT<br />
KAZAKHSTAN<br />
UZBEKISTAN<br />
IRAN<br />
AZERBAIJAN<br />
GEORGIA<br />
IRAQ<br />
Exploration<br />
SAUDI ARABIA<br />
Production<br />
Refining<br />
Marketing<br />
6<br />
7
<strong>ANNUAL</strong> <strong>REPORT</strong>, <strong>2005</strong><br />
EVENTS IN <strong>2005</strong><br />
January<br />
LUKOIL increases its shareholding in LUKOIL Neftochim Burgas Refinery (Bulgaria) to 93.2% via purchase<br />
of 22% of shares from minority shareholders for $56 million. A further 4% is acquired for $10<br />
million in August <strong>2005</strong>. LUKOIL's stake in the Burgas Refinery thus increases to 97.2%.<br />
LUKOIL resumes work on construction of a new polypropylene facility at the Stavrolen chemical complex<br />
(Stavropol Region). The work was interrupted in 1995 due to withdrawal of state financing. The<br />
facility with 120,000 tonnes annual capacity is to be commissioned at the end of 2006. It will be the<br />
first such facility at a LUKOIL chemical complex.<br />
LUKOIL holds an EGM, at which shareholders approve changes and additions to the Company's<br />
Charter, increasing rights of minorities in decision making concerning large deals with Company<br />
assets. A representative of ConocoPhillips, Kevin Meyers, is elected to the BoD.<br />
February<br />
LUKOIL exits the Zykh-Govsany project in Azerbaijan. The main reason for this decision is failure of<br />
Zykh-Govsany to match Company profitability criteria for projects, due to major ecological spending<br />
and a high level of reserve exhaustion.<br />
March<br />
LUKOIL and the Kazakh oil & gas company KazMunaiGaz sign founding documents of a joint venture,<br />
Caspian Oil & Gas Company, which will develop the Khvalinskoye field (Caspian Sea) as well as transporting<br />
and marketing hydrocarbons and refined products.<br />
8
The Company buys 15 filling stations in Hungary from the Austrian company ABA, raising the number<br />
of LUKOIL filling stations in Hungary to 26 (about 3% of the total Hungarian retail market).<br />
LUKOIL buys the Finnish companies Oy Teboil Ab and Suomen Petrooli Oy.<br />
LUKOIL and Gazprom sign a General Agreement on Strategic Partnership in <strong>2005</strong>–2014. The agreement<br />
concerns joint realization of projects for exploration and development of oil & gas fields in the<br />
Yamal-Nenets Autonomous District, the Russian sector of the Caspian Sea, the Republic of<br />
Uzbekistan and other regions.<br />
April<br />
LUKOIL completes calculation and independent audit of its oil & gas reserves as of 1 January, <strong>2005</strong>.<br />
According to the data, confirmed by Miller & Lents (USA), the Company's proved reserves of hydrocarbons<br />
are 20.07 billion boe: 15.97 billion barrels of oil and 24.60 trillion cubic feet of gas.<br />
The Company commissions the Nakhodkinskoye gas field in the Boshekhetskaya Depression (Yamal-<br />
Nenets Autonomous District). The field should reach its planned production level of 10 billion cubic<br />
meters by 2008.<br />
The international rating agency Moody's Investors Service raises its LUKOIL senior rating from Ba2 to<br />
Ba1. Moody's also raises its LUKOIL unsecured issuer rating from Ba3 to Ba2.<br />
May<br />
LUKOIL changes the ratio between depository receipts and ordinary shares in its two most liquid programs<br />
of receipts, from one receipt representing four common shares to one receipt representing one<br />
common share. The main point of the change is to create extra liquidity and increase attractiveness<br />
of the depository receipts for all categories of investors.<br />
9EVENTS IN <strong>2005</strong>
<strong>ANNUAL</strong> <strong>REPORT</strong>, <strong>2005</strong><br />
LUKOIL starts drilling the first exploration well, with planned depth of 2,500 meters, at the Tyub-<br />
Karagan block on the Caspian Shelf (Kazakhstan). Drilling is organized on a zero-discharge basis.<br />
June<br />
LUKOIL becomes the first Russian oil company to begin mass production and sales of Euro-4 diesel<br />
fuel with improved environmental features. The fuel meets EN-590:2004 environmental standards for<br />
diesel fuel, imposed since <strong>2005</strong> in the EU.<br />
LUKOIL holds its AGM, at which the 2004 Annual Report and accounts for the financial year are<br />
approved. Shareholders also approve dividends for 2004 at 28 roubles per common share.<br />
LUKOIL and ConocoPhillips set up a joint venture, Naryanmarneftegaz, for development of hydrocarbon<br />
reserves in the Timan-Pechora oil & gas province. The ConocoPhillips share in the joint venture is<br />
30%, for which the US company pays $529 million.<br />
LUKOIL sells its 38% interest in its construction affiliate Globalstroy-Engineering – formerly LUKOIL-<br />
Neftegazstroy – for $69 million.<br />
July<br />
LUKOIL acquires a 66% stake in Geoilbent.<br />
LUKOIL begins reconstruction and modernization of the Nizhny Novgorod Refinery. The work is due<br />
to be completed in 2009. Capex for the project is estimated at $600 million, most of which will be<br />
spent on construction of catalytic cracking, alkylation and visbreaking units. The reconstruction and<br />
modernization will be carried out without reducing current levels of petroleum product output.<br />
LUKOIL completes sale its 100% share in Arcticneft. The buyer is the Cyprus company Urals Energy<br />
Holding Limited. Total value of the deal is $40 million, including about $20 million for shares of<br />
Arcticneft as well as settlement of $20 million debt, owed by Arcticneft to LUKOIL Group companies.<br />
LUKOIL decides to begin a large-scale reconstruction and modernization of the Odessa Refinery.<br />
The main elements of the project are construction of a catalytic cracking unit and an energy generating<br />
unit. Total investments are estimated at $320 million, and the modernization will be carried out<br />
over a period of five years. As a result the Refinery will maintain its annual oil refining capacity at<br />
2.8 million tonnes, and will reduce the share of fuel oil and increase the share of high value-added<br />
products in total output.<br />
Deep exploratory drilling is begun as part of the Condor project (Columbia), which is being realized by<br />
LUKOIL and the Columbian National Oil Company, Ecopetrol. 3D seismic exploration was already carried<br />
out at the block. Planned depth of the vertical well is 5,000 meters, and the drilling location is<br />
1,100 meters above sea level.<br />
Fortune Global-500 ranks LUKOIL ninth among publicly traded integrated oil companies and 178 th<br />
among the largest international companies.<br />
10
August<br />
The first stage of a coke calcination facility is installed at the Volgograd Refinery with annual capacity<br />
of 100,000 tonnes of calcinated coke (a product, used in aluminum smelting). The second stage will<br />
be commissioned in 2009, raising total capacity to 280,000 tonnes, which is sufficient for calcifying all<br />
of the coke produced at the Refinery.<br />
EVENTS IN <strong>2005</strong><br />
September<br />
LUKOIL freezes prices for gasoline and diesel fuel at its retail outlets in Russia from 19 September<br />
until the end of <strong>2005</strong>. This step is taken in order to hold back fuel prices in the short term and to maintain<br />
the constructive dialogue between oil companies and the Russian government on stabilization of<br />
domestic prices for petroleum products and further improvement of tax regulation in the oil & gas<br />
industry.<br />
An agreement is signed in Tashkent on creation of a consortium including the National Holding<br />
Company Uzbekneftegaz, LUKOIL Overseas, Petronas Carigali Overseas (Malaysia), Korea National Oil<br />
Corporation (Korea) and CNPC International (China). The consortium will negotiate with the government<br />
of Uzbekistan on preparation of a PSA agreement for geological exploration and development of<br />
oil & gas fields in the Uzbek sector of the Aral Sea.<br />
October<br />
LUKOIL acquires a controlling stake in Nelson Resources Limited.<br />
LUKOIL and CVP (a division of PDVSA, the National Oil & Gas Company of Venezuela) sign an agreement<br />
on exploration work at the promising Junin-3 block. LUKOIL will carry out quantitative assessment<br />
and certification of heavy oil reserves at block fields. The area of the Junin-3 block is 640 km 2 .<br />
The agreement will be for three years. At the end of the exploratory work negotiations will begin<br />
between LUKOIL and CVP on development of the Junin-3 block.<br />
11
<strong>ANNUAL</strong> <strong>REPORT</strong>, <strong>2005</strong><br />
According to the directory 'Social and ecological responsibility and Russian business ratings', prepared<br />
by the International Social-ecological Union and independent ecological rating agency Nera,<br />
supported by the World Bank, LUKOIL is one of the three leaders among 75 Russian oil companies<br />
by its rate of reduction of environmental impacts in 2000–2003. Thanks to nature conservation activity<br />
by the Group, relative indicators in 2000–2003 for atmospheric emissions, water consumption and<br />
waste water discharge were significantly lower (by 1.5–2 times) for LUKOIL compared with the sector<br />
average.<br />
LUKOIL starts technical vetting of chartered oil tankers using a system designed by the Oil Companies<br />
International Maritime Forum (OCIMF), which enables scrupulous inspection of ships to ensure that<br />
they meet safety criteria and to determine the level of risks involved in sea transport of oil and petroleum<br />
products, and in loading operations at oil terminals. LUKOIL is the only Russian oil company,<br />
which is a member of OCIMF, takes part in work by its executive committee, and submits reports to<br />
OCIMF on vetting inspections of tankers, carried out in the Company's name.<br />
The Company project 'Organization of efficient insurance protection as an element of managing industrial<br />
risks: the experience of LUKOIL' wins first place in the competition 'Best project for risk management<br />
of companies and financial organizations' in the nomination 'Best project for design of insurance<br />
protection'. The competition is organized by Expert RA rating agency.<br />
November<br />
LUKOIL takes fifth place in a list of the 40 most valuable brands in Russia, ranked by Interbrand<br />
Zintzmeyer & Lux AG (Interbrand Group). LUKOIL is the only oil & gas company included in the rating<br />
of Russian brands. The Company's brand is valued at $688 million.<br />
The President of LUKOIL, Vagit Alekperov, takes first place in a rating of leaders of the Russian oil &<br />
gas business, prepared by the international magazine, Institutional Investor. The result is based on a<br />
survey of analysts and experts of the biggest global investment companies.<br />
12
LUKOIL completes eradication of the consequences of the environmental catastrophe in the Republic<br />
of Komi, caused by an oil spill from the Vozei-Golovniye Sooruzheniya pipeline in 1994 (LUKOIL bought<br />
KomiTEK, the owner of the pipeline, in 1999). The Company has thus fully executed its 2000–<strong>2005</strong><br />
program for rehabilitation of polluted land and prevention of oil-spill accidents in the Republic of Komi.<br />
EVENTS IN <strong>2005</strong><br />
LUKOIL takes second place in a rating of the 20 biggest companies in Russia in <strong>2005</strong>. The rating is<br />
prepared by the leading Russian rating agency, Expert RA.<br />
LUKOIL signs an agreement with Finnish Neste Oil on acquisition of 50% of shares of SeverTEK.<br />
LUKOIL discovers the V. Filanovsky field on the shelf of the Caspian Sea.<br />
December<br />
LUKOIL takes ninth place among European companies and sixteenth place among global companies<br />
in the rating of the 250 biggest energy companies in the world in <strong>2005</strong> by the US energy agency,<br />
Platts. Companies are measured by four main criteria: assets size, revenues, profits and return on<br />
invested capital.<br />
LUKOIL completes purchase of Nelson Resources Limited.<br />
LUKOIL buys 51% minus one share of Primorieneftegaz.<br />
LUKOIL and Norsk Hydro discover a major oil field at the Anaran exploration block in western Iran.<br />
13
<strong>ANNUAL</strong> <strong>REPORT</strong>, <strong>2005</strong><br />
ACQUISITIONS AND DISCOVERIES IN <strong>2005</strong><br />
LUKOIL made the following important acquisitions in <strong>2005</strong>.<br />
The remaining 50% interest in SeverTEK was purchased from the Finnish company Neste Oil for $318<br />
million (including payment of $98 million SeverTEK debt). The deal was closed in November <strong>2005</strong>.<br />
The company is developing the South-Shapkinskoye field in Nenets Autonomous District, as well as<br />
the Pashshorskoye, Verkhnegrubeshorskoye and South-Yuryakhinskoye fields in the Komi Republic.<br />
Proved reserves of SeverTEK at the end of <strong>2005</strong> were 216 million barrels of oil, so the price of proved<br />
reserves was $2.9 per barrel. Production in <strong>2005</strong> was 1.508 million tonnes of oil, of which the LUKOIL<br />
share was 816,000 tonnes.<br />
LUKOIL bought a 66% interest in Geoilbent from NOVATEK for $180 million. The deal was closed in<br />
July <strong>2005</strong>. Geoilbent develops the Prisklonovoye, North-Gubkinsoye and South-Tarasovskoye fields in<br />
Western Siberia. Proved reserves at the end of <strong>2005</strong> were 83 million barrels of oil. The price paid per<br />
barrel of proved reserves was $3.3. Production in <strong>2005</strong> was 1.064 million tonnes of oil, of which the<br />
LUKOIL share was 353,000 tonnes.<br />
In December <strong>2005</strong> LUKOIL consolidated Tursunt, which develops the Khulturskoye, Slavinskoye, and<br />
West-Slavinskoye fields in Western Siberia. Consolidation of Tursunt added 3 million barrels to<br />
LUKOIL's total proved reserves. Production by Tursunt in <strong>2005</strong> (including 100% of joint activity with<br />
LUKOIL-Western Siberia) was 385,000 tonnes of oil, of which the LUKOIL share was 280,000 tonnes.<br />
In the period from 14 October to 5 December LUKOIL acquired 100% of Nelson Resources Limited<br />
for $1,951 million (the company also had net debt of $60 million at the time of the acquisition). This is<br />
the largest deal in LUKOIL's history. Nelson Resources Limited has 50% shares in three PSAs in<br />
Kazakhstan: Kazakhoil-Aktobe (the Alibekmola and Kozhasai fields), Buzachi Operating (the North<br />
Buzachi field), Arman (the Arman field), and a 76% share in the joint venture KarakudukMunai (the<br />
Karakuduk field). Nelson Resources also has an option to acquire 25% stakes in two geological exploration<br />
blocks in the Kazakh sector of the Caspian Sea from KazMunaiGaz: the South Zhambai and<br />
South Zaburuniye blocks. Proved reserves of the company at the end of <strong>2005</strong> were 172 million barrels.<br />
The acquisition price per barrel of proved reserves is thus $11.7. Production in <strong>2005</strong> was 1.608<br />
million tonnes of oil and the share of LUKOIL Group was 361,000 tonnes.<br />
In December <strong>2005</strong> LUKOIL acquired 51% minus one share of Primorieneftegaz for $261 million. The<br />
company has a license for geological study of the Poimenny block, located between the Volga and<br />
Akhtuba rivers. In 2004 the Tsentralno-Astrahanskoye field was discovered on this block, giving industrial<br />
flow of gas from a depth of 4,188 meters with daily flow rate at 9.2 million cubic feet and 700<br />
barrels of condensate. Probable and possible condensate reserves are estimated at 1.2 billion barrels,<br />
and gas reserves are estimated at 9.8 trillion cubic feet.<br />
The Finnish companies Oy Teboil Ab and Suomen Petrooli Oy were acquired in March <strong>2005</strong> for $160<br />
million. Main businesses of Oy Teboil Ab and Suomen Petrooli Oy are management of a network of<br />
14
289 filling stations and 132 diesel outlets (separately standing containers and pumps for sale of diesel<br />
fuel), petroleum product wholesale, and production and sale of lubricants.<br />
LUKOIL made the following major discoveries in <strong>2005</strong>.<br />
The Company discovered a sixth field in the Northern Caspian, which was named in honor of the<br />
prominent Russian oilman, Viktor Filanovsky. Probable and possible reserves at the end of <strong>2005</strong> were<br />
estimated at 600 million barrels of oil and 985 billion cubic feet of gas. The discovery is the biggest in<br />
Russia in the last decade and will have an impact on the overall strategy for development of Northern<br />
Caspian fields. Development of the V. Filanovsky field will greatly increase profitability in the Caspian<br />
Sea, where development work is particularly expensive.<br />
ACQUISITIONS AND DISCOVERIES IN <strong>2005</strong><br />
LUKOIL and Norsk Hydro discovered a large oil field at the Anaran exploration block in western Iran.<br />
The field is one of the most significant finds of recent years in the global oil industry. The LUKOIL<br />
share in the project is 25% and Norsk Hydro has 75%. Reserves of the new field are not included in<br />
the audit of Company reserves, since activity in Iran is on the basis of a service agreement.<br />
Acquisitions and discoveries in <strong>2005</strong> increased LUKOIL's resource potential by 5.18 billion boe<br />
(including proved, probable and possible reserves, taking account of production). Oil and gas condensate<br />
represented 64% of the growth. The new acquisitions increase LUKOIL daily production by<br />
73,000 barrels (as of December <strong>2005</strong>, not taking account of further production growth at the<br />
acquired projects).<br />
15
EXPLORATION & PRODUCTION<br />
90.2<br />
Strategy<br />
Creating potential for long-term Company growth by reserve replacement in traditional regions of<br />
activity and by faster development of new production regions, including those outside Russia.<br />
Increasing efficiency of geological exploration work by careful choice of projects and application of<br />
modern technologies.<br />
80.2<br />
Ensuring average annual growth of hydrocarbon production no lower than 7% in the medium term<br />
thanks to at least 5% annual growth of oil production and accelerated growth of gas production<br />
(production launches at new fields, implementation of enhanced oil recovery methods, optimization<br />
of wellstock and field development systems).<br />
73.9<br />
Improvement of production indicators and lowering of production costs by application of modern<br />
technologies, optimization of wellstock and improvement of the improved field management.<br />
Use of financial criteria for project appraisal and assessment of results, optimization of the asset<br />
portfolio in accordance with financial criteria.<br />
61.9<br />
57.2<br />
54.7<br />
48.6<br />
16 OIL PRODUCTION<br />
(million tonnes)<br />
1993<br />
1995<br />
1997<br />
1999<br />
2001<br />
2003<br />
<strong>2005</strong>
<strong>ANNUAL</strong> <strong>REPORT</strong>, <strong>2005</strong><br />
LUKOIL is realizing oil & gas E&P projects in 10 countries worldwide. Most activity is concentrated<br />
in four federal districts of the Russian Federation: North West (Nenets Autonomous District, the<br />
Republic of Komi and Kaliningrad Region); Volga (Perm and Saratov Regions, and the Republic of<br />
Tatarstan); Urals (Yamal-Nenets and Khanty-Mansiysk Autonomous Districts); and South<br />
(Vologograd and Astrakhan Regions, and the Republic of Kalmykia). Outside Russia LUKOIL is taking<br />
part in 21 projects in 9 countries: Kazakhstan, Azerbaijan, Uzbekistan, Egypt, Iran, Iraq,<br />
Columbia, Venezuela, and Saudi Arabia.<br />
The Company achieved impressive results in <strong>2005</strong> in the Exploration & Production segment, due to the<br />
favourable price environment and continuation of the restructuring process for improvement of production<br />
efficiency. The average Urals oil price was 46.9% higher in <strong>2005</strong> than in 2004. Average daily hydrocarbon<br />
production grew by 5.4% to 1.94 million boe (oil by 4.7% to 1.82 million barrels and gas by 17.3%<br />
to 122,000 boe). Despite real strengthening of the rouble (on a background of fairly high inflation in the<br />
Russian economy), the Company managed to restrain growth of oil production costs, which were only<br />
6.6% higher than in 2004 at $2.75 per barrel of oil produced. As a result net income in the Exploration &<br />
Production segment was $3,362 million. These results testify to the Company's continued successful<br />
development in accordance with its strategic and tactical goals.<br />
The main achievement in <strong>2005</strong> was substantial expansion of the resource base of LUKOIL Group both<br />
through successful geological exploration work and through acquisition and consolidation of other<br />
companies. Major growth of resource potential enabled LUKOIL to increase forecast production<br />
growth rates. In <strong>2005</strong> LUKOIL made the largest discovery of the last 10 years in the Northern Caspian,<br />
changing the economics of resource development in the region. The Company was also involved in<br />
discovery of a large oil field in Iran (the Anaran project). LUKOIL took a 66% interest in Geoilbent,<br />
which develops fields in Western Siberia. The Company also acquired the remaining 50% of<br />
SeverTEK, which develops four fields in Timan-Pechora, from Neste Oil. LUKOIL consolidated Tursunt,<br />
which is developing three fields in Western Siberia, and acquired Primorieneftegaz, which has a<br />
license for geological study of the Poimenny territory, where the major Tsentralno-Astrakhanskoye gas<br />
condensate field was discovered in 2004.<br />
18
The second most significant Company achievement was commissioning in April <strong>2005</strong> of the<br />
Nakhodkinskoye gas field. This event marked activation of LUKOIL's gas program and the start of<br />
Company transformation from an oil company into an oil & gas company.<br />
As part of its strategy for becoming a global energy company, LUKOIL acquired Nelson Resources<br />
Limited in <strong>2005</strong>. Nelson Resources is realizing projects in Kazakhstan and the share of LUKOIL in the<br />
company's production projects as of December <strong>2005</strong> was 152,000 tonnes, which represents 33% of<br />
Group production in its current international projects.<br />
EXPLORATION & PRODUCTION<br />
The joint venture Naryanmarneftegaz was set up in <strong>2005</strong> as part of LUKOIL's strategic partnership<br />
with ConocoPhillips. The venture has begun development of hydrocarbon reserves in the promising<br />
Timan-Pechora oil & gas province in the north of the European part of Russia. The ConocoPhillips<br />
interest in the joint venture is 30%. LUKOIL and ConocoPhillips manage Naryanmarneftegaz on a<br />
parity basis.<br />
Two companies, Arcticneft and RITEK-Vnedreniye, were withdrawn from LUKOIL Group in <strong>2005</strong> as<br />
part of optimization of the Exploration & Production asset portfolio. LUKOIL also exited the Zykh-<br />
Govsany project in Azerbaijan due to economic inefficiency associated with a high level of reserve<br />
exhaustion and the need for major spending on environmental protection.<br />
In order to maximize efficiency in the Exploration & Production segment LUKOIL continued to<br />
make active use of modern technologies in <strong>2005</strong>: enhanced recovery methods; systems for<br />
maintenance of strata pressure; utilization of associated gas; systems for collection, preparation<br />
and transportation of oil; energy- and resource-saving technologies; and information technologies.<br />
LUKOIL continued to establish a multi-level system for monitoring of field development in <strong>2005</strong>,<br />
using geological and technological models with constant application. Use of such models helps to<br />
determine the best technological solutions and to increase efficiency of geological work.<br />
19
<strong>ANNUAL</strong> <strong>REPORT</strong>, <strong>2005</strong><br />
GEOLOGICAL EXPLORATION, OIL & GAS RESERVES<br />
Geological Exploration<br />
The main task of LUKOIL's geological exploration work is to replace production with new commercial<br />
reserves and to rapidly prepare resources in promising regions for exploitation. The Company places<br />
special emphasis on use of the latest technologies in its geological exploration work, enabling considerable<br />
efficiency improvements.<br />
Exploration Drilling,<br />
thousand meters<br />
2D Seismic Survey, km<br />
3D Seismic Survey, km 2<br />
200<br />
20,000<br />
6,000<br />
5,686<br />
150<br />
146<br />
118<br />
131<br />
15,000<br />
14,597<br />
4,000<br />
100<br />
10,000<br />
9,752<br />
9,787<br />
2,429<br />
2,153<br />
2,000<br />
50<br />
5,000<br />
0<br />
2003<br />
2004<br />
<strong>2005</strong><br />
0<br />
2003<br />
2004<br />
<strong>2005</strong><br />
0<br />
2003<br />
2004<br />
<strong>2005</strong><br />
Most of the Company's exploration drilling in <strong>2005</strong> was concentrated in the Timan-Pechora oil & gas<br />
province, Western Siberia and the Caspian Sea. Total exploration drilling in <strong>2005</strong> was 131,000 meters.<br />
The Company is continuously increasing volumes of 2D and 3D seismic surveying in order to discover<br />
and reveal details of new structures, and to prepare drilling of prospecting and exploration wells at<br />
promising sites. The quality of seismic work and the speed of data processing and interpretation have<br />
improved in recent years mainly thanks to use of new information technologies. In <strong>2005</strong> LUKOIL carried<br />
out 9,787 km of 2D seismic and 5,686 km 2 of 3D seismic. Vertical seismic profiling was carried<br />
out at 40 wells.<br />
Geoelectrics, km<br />
3,000<br />
2,488<br />
2,381<br />
Exploration Costs, $ million<br />
500<br />
426<br />
400<br />
Hydrocarbon Reserves<br />
Extensions and Discoveries,<br />
International Classification,<br />
million boe<br />
800<br />
640<br />
676<br />
2,000<br />
300<br />
259<br />
309<br />
600<br />
430<br />
1,000<br />
1,033<br />
200<br />
400<br />
100<br />
200<br />
0<br />
2003<br />
2004<br />
<strong>2005</strong><br />
0<br />
2003<br />
2004<br />
<strong>2005</strong><br />
0<br />
2003<br />
2004<br />
<strong>2005</strong><br />
20
Geological exploration led to discovery of five fields in <strong>2005</strong> (four oil and one oil & gas condensate) as<br />
well as 11 new oil deposits at previously discovered fields.<br />
Most of the growth of liquid hydrocarbon reserves due to geological exploration was achieved in<br />
the Nenets Autonomous District, in Western Siberia, the Caspian Sea and Perm Region. Significant<br />
oil reserves were also discovered as part of the Anaran project in Iran. The main growth of gas<br />
reserves was obtained at fields in the Bolshekhetsaya Depression (the Yamal-Nenets Autonomous<br />
District).<br />
EXPLORATION & PRODUCTION<br />
Commercial reserves under Russian classification discovered by LUKOIL in <strong>2005</strong> through geological<br />
exploration totalled 165.1 million tonnes of reference fuel. Increase/discovery of new proved reserves<br />
under international classification was 676 million boe (including 506 million barrels of oil and 1,020 billion<br />
cubic feet of gas). Increase of probable and possible reserves due to geological exploration work<br />
was 760 million boe, of which 600 barrels were oil. Spending by LUKOIL Group on geological exploration<br />
work in <strong>2005</strong> was $426 million.<br />
The Company lends special importance to efficiency improvements by use of modern technologies in<br />
geological exploration. Efficiency of geological exploration work in <strong>2005</strong> was 1,415 tonnes of reference<br />
fuel per meter drilled. That compares with efficiency of 385 tonnes per meter in 2001. The efficiency<br />
increase is mainly due to major exploration work, carried out to international technical standards<br />
in the Russian sector of the Caspian Sea. This work has led to discovery of a major new oil & gas subprovince<br />
in that region. Six large and highly productive oil & gas fields have been discovered here in<br />
1999–<strong>2005</strong>: Khvalynskoye, Yu. Korchagin, Rakushechnoye, 170th kilometer, Sarmatskoye and V.<br />
Filanovsky.<br />
Increase of reserves at the Povkhovskoye field (one of the Company's biggest fields in Western<br />
Siberia) offers an example of successful application of modern geological exploration technologies.<br />
The geological structure and parameters of the Povkhovskoye field were ascertained using<br />
new modelling technologies based on 3D seismic data, additional core studies and an up-to-date<br />
system of geophysical well studies. Proved reserves at the field grew by 21% to 842 million barrels<br />
of oil.<br />
Exploration Drilling by Regions (<strong>2005</strong>)<br />
Urals 8.6%<br />
Volga 17.9%<br />
Bolshekhetskaya<br />
Depression 4.3%<br />
Other Russian 7.1%<br />
International 9.1%<br />
Efficiency of Geological<br />
Exploration (growth of reserves<br />
per meter drilled), tons of reference<br />
fuel per meter drilled<br />
1,500<br />
1,270 1,298 1,415<br />
1,200<br />
Timan-<br />
Pechora 19.6%<br />
Western<br />
Siberia 33.4%<br />
900<br />
2003 2004 <strong>2005</strong><br />
21
<strong>ANNUAL</strong> <strong>REPORT</strong>, <strong>2005</strong><br />
Russia<br />
Total exploration drilling in Russia in <strong>2005</strong> was 119,000 meters, 2D seismic was 8,087 km and 3D seismic<br />
was 2,156 km 2 . Spending on geological exploration was $255 million.<br />
Main results from geological exploration work in Russia were obtained in Timan-Pechora, in the<br />
Northern Caspian and Western Siberia (including the Bolshekhetskaya Depression).<br />
Timan-Pechora<br />
The Timan-Pechora oil & gas province (the Nenets<br />
Autonomous District and the Komi Republic) is a<br />
new and promising oil production region both for<br />
the Company and for Russia. LUKOIL gave special<br />
importance to geological exploration work in<br />
Timan-Pechora in <strong>2005</strong>, and exploration drilling<br />
there represented 19.6% of total exploration<br />
drilling by the Company.<br />
Geological exploration work in Timan-Pechora is carried<br />
out by LUKOIL-Sever and Naryanmarneftegaz (the<br />
joint venture between LUKOIL and ConocoPhillips).<br />
LUKOIL-Sever carried out geological exploration work in <strong>2005</strong> at the Kolvinsky Bank and the<br />
Khoreiverskaya Depression. Work was begun on four prospecting wells and two wells were<br />
completed.<br />
Drilling was completed at well №255 in the northern part of the Inzyreiskoye Rise (part of the<br />
Kolvinsky Bank). Presence of commercial oil-bearing deposits was confirmed, and daily oil flow of<br />
2,452 barrels was obtained.<br />
Drilling of well №100, with planned depth of 4,700 meters, was begun at the Olginskaya structure, in<br />
the eastern part of the Kolvinsky Bank. Three strata were tested in the process of drilling and daily oil<br />
flows were between 75 and 2,094 barrels.<br />
The results of 3D seismic exploration work at the Nirmalinskaya structure and drilling of wells at the<br />
East-Sarutayuskoye field and the Nirmalinskaya structure suggest possible unification of oil<br />
deposits at these structures into one large deposit with recoverable oil reserves in excess of 250<br />
million barrels.<br />
Development of oil saturated collectors was confirmed in the northern part of the Tedinskoye field<br />
thanks to drilling of well №2 at one of the geological folds, which had been marked down for drilling<br />
as a result of 3D seismic work. Sampling of the collectors gave daily oil flow of 547 barrels.<br />
Naryanmarneftegaz carried out geological exploration work in <strong>2005</strong> at the Varandei-Adzvinskaya structural<br />
zone. Drilling of three wells was completed and a fourth was begun.<br />
22
Drilling of prospecting well №7 was completed at the Perevoznoy sector of the Toboisko-<br />
Myadseyskoye field. The well gave an oil gusher with daily flow of 1,082 barrels. Growth of proved<br />
reserves at the sector thanks to the works in <strong>2005</strong> was almost 10 million barrels or 38%.<br />
Northern Caspian<br />
The Northern Caspian is one of the main areas of<br />
oil & gas production growth for LUKOIL Group in<br />
the medium term, and the Company is prioritizing<br />
development of resource potential in this region.<br />
EXPLORATION & PRODUCTION<br />
At the end of November <strong>2005</strong> drilling of prospectingand-assessment<br />
well №2 was completed on the<br />
South Rakushechnaya territory. Two gas deposits and<br />
one oil & gas deposit were found. Testing was carried<br />
out and daily commercial flows of 6,415 barrels of oil<br />
and 16.5 million cubic feet of gas were obtained.<br />
Such high flow rates had never previously been obtained in the Caspian Sea (for comparison, the average<br />
daily flow rate at oil wells in Russia is 75 barrels). The new field was named in honor of the prominent<br />
Russian oilman, Viktor Filanovsky. It is the most significant find in Russia in the last 10 years and will have<br />
an impact on development strategy for fields in the Northern Caspian as a whole. Development of the<br />
Filanovsky field will cardinally increase profitability of high-cost work in the Caspian Sea.<br />
Probable and possible reserves at the Filanovsky field at the end of <strong>2005</strong> are estimated at 600 million<br />
barrels of oil and 985 billion cubic feet of gas. Oil represents 78% of total reserves at the field.<br />
Application of the latest technologies has made it possible to achieve levels of efficiency in Northern<br />
Caspian work, which are unprecedented in Russia. Efficiency of exploration drilling was more than<br />
15,000 tonnes of reference fuel per meter (11 times higher than the company average), and the success<br />
rate of prospecting and exploration drilling was 100%.<br />
23
<strong>ANNUAL</strong> <strong>REPORT</strong>, <strong>2005</strong><br />
Western Siberia<br />
Bolshekhetskaya Depression<br />
LUKOIL is developing reserves at the<br />
Bolshekhetskaya Depression (Yamal-Nenets<br />
Autonomous District) as part of the Company gas<br />
program: the region will be the key to growth of gas<br />
production in coming years. As of 1 January, 2006,<br />
proved gas reserves at Company fields in that<br />
region were 13.2 trillion cubic feet (2% more than<br />
a year earlier), representing 52% of total proved gas<br />
reserves of LUKOIL Group.<br />
In <strong>2005</strong> seismic exploration work was completed<br />
in the southern part of the Pyakyakhinskoye<br />
license area and the north-eastern part of the<br />
Nakhodkinskoye license area in order to locate and<br />
prepare large and promising structures.<br />
Exploration well №34 with depth of 3,600 meters was drilled at the South Messoyakhskoye field. The<br />
well log identified presence of gas in all strata. Sampling was also carried out at well №13, which had<br />
been drilled earlier: 12 gas and gas condensate structures were tested. As a result of the strata testing<br />
a gushing flow of gas and water mixture was obtained from a depth interval of 1,227–1,243<br />
meters, giving 13.7 million cubic feet per day. Testing of the strata at depth intervals of 1,146–1,154<br />
and 1,133–1,146 meters gave a daily gushing flow of 1.2 million cubic feet of gas. Results from drilling<br />
of well №34, sampling from well №13 and previous 3D seismic data enabled construction of a more<br />
accurate geological model of the South Messoyakhskoye field and recalculation of gas reserves.<br />
As a result proved reserves of gas at the field grew by 21% compared with the previous year, or by<br />
453 billion cubic feet.<br />
24
Khanty-Mansiysk Autonomous District<br />
The Khanty-Mansiysk Autonomous District remains<br />
the chief oil production region for LUKOIL.<br />
Geological exploration work in the region is mainly<br />
focused on reserve replacement in order to maintain<br />
the Group's current production levels in the region.<br />
In <strong>2005</strong> the Company's proved reserves of oil in<br />
the region taking account of production grew by<br />
465 million barrels, or by 5.4% y-o-y.<br />
EXPLORATION & PRODUCTION<br />
Four new structures with forecast reserves of<br />
about 30 million barrels were added in <strong>2005</strong> as a<br />
result of 2D seismic exploration work. 3D seismic<br />
exploration work on the license areas led to a complex<br />
reinterpretation of seismic data, resulting in<br />
specification of the geological models of the fields developed by the Company. For example, seismic<br />
data for the South Yagunskoye field showed greater extent of oil-bearing strata and oil-saturated rock.<br />
Closer study of geological structure and characteristics of the Povkhovskoye field increased proved<br />
reserves of the field by 21% to 842 million barrels of oil.<br />
Prospecting and exploration drilling in the region in <strong>2005</strong> totalled 44,000 meters. The main positive<br />
results were in well testing at the North Danilovsky license area, which gave daily oil flow of<br />
874 barrels. Also, a daily oil flow of 464 barrels was achieved in testing of an exploration well at<br />
the East Lazarevskoye license area. A gushing daily flow of 906 barrels of water-free oil was<br />
obtained from an exploration well at the Okunevaya structure in the eastern part of the Las-<br />
Yegansky license area.<br />
Geological exploration works in <strong>2005</strong> led to discovery of six oil deposits at the Povkhovskoye field,<br />
and one deposit apiece at the Pokachevskoye, Malokartopyinskoye and Lovinskoye fields.<br />
International Projects<br />
Exploration drilling in international projects totalled 12,000 meters in <strong>2005</strong>, 2D seismic exploration was<br />
1,700 km and 3D seismic was 3,530 km 2 . Geological exploration expenses as part of international projects<br />
were $171 million.<br />
The main purpose of LUKOIL geological exploration work abroad is to prepare a resource base for rapid<br />
organization of production, in line with the Group's strategy for transformation into a global energy company.<br />
At the start of <strong>2005</strong> the Company was a participant in nine geological exploration projects outside<br />
Russia: D-222 (Azerbiajan); Condor (Columbia); Anaran (Iran); West Geisum and North-East Geisum<br />
(Egypt); Tyub-Karagan and Atashsky (Kazakhstan); Block A (Saudi Arabia); and Kandym – Khauzak –<br />
Shady (Uzbekistan).<br />
25
<strong>ANNUAL</strong> <strong>REPORT</strong>, <strong>2005</strong><br />
In <strong>2005</strong> LUKOIL began implementation of a project for measurement and certification of reserves at<br />
heavy oil fields located within Junin-3 block (Venezuela). The block area is 640 km 2 and the agreement<br />
is for three years. When studies have been completed talks will begin between LUKOIL and CVP<br />
(a division of the national oil company PDVSA) on development of the Junin-3 fields.<br />
Also in <strong>2005</strong> LUKOIL acquired the company Nelson Resources Limited, which has an option agreement<br />
to acquire 25% interest in two geological exploration projects on the Caspian Shelf: South<br />
Zhambai and South Zaburuniye (both 100% owned by KazMunaiGaz).<br />
By the end of <strong>2005</strong>, therefore, LUKOIL was a participant in ten international geological exploration<br />
projects and had options to obtain stakes in two more projects.<br />
Drilling of the first exploration well, Azar-2, was completed as part of the Anaran project in Iran, which<br />
is being carried out jointly with the Norwegian company, Norsk Hydro. The well was drilled at the<br />
promising Azar structure, to final depth of 4,800 meters. Testing of the well gave oil flows from five<br />
intervals at daily rates from 2,214 to 3,044 barrels. Commercial value of the discovery was confirmed<br />
and negotiations began with the National Iranian Oil Company (NIOC) on the start of field development.<br />
The field is one of the most significant discoveries in the global oil industry in recent years. Reserves<br />
discovered as part of the project are not shown on the Company balance sheet, since activities at<br />
Anaran are under a service agreement.<br />
In Columbia deep exploration drilling was begun at the Medina structure, which is part of the Condor<br />
block. The project is being implemented by LUKOIL and Ecopetrol (the Columbian national oil company).<br />
3D seismic exploration has been previously carried out at the block. Planned depth of the vertical<br />
well is 5,000 meters and it is located 1.1 km above sea level.<br />
Two wells, Shege-1 and Shege-2, at a part of the Kungradsky block in Uzbekistan, were acquired,<br />
recommissioned and tested as part of the Kandym – Khauzak – Shady project. Shege-1 well gave a<br />
commercial flow of gas with daily yield of 12.3 million cubic feet. Seismic work began and pre-project<br />
26
work was carried out for construction of the Kandym gas processing plant. Proved gas reserves in the<br />
Kandym – Khauzak – Shady project increased by 912 billion cubic feet, or by 86% during the year.<br />
Drilling of a 4,500 meter exploration well was completed in the deepwater part of the Azerbaijani sector<br />
of the Caspian Sea as part of the D-222 (Yalama) project, which is being implemented jointly with<br />
the State Oil Company of Azerdaijan. The work, which is observing a principle of zero discharge, located<br />
gas and obtained unique geological information about structures in the central part of the Caspian,<br />
where no exploration drilling had previously been carried out. The well was dismantled for geological<br />
reasons. On the basis of the geological and geophysical data obtained from the well, scientific studies<br />
have now begun in order to adjust the geological model of promising structures. Preparations for<br />
a program of further prospecting and exploration work have also started.<br />
EXPLORATION & PRODUCTION<br />
Drilling of a first exploration well with depth of 2,500 meters was carried out at the Tyub-Karagan<br />
offshore territory in the central part of the Kazakh sector of the Caspian Sea. The well was dismantled<br />
for geological reasons. At the neighbouring Atashsky territory 2D seismic work continued, as<br />
did electrical exploration and geological-engineering studies ahead of drilling of the first exploration<br />
well. Both projects are being implemented jointly with the Kazakh national oil company<br />
KazMunaiGaz.<br />
2D and 3D seismic exploration was successfully completed on an area of 1,800 km 2 at the gas Block<br />
A in the Rub-Al-Khali desert (Saudi Arabia), and preparations were made for drilling of a first exploration<br />
well at the South Tukhman structure. The project is being implemented jointly with the Saudi national<br />
oil company, Saudi Aramco.<br />
In Egypt preparations were completed for drilling of a second exploration well at the North-East<br />
Geisum offshore block.<br />
An agreement was signed in <strong>2005</strong> on creation of a consortium of investors consisting of the Uzbek<br />
national holding company Uzbekneftegaz, LUKOIL Overseas, Petronas Carigali Overseas (Malaysia),<br />
Korea National Oil Corporation (Republic of Korea), and CNPC International (China). The consortium will<br />
negotiate with the Government of the Republic of Uzbekistan on preparation of a PSA for geological<br />
exploration and development of oil & gas fields in the Uzbek sector of the Aral Sea.<br />
Oil & Gas Reserves<br />
1.4% of global oil reserves<br />
0.4% of global gas reserves<br />
First by oil reserves among major international publicly traded oil companies<br />
Second by hydrocarbon reserves among major international publicly traded oil companies<br />
Proved hydrocarbon reserves of LUKOIL Group under international classification* as of 1 January,<br />
2006, were 20.330 billion boe, including 16.114 billion barrels of oil and 25.298 trillion cubic feet of<br />
gas. Proved hydrocarbon reserves are sufficient for 29 years at current production levels (oil for 24<br />
years and gas for 95 years).<br />
* In <strong>2005</strong> Miller and Lents (USA) carried out its eleventh consecutive annual technical and economic audit of LUKOIL Group reserves<br />
to standards of the US Society of Petroleum Engineers (US SPE).<br />
27
<strong>ANNUAL</strong> <strong>REPORT</strong>, <strong>2005</strong><br />
Distribution of oil & gas reserves by regions<br />
Timan-Pechora<br />
3,833 million barrels<br />
176 bcf<br />
Urals<br />
2,170 million barrels<br />
607 bcf<br />
23.8%<br />
0.7%<br />
13,5%<br />
2.4%<br />
Western Siberia<br />
8,572 million barrels 53.2%<br />
1,698 bcf<br />
6.7%<br />
Bolshekhetskaya<br />
Depression<br />
203 million barrels 1.2%<br />
13,185 bcf<br />
52.1%<br />
International<br />
projects<br />
614 million barrels<br />
3,845 bcf<br />
3.8%<br />
15.2%<br />
Other<br />
254 million barrels<br />
4 bcf 1.6%<br />
0.0%<br />
Volga<br />
285 million barrels<br />
180 bcf<br />
1.8%<br />
0.7%<br />
Northern Caspian<br />
183 million barrels<br />
5,603 bcf<br />
1.1%<br />
22.2%<br />
Oil<br />
100%<br />
Gas<br />
100%<br />
Total<br />
16,114 million barrels<br />
25,298 bcf<br />
Proved hydrocarbon reserves of LUKOIL grew by 4.8% in <strong>2005</strong> taking account of production and by<br />
1.3% not taking account of production. The growth for oil was 5.1% with production and 0.9% without<br />
production, and the figures for gas were 3.9% and 2.8% respectively.<br />
The hydrocarbon reserve replacement ratio was 137% (121% for oil and 362% for gas).<br />
LUKOIL's proved hydrocarbon reserves increased by 676 million boe in <strong>2005</strong> as a result of geological<br />
exploration work (506 million barrels of oil and 1,020 billion cubic feet of gas), so geological<br />
exploration almost fully compensated Company production of hydrocarbons. The LUKOIL strategic<br />
development program for <strong>2005</strong>–2014 provides for a full reserve replacement at a competitive rate<br />
of costs.<br />
Proved Hydrocarbon<br />
Reserves, billion boe<br />
Proved Oil Reserves,<br />
billion barrels<br />
Proved Gas Reserves,<br />
trillion cubic feet<br />
20.4<br />
20.3<br />
20.330<br />
16.2<br />
16.114<br />
25.5<br />
25.298<br />
20.2<br />
16.1<br />
25.0<br />
20.1<br />
20.0<br />
20.072<br />
20.056<br />
16.0<br />
15.977<br />
15.972<br />
24.5<br />
24.598<br />
24.473<br />
19.9<br />
2003<br />
2004<br />
<strong>2005</strong><br />
15.9<br />
2003<br />
2004<br />
<strong>2005</strong><br />
24.0<br />
2003<br />
2004<br />
<strong>2005</strong><br />
28
LUKOIL oil & gas reserves<br />
As of 1 January, 2006<br />
Oil<br />
million barrels<br />
Gas<br />
billion cubic feet<br />
Oil + gas*<br />
billion boe<br />
Proved reserves 16,114 25,298 20,330<br />
of which:<br />
under development 10,583 6,089 11,598<br />
not under development 5,531 19,209 8,732<br />
Probable reserves 8,869 20,587 12,300<br />
EXPLORATION & PRODUCTION<br />
Possible reserves 4,336 10,240 6,043<br />
* Translation of cubic feet into boe is based on 1 boe = 6,000 cubic feet<br />
Proved reserves also grew thanks to acquisitions and asset consolidations. Nelson Resources Limited,<br />
which was acquired by LUKOIL last year, had reserves of 172 million barrels at the end of <strong>2005</strong>.<br />
LUKOIL also increased its reserves by 108 million barrels through purchase of the remaining half of<br />
SeverTEK. The Company bought an interest in Geoilbent in <strong>2005</strong>, adding 55 million barrels to proved<br />
reserves, and proved reserves were increased by 3 million barrels thanks to consolidation of Tursunt.<br />
It is important to note that LUKOIL made significant additions to its probable and possible reserves in<br />
<strong>2005</strong>, creating major potential for increase of proved reserves in the future. Total increase of probable<br />
and possible reserves last year was 30%. A large part of this growth was due to discovery of the<br />
V. Filanovsky field and acquisition of Primorieneftegaz.<br />
Probable and possible reserves at the V. Filanovsky field are estimated at 600 million barrels of oil and 985<br />
billion cubic feet of gas (oil is 78% of the total). Additional exploration, preparation and confirmation of project<br />
documents, and preparatory work will allow a large part of the reserves to be re-classified as proved.<br />
Probable and possible reserves at the Tsentralno-Astrakhanskoye field are nearly 1.2 billion barrels of<br />
condensate and 9.8 trillion cubic feet of gas.<br />
29
<strong>ANNUAL</strong> <strong>REPORT</strong>, <strong>2005</strong><br />
LICENSING<br />
The Company strives to obtain new licenses for mineral resource exploitation, to extend the term of existing<br />
licenses up to field exhaustion, and to recast licenses as required by reorganization of subsidiaries.<br />
LUKOIL Group had 402 licenses on its balance at the start of 2006, of which 353 give rights to mineral<br />
resource exploitation and 49 are geological exploration licenses, including prospecting and assessment<br />
of mineral resources.<br />
In <strong>2005</strong> LUKOIL obtained five licenses for mineral resource exploitation at auctions, acquired four<br />
licenses by purchase of stakes in Geoilbent and Primorieneftegaz, extended the term of 33 licenses<br />
up to field exhaustion, and extended eight licenses to completion of geological study of the relevant<br />
territories. LUKOIL subsidiaries recast 42 licenses.<br />
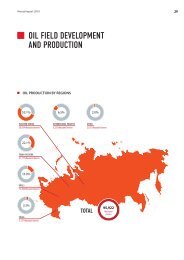
FIELD DEVELOPMENT AND OIL PRODUCTION<br />
2.2% of global oil production<br />
18.4% of Russian oil production<br />
Fourth biggest international publicly traded oil company by production of oil<br />
Sixth biggest international publicly traded oil company by production of hydrocarbons<br />
Oil production by LUKOIL Group in <strong>2005</strong> was 90.158 million tonnes (1.820 million barrels per day)*,<br />
including 86.193 million tonnes produced by subsidiaries. Average daily oil production by LUKOIL<br />
Group rose by 4.7%. Organic growth of production was 4.0%.<br />
The Group energetically pursued field preparation and production launches at new fields in Russia and<br />
abroad in <strong>2005</strong>. Fields in Timan-Pechora and the Northern Caspian were singled out for special attention.<br />
Group production companies implemented various measures to increase productivity of producing<br />
wells and oil recovery in order to meet oil production targets in <strong>2005</strong>.<br />
Subsidiaries and affiliates of the Group carried out production at 343 fields in <strong>2005</strong>. Development<br />
began at eight new oil fields: Dubravnoye and Rechnoye (Volga); Solovatovskoye, Chaikinskoye and<br />
Oil Production,<br />
million tonnes<br />
New Fields Put<br />
into Operation, fields<br />
Production Drilling,<br />
thousand meters<br />
95<br />
15<br />
14<br />
1,500<br />
1,453<br />
90<br />
86.2<br />
90.2<br />
10<br />
9<br />
1,400<br />
1,345<br />
85<br />
7<br />
1,300<br />
1,253<br />
80<br />
80.2<br />
5<br />
1,200<br />
75<br />
2003<br />
2004<br />
<strong>2005</strong><br />
0<br />
2003<br />
2004<br />
<strong>2005</strong><br />
1,100<br />
2003<br />
2004<br />
<strong>2005</strong><br />
* In accordance with US GAAP, including production by subsidiaries and share of production by affiliates.<br />
30
Alexandrovskoye (Urals); South Khulymskoye (Western Siberia); East Sarutayuskoye and Perevoznoye<br />
(Timan-Pechora). Proved, probable and possible reserves at the newly commissioned fields are<br />
707 million boe.<br />
Production drilling in <strong>2005</strong> totalled 1.453 million meters, representing an 8% increase from 2004. The<br />
Company made extensive use of the latest technologies for primary and secondary splitting of strata,<br />
enabling maximum well use and increase of well potential.<br />
The Group commissioned 558 new production wells and 376 injection wells. New commissioning<br />
included 41 horizontal wells, average daily flow rate of which is 11 times greater than the average figure<br />
for all Company wells. Oil production from new wells was 3.64 million tonnes.<br />
EXPLORATION & PRODUCTION<br />
Operating oil wellstock as of 1 January, 2006, totalled 27,350 wells of which 22,750 were producing,<br />
and the Group had 8,160 injection wells, of which 5,770 were under pressure. Operating oil wellstock<br />
Production Drilling by Regions (<strong>2005</strong>)<br />
Producing Oil Well<br />
Launches, wells<br />
Operating Oil Wellstock,<br />
thousand wells<br />
Bolshekhetskaya<br />
Depression 2.3%<br />
Other 3.1%<br />
600<br />
590<br />
27.4<br />
27.4<br />
Urals 6.0%<br />
Timan-<br />
Pechora 8.6%<br />
Volga 0.8%<br />
International<br />
projects 8.6%<br />
550<br />
558<br />
27.2<br />
27.2<br />
514<br />
27.0<br />
26.9<br />
500<br />
26.8<br />
Western<br />
Siberia 70.6%<br />
450<br />
2003<br />
2004<br />
<strong>2005</strong><br />
26.6<br />
2003<br />
2004<br />
<strong>2005</strong><br />
Oil Production by Regions<br />
Western Siberia<br />
58,468 th. tonnes<br />
64.9%<br />
International<br />
projects<br />
3,881 th. tonnes<br />
4.3%<br />
Other<br />
1,815 th. tonnes<br />
2.0%<br />
Oil<br />
100%<br />
Total<br />
90,158 th. tonnes<br />
Timan-Pechora<br />
12,477 th. tonnes<br />
13.8%<br />
Urals<br />
10,307 th. tonnes<br />
11.4%<br />
Volga<br />
3,210 th. tonnes<br />
3.6%<br />
31
<strong>ANNUAL</strong> <strong>REPORT</strong>, <strong>2005</strong><br />
increased by 1.5% compared with 2004, mainly due to acquisition of production assets. The share of<br />
idle wells in total operating wellstock declined from 17.9% to 16.8% thanks to Company efforts to<br />
improve production efficiency.<br />
The Company increased drilling of sidetracks at oil wells in <strong>2005</strong>. A total of 102 sidetracks were commissioned,<br />
giving 25 tonnes average daily production increase per well and 427,000 tonnes additional<br />
oil production. That compares with 63 new sidetracks in 2004, which gave average daily increase of<br />
22 tonnes per well and total additional production of 181,000 tonnes.<br />
Functioning of the Company's mechanized wellstock was optimized via 2,677 operations in <strong>2005</strong>, 110<br />
wells were transferred to mechanized production, and there were 5,052 operations to raise oil recovery.<br />
Overall efficiency gains from the operations equalled 30 million tonnes of oil.<br />
In <strong>2005</strong> the Group withdrew 425 marginal wells and wells with high water cut (average water cut<br />
equal to 98.7%) as part of the complex program for optimization of development and production of oil<br />
by LUKOIL in the period 2003–<strong>2005</strong>. This action, together with application of modern technologies for<br />
increasing oil recovery and drilling of horizontal wells and sidetracks, led to 3.5% average increase of<br />
daily flow from oil wells, to 11.1 tonnes, and prevented growth of the water-cut level in production.<br />
The action also saved extraction of 2.9 million tonnes of associated water, reducing energy costs. It is<br />
important to note that average daily flow rate from Company wells has been steadily increasing over<br />
recent years (from 8.6 tonnes in 2001 to 11.1 tonnes in <strong>2005</strong>).<br />
The new complex program for optimization of development and production of oil by LUKOIL in the<br />
period 2006–2008 was approved in <strong>2005</strong> and aims to further increase field development efficiency and<br />
to reduce operating expenses.<br />
Energetic development of new oil production regions and application of modern technologies enabled<br />
increase of average daily flow rate per new well to 41.9 tonnes. Average daily flow rate per horizontal<br />
well increased by 22.5% from 102 tonnes in 2004 to 125 tonnes in <strong>2005</strong>.<br />
Despite real appreciation of the rouble (supported by relatively high inflation in the Russian economy)<br />
the Company was able to rein growth of oil production costs, which were only 6.6% higher than<br />
Producing Oil Wellstock,<br />
thousand wells<br />
Drilling of Horizontal Wells,<br />
wells<br />
Drilling of Sidetracks,<br />
sidetracks<br />
22.8<br />
22.6<br />
22.8<br />
50<br />
40<br />
41<br />
120<br />
100<br />
102<br />
22.4<br />
22.2<br />
22.2<br />
22.1<br />
30<br />
20<br />
29<br />
80<br />
60<br />
40<br />
51<br />
63<br />
22.0<br />
10<br />
9<br />
20<br />
21.8<br />
2003<br />
2004<br />
<strong>2005</strong><br />
0<br />
2003<br />
2004<br />
<strong>2005</strong><br />
0<br />
2003<br />
2004<br />
<strong>2005</strong><br />
32
in 2004 and equalled $2.75 per barrel of production. Total lifting costs were $1,740 million. Capital<br />
expenditures in the Exploration & Production segment were $2,918 million, investments – $2,737 million.<br />
Russia<br />
Group subsidiaries and affiliates produced oil at 318 fields in Russia in <strong>2005</strong>, and Russian production drilling<br />
totalled 1.328 million meters. Wells in Russia account for 97.3% of total LUKOIL wellstock (26,620 wells)<br />
and 526 new wells were commissioned in <strong>2005</strong>. The new wells gave 3.38 million tonnes of production.<br />
EXPLORATION & PRODUCTION<br />
Overall lifting costs in Russia were $1,660 million in <strong>2005</strong> or $2.69 per barrel of oil produced. Capital<br />
expenditures were $2,487 million, and investments were $778 million.<br />
Russian production by LUKOIL Group in <strong>2005</strong> was 86.277 million tonnes, of which subsidiaries produced<br />
84.180 million tonnes. Average daily production in Russia rose by 4.6% y-o-y. Organic growth<br />
of average daily production was 4.1%.<br />
Western Siberia accounted for 67.8% of LUKOIL production in Russia in <strong>2005</strong>. Western Siberian fields<br />
also contributed the largest share of Russian production growth compared with 2004 (59.5% or 2.1<br />
million tonnes). In <strong>2005</strong> the Company continued to put in place a multi-level system of field development<br />
monitoring using geological-technological models. LUKOIL-Western Siberia made further use of<br />
techniques, which apply geological-technological models in mini-projects to optimize development of<br />
priority areas of major fields. These techniques gave positive results.<br />
There was also significant production growth of 0.7 million tonnes in Timan-Pechora, representing<br />
20.9% of total Russian production increase by the Company. The Company prepared new reserves in<br />
the north of Timan-Pechora in a short period, enabling start of oil production in that region. Two fields<br />
were brought into production: the East Sarutayuskoye and Perevoznoye fields, with proved, probable<br />
and possible reserves of 624 million barrels.<br />
33
<strong>ANNUAL</strong> <strong>REPORT</strong>, <strong>2005</strong><br />
Creation of the joint venture between LUKOIL and ConocoPhillips based on assets of Naryanmarneftegaz<br />
was completed in <strong>2005</strong>. The joint venture retained the name 'Naryanmarneftegaz' and is focused on<br />
development of fields in northern Timan-Pechora. It has taken control of 16 fields with proved, probable<br />
and possible reserves of 2.7 billion barrels. The venture produced 600,000 tonnes in <strong>2005</strong> at five fields:<br />
Toboiskoye; Toraveiskoye; Varandeyskoye; Myadseyskoye; and Perevoznoye, which was brought into production<br />
in <strong>2005</strong>. Naryanmarneftegaz is currently preparing to start production at nine more fields.<br />
Production at the Kravtsovskoye field in the Baltic Sea, which was commissioned in 2004, grew rapidly<br />
in <strong>2005</strong>. Output was 562,000 tonnes, which is 16% more than had been forecast. Growth of output<br />
at the Kravtsovskoye field represented 13.6% of overall growth of Company oil production in<br />
Russia in <strong>2005</strong>.<br />
Work continued in <strong>2005</strong> on preparing Caspian offshore fields for development. Russian supervisory<br />
bodies have approved an investment plan for preparation of the Yu. Korchagin field. Technological<br />
schemes for development of the Rakushechnoye, Sarmatskoye and 170th kilometer fields have also<br />
been approved. Work on planning and construction of an onshore production and transport base have<br />
been carried out in order to ensure supply of material and technical resources to the offshore fields.<br />
LUKOIL continued to consolidate and acquire highly efficient assets in Russia in <strong>2005</strong>. Purchases<br />
included the remaining half of SeverTEK, whose total production in <strong>2005</strong> was 1.508 million tonnes, of<br />
which the LUKOIL share was 816,000 tonnes. Tursunt, with annual production of 385,000 tonnes of<br />
which the LUKOIL share was 280,000 tonnes, was also consolidated. LUKOIL bought a 66% interest<br />
in Geoilbent, whose production in <strong>2005</strong> was 1.064 million tonnes, of which the LUKOIL share was<br />
353,000 tonnes. The new acquisitions increase LUKOIL daily production by 37,000 boe (data are for<br />
December <strong>2005</strong>, not taking account of any future production increases from the relevant assets).<br />
International Projects<br />
The LUKOIL share of production in international projects in <strong>2005</strong> was 3.881 million tonnes. Average daily<br />
production in international projects rose by 11.8% and organic growth of daily production was 1.4%.<br />
Production drilling in the Company's international projects was 125,000 meters. Operating oil wellstock<br />
totalled 735 wells, of which 600 were in production. 32 new production wells were commissioned<br />
in <strong>2005</strong>. The new wells gave 0.26 million tonnes of additional oil production.<br />
Overall spending on oil production as part of international projects was $80 million or $5.43 per barrel,<br />
and capital expenditure was $431 million, and investments were $1,959 million.<br />
LUKOIL lends special importance to development of its international business. The Company's international<br />
portfolio in <strong>2005</strong> consisted of seven projects for field development and production of oil and<br />
gas condensate. Five projects actually produced oil and gas condensate in <strong>2005</strong>: Karachaganak,<br />
Kumkol and Tengiz (in Kazakhstan); and Meleiha and WEEM (in Egypt). Other projects were at the<br />
stage of field preparation and pre-production work.<br />
34
In <strong>2005</strong> LUKOIL acquired the Canadian company Nelson Resources Limited, which has a 50% stake in<br />
three PSAs in Kazakhstan: Kazakhoil-Aktobe (the Alibekmola and Kozhasai fields); Buzachi Operating<br />
(the North Buzachi field); Arman (the Arman field); and a 76% stake in the joint venture KarakudukMunai<br />
(the Karakuduk field). Nelson Resources Limited also has an option to acquire 25% stakes in two geological<br />
exploration blocks in the Kazakh sector of the Caspian Sea from KazMunaiGaz. These are the<br />
South Zhambai and South Zaburuniye blocks. The Company's international portfolio has thus added four<br />
more projects. Oil production by these projects in <strong>2005</strong>, as per the LUKOIL share, was 1.608 million<br />
tonnes. Consolidation of production as part of these projects was begun in mid-October <strong>2005</strong>.<br />
EXPLORATION & PRODUCTION<br />
In <strong>2005</strong> LUKOIL decided to exit the Zykh-Govsany project and agreed such exit with the Azerbaijani<br />
National Oil Company. The decision was taken due to high required spending for environmental rehabilitation<br />
of the contract territory and high level of reserve exhaustion.<br />
Building of production facilities and drilling of new wells proceeded successfully in <strong>2005</strong> at the Kumkol field<br />
in Kazakhstan. Production began at 12 new wells with average daily flow rate of 16.6 tonnes. A project was<br />
also prepared for construction of an LNG plant with annual capacity up to 300 million cubic meters of gas.<br />
A program for drilling of multilateral wells was completed at the huge Karachaganak field. Two multilateral<br />
wells with average daily flow rate of 1,013.5 tonnes were drilled. Production of stable condensate<br />
reached the target level of 153,000 barrels per day. A project was prepared for construction of a<br />
150-km trunk gas pipeline from Karachaganak to Uralsk to achieve complete gasification of West<br />
Kazakhstan Region. The LUKOIL share in the project is 15%.<br />
Four new oil wells with average daily flow of 69.3 tonnes were commissioned as part of the WEEM project.<br />
FIELD DEVELOPMENT AND GAS PRODUCTION<br />
The LUKOIL gas program is based on rapid increase of gas production in coming years both in Russia<br />
and abroad and growth in the share of gas to 33% of total hydrocarbon production by the Group. For<br />
this purpose in <strong>2005</strong> LUKOIL worked to prepare fields in the Bolshekhetskaya Depression for production<br />
and continued development of fields in the Caspian Sea. These regions are intended to be the key<br />
to development of gas production by LUKOIL Group.<br />
Operating Gas Wellstock,<br />
wells<br />
Producing Gas Wellstock,<br />
wells<br />
Gas Production,<br />
billion cubic meters<br />
380<br />
260<br />
8<br />
7.6<br />
360<br />
365<br />
250<br />
250<br />
6<br />
5.7<br />
6.5<br />
340<br />
240<br />
239<br />
4<br />
320<br />
313<br />
317<br />
230<br />
231<br />
2<br />
300<br />
2003<br />
2004<br />
<strong>2005</strong><br />
220<br />
2003<br />
2004<br />
<strong>2005</strong><br />
0<br />
2003<br />
2004<br />
<strong>2005</strong><br />
35
<strong>ANNUAL</strong> <strong>REPORT</strong>, <strong>2005</strong><br />
Gas Production by Regions<br />
Western Siberia<br />
3,341 mcm<br />
44.2%<br />
International<br />
projects<br />
1,835 mcm<br />
24.2%<br />
Other<br />
20 mcm<br />
0.3%<br />
Gas<br />
100%<br />
Total<br />
7,569 mcm<br />
Timan-Pechora<br />
833 mcm<br />
11.0%<br />
Urals<br />
909 mcm<br />
12.0%<br />
Volga<br />
631 mcm<br />
8.3%<br />
Gas production by LUKOIL in <strong>2005</strong> was 7,569 million cubic meters (732 million cubic feet per day)*,<br />
of which 7,267 million cubic meters was produced by subsidiaries. Average daily production by the<br />
Company rose by 17.3% compared with 2004.<br />
Production of natural gas was 2,628 million cubic meters, representing an increase of 43.8% compared<br />
with 2004. The share of associated gas in total production was 65.3% or 4,941 million cubic<br />
meters.<br />
Utilization rate of associated gas was 79%, which is unchanged from 2004. The Company is building<br />
gas turbine power generating stations adjacent to gas flares at its fields in order to increase use of<br />
associated gas. This will reduce gas flaring, lower spending on electricity and thus cut oil production<br />
costs. The Company is implementing a program of measures to increase rates of associated gas use<br />
at LUKOIL enterprises to 95%.<br />
The Company's operating gas wellstock at the end of <strong>2005</strong> consisted of 365 wells, of which 239 were<br />
in production.<br />
Russia<br />
Gas production in Russia in <strong>2005</strong> was 5,734 million cubic meters, of which 5,659 million cubic meters<br />
were produced by subsidiaries. Natural gas production was 1,022 million cubic meters and associated<br />
gas production was 4,712 million cubic meters, or 82.2% of the Group's Russian total. The utilization<br />
rate of associated gas at Russian fields was 79%. Operating gas well stock at the end of <strong>2005</strong><br />
was 302 wells, of which 194 were in production.<br />
* In accordance with US GAAP, including production by subsidiaries and share of production by affiliates. Natural gas output includes natural<br />
gas for sales, own consumption and reinjection, as well as technological losses.<br />
36
The Company continued work on preparation of gas fields in the Bolshekhetskaya Depression in <strong>2005</strong>.<br />
A landmark event in April was commissioning of the Nakhodkinskoye gas field at which 472 million<br />
cubic meters of natural gas were produced in <strong>2005</strong>. Launch of production at this field marks activation<br />
of the LUKOIL gas program. A total of 60 wells will be drilled at the Nakhodkinskoye field. Planned<br />
annual production level of 10 billion cubic meters should be achieved in 2008. All of the gas produced<br />
at the field is bought by Gazprom at the Yamburg Compressor Station settlement point at a price of<br />
$22.5 per 1,000 cubic meters. This is a fixed price, which will remain applicable until the end of 2006.<br />
In March <strong>2005</strong> LUKOIL and Gazprom signed a General Agreement on Strategic Partnership in<br />
<strong>2005</strong>–2014. The Agreement provides for joint realization of projects for exploration and development<br />
of oil & gas fields in the Yamal-Nenets Autonomous District, the Nenets Autonomous District, the<br />
Russian sector of the Caspian Sea, the Republic of Uzbekistan and other regions. The Agreement also<br />
envisages development of cooperation in sea transport of oil & gas condensate from northern regions<br />
of the Nenets and Yamal-Nenets Autonomous Districts. The parties will continue to support existing<br />
partnership in supply of hydrocarbons and petro- and gas-chemical production, as well as placing available<br />
resources of oil & gas condensate at their own gas processing and oil refining enterprises in<br />
Russia and abroad.<br />
EXPLORATION & PRODUCTION<br />
Following acquisition of Geoilbent in <strong>2005</strong> LUKOIL developed a concept for production of natural and<br />
associated gas at Geoilbent fields and submitted a request to Gazprom to obtain technical conditions<br />
for connection of the fields to the Gazprom transport system.<br />
Preparations continued in <strong>2005</strong> for the start of gas production at Northern Caspian fields. LUKOIL carried<br />
out work with Kazakh partners (based on the Russian-Kazakh governmental agreement for dividing<br />
the Caspian seabed) to prepare joint development of the Khvalynskoye field. A development plan<br />
has been prepared, PSA conditions are being negotiated, and the Caspian Oil & Gas Company has been<br />
registered in Astrakhan to implement the development. Executive and supervisory agencies in<br />
Astrakhan Region have approved a declaration of intent to build a gas pipeline for transport of low-sulfur<br />
natural gas from the Khvalynskoye field and associated gas from the Yu. Korchagin field to coastal<br />
facilities in Astrakhan Region.<br />
International Projects<br />
LUKOIL took part in three international gas production projects in <strong>2005</strong>: Karachaganak, Kumkol and<br />
Tengiz (Kazakhstan).<br />
The Company's share in gas production by these projects was 1,835 million cubic meters. Natural gas<br />
represented 87.5% of the total.<br />
Operating gas wellstock in these projects consisted of 63 wells, and 45 wells were in production.<br />
Construction of a TPG-500 production platform, underwater pipelines and the South-Caucasus Gas<br />
Pipeline (Baku–Tbilisi–Erzerum) was completed as part of the Shakh-Deniz offshore project. Start of<br />
gas production is scheduled for the third quarter of 2006.<br />
37
KAZAKHSTAN<br />
Kumkol<br />
50%<br />
LUKOIL INTERNATIONAL<br />
EXPLORATION & PRODUCTION PROJECTS<br />
(as of January 1, 2006)<br />
AZERBAIJAN<br />
Shakh-Deniz<br />
10%<br />
KAZAKHSTAN<br />
Karachaganak<br />
KAZAKHSTAN<br />
Tengiz<br />
15%<br />
2.7%<br />
AZERBAIJAN<br />
D-222<br />
80%<br />
KAZAKHSTAN<br />
Tyub-Karagan<br />
50%<br />
KAZAKHSTAN<br />
Atashsky<br />
50%<br />
KAZAKHSTAN<br />
Kazakhoil-Aktobe<br />
50%<br />
COLOMBIA<br />
Condor<br />
70%<br />
KAZAKHSTAN<br />
Buzachi Operating<br />
50%<br />
VENEZUELA<br />
Junin-3<br />
KAZAKHSTAN<br />
KarakudukMunai<br />
76%<br />
KAZAKHSTAN<br />
Arman<br />
50%<br />
EGYPT<br />
West Geisum<br />
100%<br />
UZBEKISTAN<br />
Kandym – Khauzak – Shady<br />
90%<br />
70%<br />
Share of LUKOIL<br />
Group<br />
EGYPT<br />
North-East Geisum<br />
100%<br />
IRAN<br />
Anaran<br />
25%<br />
Oil<br />
Gas<br />
Exploration<br />
EGYPT<br />
WEEM<br />
100%<br />
IRAQ<br />
West Qurnah-2<br />
68.5%<br />
Production<br />
EGYPT<br />
Meleiha<br />
24%<br />
SAUDI ARABIA<br />
Block A<br />
80%<br />
38 39
OIL DELIVERIES<br />
Growth of export duties and rises in domestic oil prices made oil exports less attractive in <strong>2005</strong>. This<br />
freed more crude oil volumes for supply to oil refineries owned by the Group in Russia and for processing<br />
at third-party Russian refineries. The Group refined 38.9 million tonnes of oil in Russia in <strong>2005</strong><br />
compared with 35.6 million tonnes in 2004. In addition, the Group sold 0.7 million tonnes of oil in<br />
Russia in <strong>2005</strong>, which is almost 60% less than in 2004. Purchases of oil by the Group inside Russia<br />
were 1.5 million tonnes in <strong>2005</strong> (2.8 million tonnes in 2004). The gain from quick reaction by the Group<br />
to increased efficiency of oil supplies to the domestic market was about $150 million.<br />
Export of oil by LUKOIL subsidiaries (including oil bought from other producers) declined by 1% compared<br />
with 2004 to 45.8 million tonnes, of which 40.1 million tonnes were exported to far-abroad countries<br />
and 5.7 million tonnes to the near-abroad countries. Oil deliveries to far-abroad countries via the<br />
Druzhba oil pipeline grew by 21% compared with 2004 to 16.2 million tonnes.<br />
Most exports in <strong>2005</strong> were via the Transneft transport system, equalling to 38.5 million tonnes (1%<br />
less than in 2004). LUKOIL also used alternative export schemes in <strong>2005</strong>, including its own oil refinery<br />
infrastructure. Use of these schemes enabled export of 7.3 million tonnes of oil in <strong>2005</strong>, which is<br />
1.4% less than in 2004.<br />
Increased attractiveness of oil deliveries to the domestic market led to considerable reduction of deliveries<br />
using the Company's own refinery infrastructure and Transneft loading racks. One aspect of this<br />
was gradual reduction of monthly oil deliveries to China from 250,000 tonnes to zero. Export deliveries<br />
via the port of Vysotsk, which were 385,000 tonnes per month in April–May, were reduced to<br />
200,000 tonnes in June and were suspended from August <strong>2005</strong>. Export crude deliveries using<br />
Company refinery infrastructure and Transneft loading racks were completely halted at the end of<br />
<strong>2005</strong> due to low efficiency. As a result these supplies were only 4.5 million tonnes in <strong>2005</strong>, which is<br />
12.7% less than in the previous year.<br />
13.4<br />
40 OIL EXPORTS<br />
(million tonnes)
<strong>ANNUAL</strong> <strong>REPORT</strong>, <strong>2005</strong><br />
Main oil export routes of LUKOIL Group<br />
Murmansk<br />
Vitino<br />
Varandey<br />
Vysotsk<br />
Primorsk<br />
Butinge<br />
Svetly<br />
Poland<br />
Germany<br />
Czech Republic<br />
Slovakia<br />
Hungary<br />
Odessa<br />
Novorossiysk<br />
Tuapse<br />
Work was carried out in <strong>2005</strong> to increase efficiency of pipeline exports of crude oil. Contract price<br />
increases of up to 30 cents per barrel were achieved on some export routes, giving extra revenues of<br />
about $25 million.<br />
A more efficient pricing formula for deliveries to the Mazeikiu Refinery in Lithuania, negotiated at the<br />
start of <strong>2005</strong>, led to increase of export deliveries to that Refinery by 330% in <strong>2005</strong> to 2.4 million tonnes.<br />
Using its quota as a shareholder of the Caspian Pipeline Consortium (CPC) the Company continued<br />
deliveries of its own Western Siberian and Lower Volga crude through the CPC in <strong>2005</strong> for export via<br />
the South Ozereyevka terminal. Deliveries were 1.4 million tonnes, which is 9 times more than in<br />
2004. LUKOIL also continued to export its shares of production at the Karachaganak, Kumkol and<br />
Tengiz fields in Kazakhstan through the CPC.<br />
Deliveries of oil to foreign refineries of LUKOIL Group grew significantly compared with 2004 due to<br />
re-commissioning of the Petrotel-LUKOIL Refinery in Romania after a reconstruction. In total the Group<br />
refined 11.2 million tonnes of oil outside Russia (including processing of its<br />
Oil Exports,<br />
oil at refineries not owned by the Group), compared with 9.4 million tonnes<br />
million tonnes<br />
in 2004. The Group sold 45.9 million tonnes of oil on international markets<br />
50<br />
46.3<br />
(including the near-abroad countries) in <strong>2005</strong>, which is equal to the level of<br />
45.8<br />
2004. Oil purchases on international markets were 9.4 million tonnes.<br />
40<br />
38.1<br />
30<br />
20<br />
10<br />
Export delivery arrangements via the Black Sea to Group refineries outside<br />
Russia were improved by creation of a unified system for monitoring<br />
of available tonnage and refinery needs. The system enables monthly<br />
freight cost savings of about $1 million for the Group.<br />
0<br />
2003<br />
2004<br />
<strong>2005</strong><br />
Thus, total oil deliveries by LUKOIL Group were 96.7 million tonnes in <strong>2005</strong>.<br />
42
The Company continued to develop its own export terminals in <strong>2005</strong>, enabling substantial reduction<br />
of transport costs and making transport arrangements more flexible.<br />
Construction of a terminal at Vysotsk in the North-West of Russia began in June 2002. The first stage<br />
of the terminal was commissioned in May 2004. In <strong>2005</strong> the second stage was built and preparations<br />
were made for construction of a third stage. Annual capacity at Vysotsk after commissioning of the<br />
third stage will be 14.9 million tonnes (capacity at the start of 2006 was 10.7 million tonnes). The harbour<br />
was deepened in <strong>2005</strong> to accommodate ships with deadweight up to 80,000 tonnes, giving a substantial<br />
saving on transport costs. The terminal can handle crude oil, fuel oil, vacuum gasoil and diesel.<br />
OIL DELIVERIES<br />
LUKOIL has built a unique terminal facility at Vysotsk in a very short period of time, enabling the<br />
Company to halt inefficient deliveries via ports in the Baltic republics, to significantly increase capacity<br />
for export of oil and petroleum products, and achieve major savings on transport costs.<br />
The Vysotsk terminal shipped 1.7 million tonnes of oil, 2.5 million tonnes of vacuum gasoil and 2.7 million<br />
tonnes of diesel in <strong>2005</strong>. Total shipments were 6.9 million tonnes, which is 4.4 times more than in 2004.<br />
LUKOIL's terminal at the port of Svetly was commissioned in 2002 and is used for export shipment of oil<br />
produced in Kaliningrad Region and of petroleum products. The terminal has annual capacity for 6 million<br />
tonnes of oil and petroleum products and can accommodate tankers with deadweight up to 20,000 tonnes.<br />
A system introduced at the terminal in <strong>2005</strong> increased shipment of base lubricants and diesel fuel.<br />
The terminal shipped 1.5 million tonnes of oil and 3.1 million tonnes of petroleum products in <strong>2005</strong><br />
(including 1.6 million tonnes of products owned by third parties). Total deliveries through the terminal<br />
increased by 18% compared with 2004.<br />
The Varandey terminal on the Barents Sea with annual crude oil capacity of 1.5 million tonnes was<br />
commissioned in 2000. The terminal is connected to onshore oil reservoirs by an underwater pipeline.<br />
Varandey carries out year-round deliveries from the Timan-Pechora oil & gas province, supplying the<br />
oil to international markets including the USA. The terminal was built in response to production growth<br />
in the region and lack of developed transport infrastructure.<br />
Work continued in <strong>2005</strong> to expand the terminal's annual capacity to 12 million tonnes. This is a joint<br />
project between LUKOIL and ConocoPhillips, and completion is scheduled in 2008. The new navigable<br />
waterway near Varandey Island was deepened in <strong>2005</strong> and preparations were made for operating<br />
shuttle tankers, an ice breaker and an ancillary tug, which will carry oil and service the Varandey loading<br />
terminal.<br />
After its expansion the terminal will be able to handle reinforced ice-class tankers with deadweight up<br />
to 70,000 tonnes. A plan is being considered for shuttle deliveries of crude oil from the terminal to a<br />
roads trans-shipment complex near Murmansk, from where the oil will be carried by tankers with<br />
deadweight up to 180,000 tonnes to Rotterdam and the US eastern seaboard.<br />
Trans-shipment of oil through the Varandey terminal was 592,000 tonnes in <strong>2005</strong>, which is equal to<br />
the level of 2004.<br />
43
47.6<br />
REFINING, PETROCHEMICALS AND MARKETING<br />
Strategy<br />
42.3<br />
Production of high-quality, environmentally friendly petroleum products with high value-added<br />
Increase of light products yield<br />
Control of production costs<br />
38.1<br />
Optimizing logistics to reduce transport costs<br />
Increasing efficiency of trade operations<br />
Increasing retail sales of petroleum products and related products and services<br />
REFINING<br />
1.4% of global oil refining capacity<br />
1.3% of global refining<br />
15.7% of Russian oil refining capacity<br />
18.0% of Russian oil refining<br />
29.2<br />
18.6<br />
19.0 18.9<br />
44 REFINERY THROUGHPUTS<br />
(million tonnes)<br />
1993<br />
1995<br />
1997<br />
1999<br />
2001<br />
2003<br />
<strong>2005</strong>
<strong>ANNUAL</strong> <strong>REPORT</strong>, <strong>2005</strong><br />
LUKOIL Group refineries<br />
Odessa<br />
Refinery<br />
(Ukraine)<br />
3.2<br />
Petrotel-LUKOIL<br />
(Romania)<br />
9.9<br />
3.9<br />
1.39<br />
2.4<br />
2.41<br />
Nizhny Novgorod<br />
Refinery<br />
3.8<br />
15.0<br />
13.47<br />
Ukhta<br />
Refinery<br />
2.5<br />
3.7<br />
3.41<br />
Perm<br />
Refinery<br />
8.0<br />
Mini refineries<br />
in Uray and<br />
Kogalym<br />
12.1<br />
10.98<br />
0.4<br />
0.21<br />
LUKOIL<br />
Neftokhim Burgas<br />
(Bulgaria)<br />
8.0<br />
10.5<br />
6.45<br />
Volgograd<br />
Refinery<br />
5.3<br />
10.5<br />
9.23<br />
Total,<br />
Total,<br />
foreign<br />
Russian<br />
refineries 16.8 refineries 41.7 Total<br />
58.5<br />
10.25 37.30<br />
47.55 Nelson<br />
Index<br />
Capacity,<br />
mln tonnes per year<br />
Refining in <strong>2005</strong>,<br />
mln tonnes<br />
Results in the Refining & Marketing segment were outstanding in <strong>2005</strong>. Net income in this segment<br />
reached $3,059 million. Refinery throughputs rose by 8.0% from 44.03 million tonnes to<br />
47.55 million tonnes (the increase including processing at third-party refineries was 11.3% to 50.4<br />
million tonnes).<br />
The Company increased production of high-quality motor fuels as part of the program of refinery<br />
modernization and reconstruction, on which LUKOIL spent $412 million in <strong>2005</strong>.<br />
As part of optimization of LUKOIL business organization all Company refineries have stopped operating<br />
on the processing basis as of 1 January, <strong>2005</strong> and now buy all the crude, which they refine. This<br />
change has raised efficiency of LUKOIL refining business.<br />
Oil Refining by LUKOIL,<br />
million tonnes<br />
60<br />
50<br />
40<br />
43.5<br />
1.2<br />
8.0<br />
45.3<br />
1.3<br />
8.5<br />
50.4<br />
2.8<br />
10.3<br />
Share of Diesel Fuel with<br />
Maximum 0.05% Sulfur<br />
Content in Total<br />
Diesel Production, %<br />
65<br />
45<br />
42.0<br />
61.8<br />
Share of High-octane<br />
Gasoline in Total<br />
Gasoline Production, %<br />
85<br />
65<br />
66.4<br />
72.2<br />
79.5<br />
30<br />
45<br />
20<br />
10<br />
34.3<br />
35.5<br />
37.3<br />
25<br />
23.9<br />
25<br />
0<br />
2003<br />
2004<br />
<strong>2005</strong><br />
5<br />
2003<br />
2004<br />
<strong>2005</strong><br />
5<br />
2003<br />
2004<br />
<strong>2005</strong><br />
At third-party refineries<br />
At the Company’s foreign refineries<br />
At the Company’s Russian refineries<br />
46
Russia<br />
Growth of export duties in <strong>2005</strong> made oil export less attractive and increased Russian refining margins.<br />
The Company therefore directed larger quantities of oil to its own refineries and for processing<br />
to third-party refineries in Russia.<br />
As a result refining volumes at the Company's Russian refineries increased by 4.9% to 37.3 million<br />
tonnes. The Company also obtained quotas for refining of oil at the Ufa Refinery, to which it<br />
despatched 1.63 million tonnes of oil.<br />
Continuing modernization of LUKOIL's Russian refineries has enabled increase by 4.1 times in output of highquality<br />
diesel fuel, which meets the most stringent current environmental requirements (Euro-3, Euro-4, and<br />
Euro-5). Output of diesel fuel to these standards was 5.2 million tonnes in <strong>2005</strong>, representing 50.7% of total<br />
diesel production by Russian refineries of the Group. In <strong>2005</strong> LUKOIL became the first Russian oil company<br />
to launch large-scale production and sale of Euro-4 diesel fuel with improved environmental characteristics.<br />
This fuel meets EN-590:2004 standards for diesel fuel, which have been in force in the EU since <strong>2005</strong>.<br />
LUKOIL Euro-4 diesel fuel is produced at three Company refineries (Perm, Nizhny Novgorod and Ukhta) and<br />
total production in <strong>2005</strong> was 3.97 million tonnes. Construction of a second stage of the hydrotreatment facility<br />
at the Volgograd Refinery and reconstruction of the hydrotreatment facility at the Nizhny Novgorod<br />
Refinery will enable complete changeover of the Group's Russian refineries to Euro-4 diesel production.<br />
REFINING, PETROCHEMICALS AND MARKETING<br />
The share of high-octane gasoline in total production of motor gasolines by the Group's Russian<br />
refineries rose from 61.0% in 2004 to 68.7% in <strong>2005</strong>. Depth of oil refining rose from 75.4% to 77.3%<br />
and light products yield increased from 50.4% to 51.1%. Capital expenditures on modernization of<br />
Russian refineries in <strong>2005</strong> were $307 million.<br />
LUKOIL's Russian refineries took steps in <strong>2005</strong> to reduce operating costs and raise their operating and<br />
financial efficiency. The average number of workers at these refineries decreased by 6.3% in <strong>2005</strong><br />
compared with 2004. Savings from cost reduction measures were in excess of $37 million.<br />
In August <strong>2005</strong> the Volgograd Refinery commissioned the first stage of a petroleum coke calcination<br />
facility with 100,000 tonnes annual capacity. Capital expenditures for completion of the first stage were<br />
Lubricants Production,<br />
thousand tonnes<br />
Packaged Lubricants<br />
Production,<br />
thousand tonnes<br />
Petroleum Product Exports, %<br />
1,500<br />
1,000<br />
1,220<br />
1,199<br />
1,159<br />
200<br />
150<br />
112<br />
142<br />
174<br />
100<br />
80<br />
60<br />
100<br />
500<br />
50<br />
40<br />
20<br />
0<br />
2003<br />
2004<br />
<strong>2005</strong><br />
0<br />
2003<br />
2004<br />
<strong>2005</strong><br />
0<br />
2003<br />
2004<br />
<strong>2005</strong><br />
Other<br />
Fuel oil<br />
Vacuum gasoil<br />
Diesel fuel<br />
Straight-run gasoline<br />
47
<strong>ANNUAL</strong> <strong>REPORT</strong>, <strong>2005</strong><br />
$18 million. Launch of the facility enables the Refinery to produce high-quality calcinated coke, which is<br />
a saleable product used in aluminum smelting (without need for further processing). In addition, use of<br />
hot gases emitted in the calcination process partially covers the Refinery's heat needs. Commissioning<br />
of the second stage of the facility is scheduled in 2009. It will raise annual capacity to 280,000 tonnes,<br />
enabling calcination of the entire volume of petroleum coke produced at the Refinery.<br />
Work continued on a new catalytic reforming complex at Volgograd with 1 million tonnes annual<br />
capacity. The complex is due for completion in the third quarter of 2006 and it will increase the<br />
Refinery's output of high-octane gasolines, demand for which is growing rapidly.<br />
Documentation was also prepared in <strong>2005</strong> for installation of an isomerization unit at the Volgograd<br />
Refinery. Commissioning of the unit, with annual capacity of 385,000 tonnes, is scheduled for the<br />
fourth quarter of 2007, and it will enable the Refinery to start production of high-octane gasolines to<br />
Euro-3 and Euro-4 standards.<br />
Specialists at the Perm Refinery designed and implemented a number of measures in <strong>2005</strong> to ensure<br />
stable and efficient functioning of the deep refining complex at Perm.<br />
Overhaul of the vacuum unit on Atmospheric and Vacuum Distillation Unit-4 was completed, enabling<br />
deep vacuum refining of fuel oil in order to increase hydrocracking inputs. Commissioning of the unit<br />
after its overhaul gave additional 240,000 tonnes annual volumes of vacuum gasoil for hydrocracking.<br />
The Perm Refinery also commissioned an assembly for injection of additives to diesel fuel on the hydrodearomatization<br />
unit, so that all diesel fuel produced at Perm now meets the European EN-590 standard.<br />
The atmospheric distillation unit at the Nizhny Novgorod Refinery was supplemented by a vacuum<br />
distillation unit in <strong>2005</strong>, increasing output of vacuum gasoil. Further installation of bitumen visbreaking<br />
and catalytic cracking facilities will mean that the Refinery can produce all of the inputs to its vacuum<br />
gasoil hydrotreatment facility.<br />
48
The catalytic reforming unit was overhauled in <strong>2005</strong> to allow isomerization. The work was completed<br />
in the first quarter of 2006, allowing production of motor gasolines to Euro-3 standards.<br />
These gasolines have improved density and better fractional and hydrocarbon content in order to<br />
meet the needs of modern vehicle engines. They satisfy the latest international environmental<br />
standards for fuels.<br />
LUKOIL began complex reconstruction and modernization of the Nizhny Novgorod Refinery in <strong>2005</strong><br />
and the process is due for completion in 2009. Total capital expenditures on this project are estimated<br />
at $600 million, most of which will be spent on construction of catalytic cracking, alkylation and visbreaking<br />
units.<br />
Planning and research work was carried out in <strong>2005</strong> for construction of a deep refining complex at<br />
Nizhny Novgorod, based on the unit for catalytic cracking of vacuum gasoil. The complex is due to be<br />
commissioned in 2009.<br />
REFINING, PETROCHEMICALS AND MARKETING<br />
The Ukhta Refinery commissioned a Recovery Plus module to increase hydrogen concentration in<br />
the hydrodeparaffinization unit. The unit can now produce up to 250,000 tonnes of Arctic diesel fuel<br />
per year. The Recovery Plus module can also extract up to 13,000 tonnes per year of high-octane light<br />
reformate (С 4 -С 5 fractions) from hydrogen-rich gas. This reformate is a valuable component for blending<br />
of gasolines.<br />
Work continued in <strong>2005</strong> on the second stage of a rail loading-rack complex for unloading of crude oil<br />
and loading of dark petroleum products. The work is due for completion in the third quarter of 2006<br />
and the rack will have 4 million tonnes annual capacity.<br />
The Ukhta Refinery also began technical refitting of its catalytic reforming unit in <strong>2005</strong>. The work will<br />
be completed in the third quarter of 2006 and will reduce gasoline production costs.<br />
49
<strong>ANNUAL</strong> <strong>REPORT</strong>, <strong>2005</strong><br />
International<br />
Throughputs at LUKOIL foreign refineries were 10.25 million tonnes in <strong>2005</strong> (including 273,000 tonnes<br />
of fuel oil), which is an increase of 1.77 million tonnes, or 20.9%, compared with 2004.<br />
Average refining depth at foreign refineries increased to 77.5% (70.5% in 2004). Light product yield<br />
was 60.9% (56.3% in 2004). Irretrievable crude losses at foreign refineries declined from 1.20% in<br />
2004 to 1.07% in <strong>2005</strong>, saving $5 million. The share of high-octane gasolines in total motor gasoline<br />
output rose from 97.3% in 2004 to 98.6% in <strong>2005</strong>. The positive trends were mainly due to re-commissioning<br />
at the end of 2004 of the Company's Romanian refinery, Petrotel-LUKOIL, following major<br />
reconstruction work. Capital expenditures on modernization of LUKOIL's foreign refineries were $105<br />
million in <strong>2005</strong>", and investments were $66 million.<br />
The Burgas Refinery in Bulgaria carried out reconstruction of the regenerator on its catalytic cracking<br />
unit. This work regulated the heat balance and increased recovery of the desired cut. The<br />
Refinery also launched a new system that allows its power generating facilities to switch between<br />
heating fuel and natural gas, depending on which is cheaper at any time. In January <strong>2005</strong> Burgas<br />
began production of diesel fuel and gasoline with sulfur content below 50 ppm, complying with<br />
Euro-4 standards.<br />
The Odessa Refinery completed reconstruction of its desalting and atmospheric and vacuum distillation<br />
unit in <strong>2005</strong>, increasing annual crude capacity to 2.4 million tonnes. Irretrievable crude losses<br />
were reduced to 0.69%, saving $300,000. As part of the integration arrangement for deep refining at<br />
LUKOIL's foreign refineries, Odessa supplied 273,000 tonnes of fuel oil to the Burgas Refinery. These<br />
operations give a major synergy effect by using the Company's Ukrainian and Bulgarian refinery facilities<br />
in a single production chain.<br />
The Odessa Refinery has been closed since July <strong>2005</strong> for large-scale reconstruction, centred on installation<br />
of a catalytic cracking complex and power generating facilities. The work is expected to cost<br />
$320 million and will take 5 years to complete. Annual crude refining capacities will be kept at 2.8 million<br />
tonnes, and production of fuel oil will be reduced while output of products with high value added<br />
will increase.<br />
The Petrotel-LUKOIL Refinery reopened at the end of 2004 after a 3-year upgrade and achieved efficiency<br />
targets in <strong>2005</strong>. Light petroleum product yield increased to 75.5% compared with 68.5% in<br />
2000, refining depth increased to 94.9% from 86.7% in 2000, and irretrievable crude losses declined<br />
to 0.93% from 2.06% in 2000. The Refinery produces diesel fuel and gasoline to Euro-3 and Euro-4<br />
standards, adjusting its product mix to match demand on the market.<br />
In order to improve product quality and save crude the Refinery installed a drying system with mole<br />
sieve for inputs on the isomerization unit. The Refinery also injected additives for secondary burning<br />
and raising octane number in the catalytic cracking unit in order to stabilize the unit's operation. The<br />
octane number of produced gasoline was thus raised by one point.<br />
50
GAS PROCESSING<br />
The Company's gas-processing plants convert associated gas, produced by the Company in Russia,<br />
into saleable gas, which is fed into the Gazprom transport system. The plants also produce liquid<br />
hydrocarbons.<br />
LUKOIL's gas-processing plants processed 2.691 billion cubic meters of gas and 479,000 tonnes of<br />
natural gas liquids in <strong>2005</strong>. They produced 2.192 billion cubic meters of gas, 574,000 tonnes of LPG<br />
and 517,000 tonnes of liquid hydrocarbons (stable natural gasoline, isopentane and hexane-heptane<br />
fractions, and natural gas liquids).<br />
A new loading rack for natural gas liquids was commissioned in <strong>2005</strong> at the Lokosovsky Gas-processing<br />
Plant, providing additional inputs to the Perm Gas-processing Plant.<br />
REFINING, PETROCHEMICALS AND MARKETING<br />
LUKOIL Gas-processing Plants<br />
Usinsk<br />
Gas-processing<br />
Plant<br />
Usinsk (Komi) 700<br />
551<br />
Lokosovsky<br />
Gas-processing Plant<br />
Langepas<br />
(Western Siberia) 1,070<br />
1,214<br />
Total 2,679<br />
2,691<br />
711<br />
479<br />
Perm<br />
Gas-processing<br />
Plant<br />
Perm 505<br />
498<br />
550<br />
437<br />
Korobkovsky<br />
Gas-processing<br />
Plant<br />
Kotovo<br />
(Volgograd Region) 404<br />
428<br />
161<br />
42<br />
Gas<br />
processing<br />
Capacity,<br />
mcm per year<br />
Processing in <strong>2005</strong>,<br />
mcm<br />
Capacity,<br />
th. tonnes per year<br />
Processing in <strong>2005</strong>,<br />
th. tonnes<br />
Processing<br />
of liquid<br />
hydrocarbons<br />
PETROCHEMICALS<br />
LUKOIL's petrochemical business is the biggest in Russia and Eastern Europe. The Company's plants<br />
in Russia and Ukraine make pyrolysis products, organic synthesis products, fuel fractions and polymer<br />
materials, meeting a major share of Russian domestic demand for various chemicals as well as exporting<br />
chemicals to more than 50 countries.<br />
LUKOIL petrochemical plants made 1.8 million tonnes of saleable products in <strong>2005</strong>, including 402,000<br />
tonnes of polyethylene (8% more than in 2004), 53,000 tonnes of vinyl acetate (30% more than in<br />
2004), and 128,000 tonnes of acrylonitrile (9% more than in 2004). In addition the Company's<br />
51
<strong>ANNUAL</strong> <strong>REPORT</strong>, <strong>2005</strong><br />
LUKOIL Petrochemical Plants<br />
Petrochemical Plants<br />
Saratovorgsintez<br />
Saratov (Russia)<br />
Acrylonitrile and other<br />
organic synthesis<br />
products<br />
Stavrolen<br />
Boudennovsk<br />
(Stavropol Region, Russia)<br />
Polyethylene<br />
and other products<br />
Karpatneftekhim<br />
Kalush (Ukraine)<br />
Polyethylene,<br />
vinyl chloride<br />
and other products<br />
Refineries<br />
with petrochemical units<br />
AO LUKOIL<br />
Neftokhim Burgas<br />
Burgas (Bulgaria)<br />
Polymers and organic<br />
synthesis products<br />
Bulgarian Refinery, LUKOIL Neftokhim Burgas, produced 372,500 tonnes of petrochemicals (181,600<br />
tonnes of organic synthesis products and 179,700 tonnes of polymers, including 68,200 tonnes of<br />
high-pressure polyethylene).<br />
Capital expenditures in <strong>2005</strong> on new construction, modernization and technical re-equipping of existing<br />
petrochemical facilities were $77 million. Net income in the petrochemical segment was $122 million.<br />
Realization of investment projects at existing plants and development of new large-scale projects were carried<br />
out in <strong>2005</strong> as part of the Company's strategy for development of its petrochemicals business.<br />
Karpatneftekhim commissioned a unit for hydrogenating С 4 -С 5 fractions in <strong>2005</strong> with 90,000 tonnes<br />
annual capacity, giving a significant output increase.<br />
Output of Petrochemicals,<br />
thousand tonnes<br />
2,300<br />
LUKOIL restarted work in <strong>2005</strong> on construction of polypropylene<br />
facilities at the Stavrolen Plant. The work had been interrupted in<br />
1995 when state funding was halted. The polypropylene unit<br />
with 120,000 tonnes capacity should be commissioned in 2006<br />
and will be the first of its kind among LUKOIL petrochemical<br />
assets. Cost of the project is $140 million.<br />
2,242<br />
2,200<br />
2,135<br />
2,179<br />
Saratovorgsintez began work on a complex for production of<br />
sodium cyanide with 15,000 tonnes annual capacity. Cost of the<br />
project is $24 million and commissioning is scheduled for 2007.<br />
2,100<br />
A project for new chloride and caustic soda production facilities<br />
2,000<br />
2003<br />
2004<br />
<strong>2005</strong><br />
was in the planning stage at Karpatneftekhim last year. Use of<br />
the latest membrane technology will give annual production of<br />
52
up to 200,000 tonnes of caustic soda. Cost of the project is $100 million and commissioning is scheduled<br />
for 2007.<br />
The Company is considering installation of a new polyvinyl chloride production facility with 300,000<br />
tonnes annual capacity at Karpatneftekhim. Integration of such a facility with Karpatneftekhim's<br />
monomer vinyl chloride production would significantly increase overall production efficiency.<br />
One of LUKOIL's most ambitious projects for coming years is construction of the Caspian Gas-chemical<br />
complex, which will process natural gas and gas condensate, produced by LUKOIL on the Caspian Sea<br />
shelf. The project is aimed at increasing value added by deeper refining of gas, efficient chemical processing<br />
of ethane, natural gas liquids and condensate, and complex refining of natural gas and its components<br />
to produce basic organic synthesis products, polyethylene, polypropylene and other petrochemicals. A feasibility<br />
study for investment in construction of key facilities of the complex is to be carried out in 2006.<br />
REFINING, PETROCHEMICALS AND MARKETING<br />
PETROLEUM PRODUCT MARKETING<br />
The Company's marketing network extends to 18 countries: Russia, near-abroad and European countries<br />
(Azerbaijan, Belarus, Georgia, Moldova, Ukraine, Bulgaria, Hungary, Finland, Estonia, Latvia, Lithuania,<br />
Poland, Serbia, Romania, Macedonia, Cyprus, Turkey), and the USA. The network includes 198 tank<br />
farms with reservoir capacity of 3.03 million cubic meters and 5,830 filling stations (including franchises).<br />
Retail sales increased significantly in <strong>2005</strong>: the Company sold 10.7 million tonnes of fuel at its own<br />
filling stations, which was 29.7% more than in 2004. The growth was due to expansion on the retail<br />
market and to increase of average sales per filling station.<br />
LUKOIL invested $907 million in its marketing business in <strong>2005</strong>. The money was mainly spent on<br />
acquisition and building of 643 new filling stations and upgrading of 232 stations.<br />
The Company exported 16.6 million tonnes of petroleum products to the near-abroad and other countries<br />
in <strong>2005</strong>, including 0.59 million tonnes of lubricants. Most export deliveries of petroleum products<br />
are made by rail: 75.5% of petroleum product deliveries were by rail in <strong>2005</strong>.<br />
Structure of Petroleum Product Sales<br />
(wholesale and retail, <strong>2005</strong>)<br />
Baltics 2.8%<br />
Near-abroad<br />
countries 6.8%<br />
Russia 41.9%<br />
Europe 16.8%<br />
Turkey 1.0%<br />
Filling Station Network<br />
(owned, leased and franchises)<br />
as of 1 January, 2006<br />
7,000<br />
6,000<br />
5,000<br />
4,000<br />
3,000<br />
2,000<br />
4,599<br />
1,325<br />
1,542<br />
5,405<br />
2,035<br />
1,659<br />
5,830<br />
1,965<br />
2,171<br />
Average Daily Sales<br />
of Petroleum Products<br />
per Filling Station,<br />
tonnes/day<br />
8<br />
6<br />
4<br />
2<br />
5.2<br />
6.3<br />
7.0<br />
USA 30.7%<br />
1,000<br />
0<br />
2003<br />
1,732<br />
2004<br />
1,711<br />
<strong>2005</strong><br />
1,694<br />
0<br />
2003<br />
2004<br />
<strong>2005</strong><br />
USA<br />
Europe and near-abroad countries<br />
Russia<br />
53
<strong>ANNUAL</strong> <strong>REPORT</strong>, <strong>2005</strong><br />
Russia<br />
The Company's marketing network in Russia consists of 1,694 filling stations (including franchises)<br />
and 141 tank farms with reservoir capacity of 1.85 million cubic meters. The filling stations and tank<br />
farms are operated by 9 marketing subdivisions in 60 Russian regions.<br />
Volume of petroleum products sold on the domestic market in <strong>2005</strong> was 19.97 million tonnes, and the<br />
Company sold 3.55 million tonnes through its Russian filling station network (29.4% more than in 2004).<br />
Investments in the Russian marketing network in <strong>2005</strong> were $374 million. The money was spent<br />
mainly on construction of 35 new stations, upgrading of 40 others and acquisition of 71 stations. The<br />
Company also built one new tank farm, bought two others, and carried out upgrading and modernization<br />
of tank farm facilities.<br />
LUKOIL disposed of 26 tank farms and 61 filling stations in Russia in <strong>2005</strong> (through sale, liquidation,<br />
mothballing, or leasing) as part of the program for optimization of the Company marketing network.<br />
Average daily sales per filling station rose by 19% to 7.6 tonnes as a result.<br />
The number of LUKOIL filling stations included in the LICard discount payment system increased by<br />
10.4% in <strong>2005</strong> to reach 1,967 by 1 January 2006. The number of issued cards rose by three times<br />
to 592,000 and 1.083 million tonnes of fuel were sold to customers using the cards (71.1% more<br />
than in 2004).<br />
International<br />
The Company's retail network outside Russia grew rapidly in <strong>2005</strong>, when 537 new filling stations and<br />
diesel fuel sale points were built or acquired in the near-abroad countries and Europe, and 192 foreign<br />
filling stations were upgraded.<br />
54
LUKOIL bought share stakes in <strong>2005</strong>, which<br />
gave the Company sole control of the Finnish<br />
companies Oy Teboil Ab and Suomen Petrooli<br />
Oy. The acquisitions cost $160 million. The<br />
principal business of Oy Teboil Ab and<br />
Suomen Petrooli Oy is management of a network<br />
of 289 filling stations and 132 retail<br />
diesel fuel outlets. The companies are also<br />
fuel wholesalers, as well as blending and selling<br />
lubricants.<br />
In March <strong>2005</strong> LUKOIL bought 15 filling stations<br />
in Hungary from the Austrian company<br />
ABA, increasing the number of LUKOIL stations<br />
in Hungary to 26 (more than 3% of the<br />
Hungarian retail fuel market).<br />
Structure of Petroleum Product Sales by LUKOIL Regional<br />
Marketing Organizations in Europe and the Near-abroad<br />
Countries (wholesale and retail, <strong>2005</strong>)<br />
Ukraine 9.9%<br />
Belarus 8.8%<br />
Romania 13.3%<br />
Serbia 4.1%<br />
Lithuania 6.6%<br />
Moldova 3.1%<br />
Poland 2.4%<br />
Estonia 1.3%<br />
Georgia 1.5%<br />
Hungary 1.5%<br />
Azerbaijan 2.8%<br />
Latvia 2.4%<br />
Bulgaria 25.7%<br />
Cyprus 0.9%<br />
Finland 12.2%<br />
Turkey 3.5%<br />
REFINING, PETROCHEMICALS AND MARKETING<br />
By the end of <strong>2005</strong> foreign divisions of the Company in Europe, near-abroad countries and the USA<br />
had 57 tank farms with reservoir capacity of 1.18 million cubic meters and 4,136 filling stations.<br />
Optimization of the international filling station network helped to increase daily fuel sales per station<br />
in Europe and the near-abroad countries by 11% to 4.9 tonnes. The average daily figure at US stations<br />
was 8.4 tonnes.<br />
Petroleum product sales on international markets in <strong>2005</strong> were 56.67 million tonnes, of which 7.12<br />
million tonnes were sold through the Company's retail network (29.9% more than in 2004).<br />
LUKOIL spent $533 million on development of its international retail network in <strong>2005</strong>.<br />
55
<strong>ANNUAL</strong> <strong>REPORT</strong>, <strong>2005</strong><br />
INTERNATIONAL TRADE<br />
LITASCO (LUKOIL International Trading and Supply Company) was set up in 2000 as sole agent for<br />
the Company's international trading operations, carrying out all LUKOIL Group deliveries and trading<br />
operations outside Russia. Transfer of all export operations to a single Company simplified export<br />
arrangements, optimizing export flows and assuring transparency of LUKOIL's oil and product exports.<br />
LITASCO is consistently increasing margins on trade operations by optimizing management of<br />
LUKOIL's delivery channels and by increasing the volume of trade with third parties.<br />
LITASCO has offices in 14 countries and its main trading offices are in Switzerland, the USA,<br />
Germany, the Netherlands, Sweden, UAE and Singapore. LITASCO's trading operations are supported<br />
by the company's own maritime fleet of 25 tankers. LITASCO's business divides into three<br />
main parts.<br />
Export sales of LUKOIL crude oil and petroleum products<br />
LITASCO sells LUKOIL crude oil and petroleum products to customers outside Russia. The main volumes<br />
are exported through Baltic and Black Sea ports, and also through the Druzhba pipeline system.<br />
Sales regions have traditionally been in Central, Eastern and Northern Europe, and the Black Sea and<br />
Mediterranean Basins. However, in the last two years LITASCO has taken advantage of strong commercial<br />
positions in Europe to send increasing export volumes to more distant markets, such as the<br />
USA and China. In the same period LITASCO has significantly increased the share of its sales, which<br />
are made direct to final users (oil refining and marketing companies).<br />
Deliveries to foreign companies of LUKOIL Group<br />
LITASCO makes deliveries to Group companies outside Russia, including refineries in Bulgaria and<br />
Romania. Crude deliveries are matched to the configuration and production requirements of each<br />
refinery in order to achieve maximum efficiency.<br />
56
Trading with third parties<br />
LITASCO carries out international trading operations with third parties from its office in Geneva and its<br />
network of subsidiaries and representative offices in other countries. Such trading operations were<br />
35% of LITASCO's total business in <strong>2005</strong>. They help to increase efficiency of LUKOIL export business<br />
and generate extra profit.<br />
LITASCO has more than 2,000 suppliers and customers, including all the leading international oil corporations.<br />
LITASCO's expansion to new markets in Central America, China, and the Middle East have<br />
made LUKOIL one of the foremost oil trading companies in the world.<br />
In <strong>2005</strong> LUKOIL exported 40.0 million tonnes of crude oil and 19.7 million tonnes of petroleum products<br />
through LITASCO. Purchases by LITASCO from third parties in <strong>2005</strong> were 10.8 million tonnes of<br />
oil and 20.9 million tonnes of petroleum products. Deliveries to LUKOIL companies were 10.4 million<br />
tonnes of petroleum products and 81 million tonnes were sold to third parties. Net income of LITASCO<br />
in <strong>2005</strong> was $211 million.<br />
REFINING, PETROCHEMICALS AND MARKETING<br />
57
TECHNOLOGY AND INNOVATION<br />
INTENSIFICATION OF OIL & GAS PRODUCTION<br />
A significant part of LUKOIL's reserves are characterized by high levels of exhaustion, with growth of<br />
the water cut in crude production. Use of enhanced oil recovery (EOR) helps to increase recoverable<br />
reserves and production rates, to tap reserves of highly viscous oil and reserves in collectors with low<br />
permeability, as well as reserves at fields, which are in late stages of exhaustion.<br />
The Company carries out more than 5,000 interventions<br />
each year on producing strata using physical,<br />
chemical, hydrodynamic and heat techniques to<br />
increase recovery rates. The number of EOR operations<br />
in <strong>2005</strong> was 5,052, and they gave additional oil<br />
production of 22.1 million tonnes (6.3% more than<br />
in 2004). The share of oil produced by EOR in total<br />
Company oil production in <strong>2005</strong> was 25.4%.<br />
LUKOIL thus met its target of producing more than<br />
20% of its oil using EOR.<br />
Most of the EOR production was obtained using<br />
physical methods (14.1 million tonnes or 63.9% of<br />
total EOR production). Hydrofracturing gave 87.4%<br />
of all the oil recovered using physical EOR in <strong>2005</strong>.<br />
Drilling of sidetracks at existing<br />
wells is a highly efficient form of<br />
EOR. The Company commissioned<br />
102 sidetracks in <strong>2005</strong><br />
(compared with 63 in 2004), giving<br />
average daily well flow<br />
increases of 25 tonnes and overall<br />
production of 427,000 tonnes.<br />
58
<strong>ANNUAL</strong> <strong>REPORT</strong>, <strong>2005</strong><br />
Effect from EOR in Russia<br />
LUKOIL-Komi<br />
2,049 th. tonnes 25.3%<br />
Naryanmarneftegaz<br />
2 th. tonnes 0.3%<br />
LUKOIL-Sever<br />
7 th. tonnes 0.8%<br />
LUKOIL-Western<br />
Siberia<br />
17,223 th. tonnes 32.1%<br />
RITEK<br />
658 th. tonnes 25.4%<br />
LUKOIL-Perm<br />
and UralOil<br />
1,507th. tonnes 14.8%<br />
Kaliningradmorneft<br />
46 th. tonnes 3.9%<br />
Nizhnevolzhskneft<br />
589 th. tonnes 19.6%<br />
% – share in total production of entity<br />
LUKOIL Group<br />
in Russia<br />
22,081 th. tonnes 25.4%<br />
Another way of increasing production efficiency is drilling of horizontal wells, which increase productivity<br />
by several times and thus raise capex efficiency. Drilling-in of strata at depressions is<br />
another useful technology of production drilling, giving increase of well productivity by 1.3 times on<br />
average.<br />
Well workovers gave additional daily production of 18,317 tonnes in <strong>2005</strong> (3% more than in 2004).<br />
Overall production volumes added by these operations were 4.6 million tonnes, and the economic<br />
effect was $470 million.<br />
The Company continued work on a multi-level system for monitoring of field development using geological-technological<br />
models in <strong>2005</strong>. LUKOIL-Western Siberia is developing mini-projects, which optimize<br />
development of priority sectors of large fields using such models.<br />
EOR Techniques, used by LUKOIL in <strong>2005</strong><br />
Shares of Various Techniques<br />
in Overall EOR Production in <strong>2005</strong><br />
Chemical 6%<br />
Heat 2%<br />
Hydrofracturing 17%<br />
Hydrodynamic 17%<br />
Intensification<br />
of oil production 13%<br />
Sidetracks 2%<br />
Other physical<br />
techniques 2%<br />
Other physical<br />
techniques 2%<br />
Sidetracks 7%<br />
Chemical 1%<br />
Heat 4%<br />
Intensification of<br />
oil production 29%<br />
Hydrodynamic 42%<br />
Hydrofracturing 56%<br />
60
ENERGY-SAVING TECHNOLOGIES<br />
Economies in <strong>2005</strong> thanks to the Company's energy-saving program were 344 million kWh of electrical<br />
energy, 43,000 Gcal of heat energy and 7,500 tonnes of heating fuel. Total value of these savings<br />
is $12.7 million.<br />
Company subsidiaries Urayneftegaz, <strong>Lukoil</strong>-Western Siberia, LUKOIL-Nizhnevolzhskneft, LUKOIL-<br />
Kaliningradmorneft, LUKOIL-Komi, Permneftegazpererabotka (Perm Gas-processing Plant) and<br />
LUKOIL-Sever generated 147.9 million kWh of electricity at their own generating facilities, which is<br />
equal to 1.6% of total electricity consumption by the Company in production.<br />
TECHNOLOGY AND INNOVATION<br />
Automated metering systems, which are now being installed at all Company subsidiaries on the basis<br />
of equipment supplied by ABB Automation, will reduce energy costs by 3–5% thanks to more accurate<br />
measurement of energy consumption and use of differences between peak and off-peak tariffs.<br />
In <strong>2005</strong> automated metering systems were fully deployed by LUKOIL-Western Siberia, LUKOIL-Perm,<br />
LUKOIL-Nizhnevolzhskneft and Permneftegazpererabotka. The Company has thus achieved high-quality<br />
metering of electricity and switched to a peak-and-off-peak tariff regime, as well as making necessary<br />
technical preparations for subsidiaries to start using Russia's new wholesale electricity market.<br />
INFORMATION TECHNOLOGIES<br />
The Company has been working since 2001 on installation of an integrated management system<br />
based on SAP R/3 software. The system will support management decision-making and enable automated<br />
management accounting inside the Company. The system was in industrial use in <strong>2005</strong> at oil<br />
& gas production companies (LUKOIL-Perm, LUKOIL-Komi), oil refiners (the Perm and Burgas<br />
Refineries), and the marketing arm, LITASCO. Preparations are being made for further extension of the<br />
system at other LUKOIL companies, which work in these sectors, and in the parent Company.<br />
Computerized management has thus reached all spheres of Company business: production, oil & gas<br />
refining and marketing.<br />
LUKOIL carried out work on modernization of its information protection system in <strong>2005</strong> and launched<br />
the first stage of its system for centralized monitoring of information resources. A program for smooth<br />
running of LUKOIL business was drawn up in accordance with the Company's plan of measures for<br />
IT development.<br />
In order to achieve well-balanced management of Company business, there are mid-term plans to<br />
move away from the current model of separate projects for separate business segments towards a<br />
global integrated management system and global monitoring of IT infrastructure.<br />
61
TRADE BALANCE OF LUKOIL SUBSIDIARIES (<strong>2005</strong>)<br />
RUSSIA<br />
PURCHASES OF PETROLEUM<br />
PRODUCTS<br />
SALES<br />
OF PETROCHEMICAL<br />
PRODUCTS<br />
1.4 mln tonnes<br />
0.7 mln tonnes<br />
OIL<br />
PURCHASES<br />
REFINING AT OWN<br />
REFINERIES<br />
PROCESSING<br />
AT PETROCHEMICAL<br />
PLANTS<br />
TOTAL<br />
PETROCHEMICAL<br />
PRODUCTS<br />
1.5 mln tonnes<br />
37.1 mln tonnes*<br />
1.1 mln tonnes<br />
1.0 mln tonnes<br />
OIL<br />
PRODUCTION<br />
TOTAL<br />
OIL<br />
REFINING AT THIRD-PARTY<br />
REFINERIES<br />
TOTAL PETROLEUM<br />
PRODUCTS<br />
WHOLESALE SALES<br />
OF PETROLEUM PRODUCTS<br />
84.2 mln tonnes<br />
86.0 mln tonnes<br />
1.6 mln tonnes<br />
38.2 mln tonnes<br />
16.4 mln tonnes<br />
OIL SALES<br />
RETAIL SALES<br />
OF PETROLEUM<br />
PRODUCTS<br />
0.7 mln tonnes<br />
3.5 mln tonnes<br />
OIL SUPPLIES<br />
FROM KAZAKHSTAN<br />
OIL<br />
EXPORTS<br />
EXPORTS OF PETROLEUM<br />
PRODUCTS<br />
EXPORTS<br />
OF PETROCHEMICAL<br />
PRODUCTS<br />
0.4 mln tonnes<br />
45.8 mln tonnes<br />
16.6 mln tonnes<br />
0.3 mln tonnes<br />
PURCHASES OF PETROLEUM<br />
PRODUCTS<br />
32.2 mln tonnes<br />
OIL<br />
PURCHASES<br />
REFINING AT OWN<br />
REFINERIES<br />
PROCESSING<br />
AT PETROCHEMICAL<br />
PLANTS<br />
TOTAL<br />
PETROCHEMICAL<br />
PRODUCTS<br />
9.4 mln tonnes<br />
10.0 mln tonnes**<br />
1.1 mln tonnes ***<br />
1.4 mln tonnes<br />
OIL<br />
PRODUCTION<br />
2.0 mln tonnes<br />
TOTAL<br />
OIL<br />
56.9 mln tonnes<br />
REFINING AT THIRD-PARTY<br />
REFINERIES<br />
1.2 mln tonnes<br />
TOTAL PETROLEUM<br />
PRODUCTS<br />
58.9 mln tonnes ***<br />
WHOLESALE SALES<br />
OF PETROLEUM PRODUCTS<br />
49.5 mln tonnes<br />
SALES OF<br />
PETROCHEMICAL<br />
PRODUCTS<br />
1.4 mln tonnes<br />
OIL<br />
SALES<br />
RETAIL SALES<br />
OF PETROLEUM<br />
PRODUCTS<br />
INTERNATIONAL<br />
45.9 mln tonnes<br />
7.1 mln tonnes<br />
“Total oil” includes LUKOIL's own consumption and transportation losses.<br />
Other figures include refining, transportation and storage losses as well as changes in stocks.<br />
* Excluding refining at mini-refineries.<br />
** Excluding fuel oil processed at Burgas Refinery.<br />
*** Including petrochemical products produced at Burgas Refinery.<br />
7<br />
62<br />
63
SOCIAL RESPONSIBILITY<br />
PROTECTING THE ENVIRONMENT<br />
LUKOIL makes sure that its business practices meet the highest standards of environmental protection<br />
and industrial safety. The Company is fully aware of its responsibility to society for maintaining the<br />
environment and for rational use of resources. We make every effort to raise the level of ecological<br />
and industrial security at our production facilities and to reduce negative environmental impacts. The<br />
Company also strives to improve its business efficiency and reduce the environmental burden from<br />
its industrial activities through rational use of natural resources, both at Company production sites and<br />
in surrounding regions.<br />
LUKOIL took all necessary measures in <strong>2005</strong> to ensure ecological security in accordance with requirements<br />
of national legislation and international environmental standards. The Company also devoted<br />
considerable efforts to raising quality of its products, which now meet the latest ecological standards.<br />
The Company's environmental activities are guided by the LUKOIL environmental management system,<br />
which has been certified as compliant with the ISO 14001 international standard. The Company<br />
underwent a supervisory audit in <strong>2005</strong> and made the changeover to ISO 14001:2004 (the new version<br />
of the international standard).<br />
64
<strong>ANNUAL</strong> <strong>REPORT</strong>, <strong>2005</strong><br />
Work by LUKOIL in the reporting year on protection of the environment was carried out in a<br />
context of strict supervision by the government and social organizations, and tightening of<br />
natural resource and environmental legislation.<br />
In <strong>2005</strong>:<br />
the international Kyoto Protocol, which limits atmospheric emissions of greenhouse gases and<br />
which was ratified by the Russian Federation, came into force;<br />
the Russian government approved new levels of compensation payments for pollution of the<br />
environment. Rates payable for some types of pollution grew by dozens of times, and the rate<br />
for methane emissions rose by 1,000 times;<br />
Fines payable for violation of environmental legislation were substantially increased, and offenders<br />
were made liable to suspension of operations for up to 90 days;<br />
the Ecology Code of the Russian Federation, which would increase the level of liability for ecological<br />
violations and tighten environmental requirements, was considered by the State Duma;<br />
worsening of air quality in several regions of the Russian Federation made local authorities<br />
introduce legislative and administrative limitations on sale of environmentally harmful fuels;<br />
the role of Russian and international environmental movements and organizations increased further,<br />
and their influence on economic decision-making processes grew.<br />
The Company has almost completed its program for certification of compliance by subsidiaries with<br />
international standards for quality management (ISO 9000), environmental protection (ISO 14001) and<br />
health and safety (OHSAS 18001).<br />
In <strong>2005</strong> the Company continued implementation of its Ecological Security Program for 2004–2008.<br />
The Program calls for 400 environmental measures to be carried out at a cost of about $1.2 billion.<br />
LUKOIL Group spent about $320 million on ecological security measures in <strong>2005</strong>, including over $160<br />
million of capital expenditures invested in environmental protection facilities.<br />
Thanks to these efforts LUKOIL companies achieved lower-than-average environmental impact by<br />
many criteria compared with the rest of the Russian oil sector, and the Group was the best in the sector<br />
by several indicators.<br />
International organizations including the Environment Committee of the Parliamentary Assembly of<br />
the Council of Europe, and UNESCO's World Heritage Committee maintained their interest during<br />
<strong>2005</strong> in environmental safety issues connected with development of the Kravtsovskoye field on the<br />
shelf of the Baltic Sea. Company representatives participated directly in work of the joint Russian-<br />
Lithuanian environmental commission and working groups set up by the commission. The Company's<br />
participation enabled significant breakthroughs in discussion of:<br />
a draft agreement between the Governments of Russia and Lithuania on cooperation to counter<br />
pollution of the Baltic Sea;<br />
66
the draft of a joint plan for emergency measures in case of Baltic Sea pollution;<br />
a draft program for environment monitoring in the Russian and Lithuanian parts of the Baltic Sea.<br />
Absence of negative environmental impact from the Kravtsovskoye platform was generally confirmed,<br />
and LUKOIL's activities in the region earned the approval of the international community.<br />
LUKOIL completed its 2002–<strong>2005</strong> program for ecological rehabilitation of polluted land and prevention<br />
of oil spills in the Republic of Komi. The main aim of the program was to eradicate consequences of<br />
the spills from Komi pipelines, which occurred in 1994 and turned parts of Komi into ecological disaster<br />
areas for many years afterwards. LUKOIL spent more than $155 million on environmental work in<br />
Komi during 2000–<strong>2005</strong>. Thanks to these efforts the region of the accident ceased to be officially designated<br />
as an ecological disaster area in 2004.<br />
SOCIAL RESPONSIBILITY<br />
Improvement of fuel production technologies and increased output of high-quality products obviously<br />
make a significant contribution to better ecology. The Company therefore channels about 30% of its<br />
capital expenditures to the refining & marketing segment. A large part of this money is spent on organizing<br />
production of ecologically clean fuels.<br />
LUKOIL is the first Russian oil company to start large-scale production and sale of Euro-4 diesel fuel<br />
with improved ecological characteristics (LUKOIL Euro-4). The fuel meets the EN-590:2004 environmental<br />
standard for diesel fuel, which has been in force in the European Union since <strong>2005</strong>. As well as<br />
prolonging engine life and saving fuel, use of LUKOIL Euro-4 more than halves carcinogenic atmospheric<br />
emissions. Plans for development of LUKOIL's Russian refineries include increase of annual<br />
production of Euro-4 diesel fuel to over 10 million tonnes by 2010.<br />
LUKOIL is undertaking major reconstruction and modernization of the Odessa and Nizhny Novgorod<br />
Refineries to improve their operating and financial indicators, make petroleum product output compliant<br />
with the Euro-3 and Euro-4 standards, and reduce environmental impact.<br />
We also strive to maintain high standards of environmental protection in other spheres of our business.<br />
One example is introduction in <strong>2005</strong> of an international corporate system of tanker vetting, used<br />
by LUKOIL on vessels, which it charters for oil transport. Vessels undergo in-depth inspection to<br />
ensure that they meet safety requirements and to assess risks associated with sea transport of oil and<br />
petroleum products and with terminal operations.<br />
LUKOIL also attaches special importance to ecological issues in its cooperation with ConocoPhillips.<br />
In particular the partners have agreed a project for joint construction of the South-Khylchuyuskoye<br />
field, which is being developed by their joint venture, Naryanmarneftegaz. The project is based on the<br />
minimum environmental impact principle, enshrined in LUKOIL's Policy for Industrial Safety and<br />
Protection of Labour and Environment in the 21st Century. The field project uses ConocoPhillips technology<br />
standards and applies a number of cutting-edge measures for environmental protection. These<br />
include use of minimal land area for production, technology that excludes any melting of permafrost<br />
layers, maximum use of associated gas and removal of sulphur compounds from the gas in order<br />
to reduce harmful emissions, use of waste water to maintain strata pressure, and fully automated<br />
67
<strong>ANNUAL</strong> <strong>REPORT</strong>, <strong>2005</strong><br />
management of technology processes. Investments in industrial and environmental safety will exceed<br />
20% of total capital expenditure on construction of the South Khylchuyuskoye field.<br />
Our work to protect the environment has earned positive assessments from many social organizations<br />
over the years. In <strong>2005</strong> LUKOIL, LUKOIL-Kaliningradmorneft and LUKOIL-Komi were acclaimed as<br />
winners of a contest to find the Russian Environment Leader, which was held as part of the All-<br />
Russian conference 'New State Ecology Policy in the Real Sector of the Economy'.<br />
A rating prepared by the International Social and Ecological Union and the independent ecology rating<br />
agency Nera, supported by the World Bank, judged LUKOIL to be one of the three most successful<br />
Russian companies in reducing negative environmental impact since 2000. The rating included 75<br />
leading Russian companies, and 500 subsidiaries of these companies.<br />
LABOUR AND INDUSTRIAL SAFETY<br />
Measures to maintain labour and industrial safety are governed by LUKOIL's Policy for Industrial<br />
Safety and Protection of Labour and Environment in the 21st Century.<br />
The Company carried out all its planned measures in <strong>2005</strong> for disclosure of hazardous production facilities<br />
and their inclusion in the state register of such facilities, attestation of workplace safety standards,<br />
carrying out of complex and specific checks, and training and attestation of personnel. A sum<br />
of about $230 million was set aside to finance the relevant program in <strong>2005</strong>. The money was used to<br />
renew various fixed assets of Group subsidiaries, to build new technological facilities and reconstruct<br />
existing ones, and for installation and upkeep of personnel facilities, as well as improvement of ancillary<br />
assets (reservoirs, loading racks, flares, etc.) and land upgrades.<br />
One of the main aspects of LUKOIL's system for management of labour and industrial safety is prevention<br />
of accidents at work and attestation of workplace safety standards. Over 43,000 workplaces<br />
had been attested as of January 1, 2006. The total number of accidents at work within the Company<br />
declined by almost 25% in <strong>2005</strong> compared with 2004.<br />
Polluted Land, hectares<br />
Liquid Effluents,<br />
million cubic meters<br />
Environmental Spending,<br />
$ million<br />
Spillage of Oil and Petroleum<br />
Products due to Accidents,<br />
tonnes<br />
450<br />
30<br />
400<br />
120<br />
400<br />
350<br />
25<br />
20<br />
300<br />
100<br />
80<br />
300<br />
15<br />
200<br />
60<br />
250<br />
200<br />
10<br />
5<br />
100<br />
40<br />
20<br />
150<br />
2003<br />
2004<br />
<strong>2005</strong><br />
0<br />
2003<br />
2004<br />
<strong>2005</strong><br />
0<br />
2003<br />
2004<br />
<strong>2005</strong><br />
0<br />
2003<br />
2004<br />
<strong>2005</strong><br />
68
Good working conditions, low accident levels and regular medical checks for personnel enable many<br />
LUKOIL subsidiaries to obtain discounts on standard rates for obligatory insurance covering industrial<br />
accidents and job-related illness.<br />
PERSONNEL AND SOCIAL PROGRAMS<br />
LUKOIL acknowledges the prime importance and value of its people, who deserve a large part of the<br />
credit for increases in Company efficiency and shareholder value. We understand that success of the<br />
Company depends to a large extent on the people who work for it. LUKOIL therefore places high<br />
value on the contribution of each employee to the well-being of the Company as a whole. LUKOIL's<br />
social policy aims to improve levels of labour efficiency and social protection of employees. We take<br />
motivation of our personnel seriously and try to ensure that every member of staff has an interest in<br />
the attainment of best results by the Company.<br />
SOCIAL RESPONSIBILITY<br />
We are constantly improving our standards of human resource management, giving the greatest attention<br />
to improvements in the system of incentives for LUKOIL Group employees. In <strong>2005</strong> a system of<br />
result management was designed, which helps attainment of Company business goals by linking them<br />
to areas of employee responsibility. The system uses a differentiated approach to employee incentives<br />
depending on their contribution to improvement of key Company performance indicators.<br />
LUKOIL is aware that incentives do not necessarily have to be financial. National awards were made<br />
to 28 Company employees in <strong>2005</strong> in recognition of professional excellence and conscientious and<br />
productive performance at work. A further 1,533 members of staff won sectoral awards and LUKOIL<br />
itself bestowed marks of distinction on 365 individual employees and 39 groups of employees.<br />
Professional training of staff is seen as essential to Company development. Qualified staff are a major<br />
factor for increasing shareholder value, so investments in training are as important and indispensable<br />
69
<strong>ANNUAL</strong> <strong>REPORT</strong>, <strong>2005</strong><br />
as investments in other spheres. The system of continuous staff training, which has been put in place,<br />
aims to ensure that staff acquire the knowledge and professional skills, which they need in their jobs.<br />
The Company uses all modern training tools: seminars, mentoring, training sessions, study periods<br />
abroad, distance learning by computer, and MBA programs. The Company has 20 of its own study<br />
centres, and has created a tradition of study days for top managers.<br />
During <strong>2005</strong> employees who work in sale of fuels and lubricants in Russia and abroad benefited from<br />
practical training and seminars on corporate standards in work with customers at filling stations.<br />
Preparation work was carried out with the executive personnel reserve, who stand ready to assume<br />
roles as top executives in the Company: special programs for development of leadership potential and<br />
management skills have been designed for executives, who are included in this reserve. The Oil &<br />
Gas Business Institute provided professional training to 55 LUKOIL employees, 16 young specialists<br />
studied at the Gubkin State Oil & Gas University, and 9 specialists from LUKOIL oil refining companies<br />
broadened their experience through a period of work for the American company, UOP.<br />
The LUKOIL and ConocoPhillips employee exchange program was developed as part of the strategic<br />
partnership between the two companies. A group of 14 LUKOIL employees went to work in the US<br />
company in May <strong>2005</strong> and 16 advisors from ConocoPhillips are currently working at LUKOIL.<br />
The Company pays special attention to work with young specialists. The Company has approved<br />
a new youth program for <strong>2005</strong>–2010, and work with higher education establishments continued in<br />
<strong>2005</strong>. LUKOIL reached strategic cooperation agreements with the Higher School of Economics and<br />
the Finance Academy under the Government of the Russian Federation, as well as pursuing cooperation<br />
with the Gubkin State Oil & Gas University, Perm State Technical University and other education<br />
institutions in Russia and the near-abroad countries.<br />
Restructuring of LUKOIL Group continued in <strong>2005</strong>, targeting cost reduction and efficiency improvements.<br />
Measures to optimize and reorganize parts of the Group and to dispose of non-core assets of<br />
LUKOIL companies led to reduction of employee numbers in geological exploration, oil production and<br />
refining compared with 2004, while employment levels in the expanding filling stations segment<br />
increased. In total, Company employee numbers declined by 10.8% in <strong>2005</strong>. At the same time struc-<br />
Hydrocarbon Production<br />
per Employee,<br />
thousand boe/employee<br />
Oil Refining per Employee,<br />
tonnes/employee<br />
Revenue per Employee,<br />
$ thousand/employee<br />
6<br />
350<br />
400<br />
5<br />
300<br />
350<br />
4<br />
3<br />
2<br />
1<br />
250<br />
200<br />
150<br />
100<br />
50<br />
300<br />
250<br />
200<br />
150<br />
100<br />
50<br />
0<br />
2003<br />
2004<br />
<strong>2005</strong><br />
0<br />
2003<br />
2004<br />
<strong>2005</strong><br />
0<br />
2003<br />
2004<br />
<strong>2005</strong><br />
70
tural reorganization and salary increases for employees in organizations, that only recently joined<br />
LUKOIL, led to 13.6% increase of average employee incomes in the Group (including all payments and<br />
bonuses).<br />
As well as ensuring a decent working salary, the Company encourages employee performance at<br />
work via a broad range of social programs and measures. These include:<br />
health care and medical treatment, including voluntary medical insurance;<br />
opportunities for rest and relaxation for employees and their families, and organization of sport<br />
and health activities;<br />
help to employees in obtaining their own accommodation;<br />
social support for women and families with children;<br />
social support for young specialists;<br />
non-state pension provision for employees, consisting of employer contributions to the LUKOIL-<br />
GARANT private pension fund ($14 million in <strong>2005</strong>). The system of non-state pension provision<br />
with employer and employee contributions was further extended in <strong>2005</strong>, and 62,000 employees<br />
were participants of the scheme by the end of <strong>2005</strong>.<br />
SOCIAL RESPONSIBILITY<br />
An efficient system of social security for employees helps to attract qualified specialists to the<br />
Company, reduces employee turnover, strengthens corporate culture and provides a foundation for<br />
strong operating performance.<br />
The Company continues to deliver on commitments, which it undertook voluntarily and on its own initiative<br />
under the LUKOIL Social Code. This is a code of principles and norms of socially responsible<br />
behaviour towards all parties, whose interests are affected by Company business.<br />
These additional commitments are directed towards employees, retired employees, and shareholders,<br />
as well as business partners, the state and society.<br />
In order to increase transparency of its social policy the Company has issued a Report on Sustainable<br />
Development in the Russian Federation in 2003–2004. The publication complies with the international<br />
Net Income<br />
per Employee,<br />
$ thousand/employee<br />
Employment Structure by Business Segments<br />
(as of 1 January, 2006)<br />
50<br />
40<br />
30<br />
Petroleum product marketing 16% Other activities 5%<br />
Petrochemicals 9%<br />
LUKOIL foreign<br />
organizations 14%<br />
20<br />
Oil refining 8%<br />
Head office 1%<br />
10<br />
0<br />
2003<br />
2004<br />
<strong>2005</strong><br />
Oil & gas production 47%<br />
71
<strong>ANNUAL</strong> <strong>REPORT</strong>, <strong>2005</strong><br />
AA 1000 standard and uses recommendations of the Global Reporting Initiative (GRI). The Company<br />
will issue such reports once every two years in the future.<br />
LUKOIL's efficiency in human resources management has won recognition outside the Company: the<br />
Main Personnel Division of LUKOIL was chosen as the winner of an All-Russian competition in <strong>2005</strong>,<br />
which compared the quality of personnel departments in Russian companies.<br />
SOCIAL POLICY AND CHARITY ACTIVITIES<br />
Social and charity programs are an integral part of the LUKOIL corporate strategy and help to further<br />
a constructive dialog with government, business and society. Such programs are carefully targeted<br />
and are based on the professional experience and human potential, which the Company has at its disposal<br />
in particular regions. Along with traditional forms of charity, LUKOIL is implementing strategic<br />
charity programs and social investments, which connect solution of social problems with the<br />
Company's strategic goals.<br />
Support for Children's Homes and Schools<br />
LUKOIL views helping children as a priority task, and includes it in all Company social initiatives: charity,<br />
sponsorship, sports programs aimed at children and young people, and cultural activities. The<br />
Company aims to achieve a balanced approach, helping children who are disadvantaged due to<br />
unfavourable family circumstances or health problems, but also helping children from secure family<br />
backgrounds to develop their abilities and talents.<br />
The Company itself and the LUKOIL Charity Fund provide help to more than 50 children's homes and<br />
boarding schools in all corners of Russia. The help is relevant to education, health, learning a profession<br />
and finding a place in life.<br />
72
Education Programs<br />
Preparation of qualified young specialists for the Russian oil & gas industry is naturally an important<br />
aspect of the Company's youth policy. LUKOIL provides financial support to a number of higher education<br />
institutions, which train oil & gas specialists. These include specialized institutions in Moscow,<br />
St. Petersburg, Perm, Ukhta, Tyumen, Ufa, Volgograd and Arkhangelsk. Sector training institutes in<br />
the near-abroad countries also receive support from LUKOIL, notably the State Oil Academy of<br />
Azerbaijan.<br />
SOCIAL RESPONSIBILITY<br />
Since 2000 the Company has been providing grants to particularly talented students at oil industry and technical<br />
institutes. Such grants are currently paid to 170 students in various towns and cities across Russia.<br />
LUKOIL also provides grant support to young teachers at leading Russian oil industry institutes: 63<br />
young teachers are now receiving Company grants.<br />
Support for Medical Institutions<br />
LUKOIL supports a number of important medical research centers in Moscow and St. Petersburg.<br />
They include the Scientific Centre for Obstetrics, Gynaecology and Perinatal Care, the Centre for<br />
Haematology Research, the Russian Cardiovascular Research Complex, the Central X-Ray Radiology<br />
Institute, and the Leningrad Regional Clinical Hospital.<br />
The Company also helps to develop medical services in its operating regions. In <strong>2005</strong> LUKOIL carried<br />
out an assistance program for medical institutions in the Republic of Komi and LUKOIL companies in<br />
Volgograd Region financed complete reconstruction of Volgograd City Hospital №16.<br />
Social Projects Competition<br />
LUKOIL-Perm held its fourth social projects competition in <strong>2005</strong>. A total of 469 projects were put forward<br />
and preference was given to initiatives, which help to maintain national and cultural heritage, to<br />
support health and the environment, and to assist veteran and invalid organizations.<br />
The geography of LUKOIL's social project competitions is expanding year by year. LUKOIL Charity<br />
Fund and LUKOIL-Nizhnevolzhsknefteprodukt have held social project competitions in Volgograd and<br />
Astrakhan Regions since 2004, and in <strong>2005</strong> competitions were held for the first time in the Republic<br />
of Komi (organized by LUKOIL Charity Fund and LUKOIL-Komi), and in Western Siberia (organized by<br />
LUKOIL-Western Siberia).<br />
Preserving Cultural and Spiritual Heritage<br />
LUKOIL provides support to a number of leading Russian museums, including the Pushkin Museum<br />
of Fine Art, Museums of the Moscow Kremlin and the Russian State Museum. In <strong>2005</strong> the Company<br />
73
<strong>ANNUAL</strong> <strong>REPORT</strong>, <strong>2005</strong><br />
took part in creation of a Centre for Aesthetic Education of Children and Young People at the Pushkin<br />
Museum, as well as financing the exhibition 'Polish Gifts to the Russian Tsars' in the Moscow Kremlin<br />
Museums and an exhibition of works by Valentin Serov in the Russian State Museum.<br />
The Company also supports regional museums, including the Astrakhan Kremlin and the Mikhail<br />
Sholokhov museum-house in Volgograd Region.<br />
For several years LUKOIL-Perm has maintained a program of support for folk trades in the Kama region near<br />
Perm. More than 19 projects have been carried out in Perm Region (now Perm Territory) during that time.<br />
LUKOIL has a long association with the Tchaikovsky Symphony Orchestra (under the artistic directorship<br />
of Vladimir Fedoseyev), the Beryozka Dance Ensemble, and the Russian Folklore Academic Choir.<br />
LUKOIL is also one of the trustees of the Bolshoi Theatre and the Moscow Conservatory.<br />
The Company gives much support to creative groups in regions where it has industrial operations. In particular,<br />
the Perm Opera and Ballet Theatre and the Volgograd Youth Theatre receive help from the Company.<br />
Revival of religious traditions and spiritual culture is an inseparable part of LUKOIL's charity activity.<br />
Orthodox churches in the towns of Kogalym, Uray, Langepas, Pokachi, Usinsk and Korenovsk have<br />
been rebuilt with Company support and mosques have been built in Kogalym and Ufa.<br />
The Company also helps Russian Orthodox Church institutions outside Russia (in Odessa, Baku, New<br />
York and Vienna).<br />
Help to Veterans and Disabled People<br />
The Company accords special attention to oilmen and women who are veterans of the Great Patriotic<br />
War (World War II) and veterans of the home front.<br />
LUKOIL also provides financial assistance to disabled people, helping them to earn a living and thus<br />
to feel a part of society. Initiatives by LUKOIL include equipment of a garment-making workshop for<br />
invalid workers in Uray.<br />
Support for Northern Peoples<br />
Operations by Group companies in Siberia and the Far North of Russia can have significant impact on<br />
the living conditions of small indigenous peoples. Changes in the traditional way of life of these peoples<br />
can lead to economic and social problems. LUKOIL's policy is to shift gradually from charity provision<br />
to economic partnership with indigenous populations.<br />
The Company designs and implements special programs of cooperation with owners of ancestral<br />
lands. LUKOIL-Western Siberia has made commitments to provide assistance in Khanty-Mansiysk<br />
Autonomous District, including construction of cottages and provision of other accommodation, as<br />
well as offering financial compensation for use of land.<br />
74
Sport<br />
Company priorities in physical education and sport are fitness of Company employees and their families,<br />
development of mass sports, support for Russian sport professionals, who wear the Company<br />
colors, and assistance in development of children's sport in Russia.<br />
The Company holds large-scale international amateur sports competitions to help encourage employee<br />
involvement in sport. The third such competition was held in Kaliningrad in June <strong>2005</strong>.<br />
SOCIAL RESPONSIBILITY<br />
LUKOIL is a keen supporter of the Russian Olympic Movement, and in <strong>2005</strong> the Company was one<br />
of the founders of the Fund for Support of Russian Olympic Sport. The Company has also restarted<br />
its financing for the Russian ski racing team in order to improve the team's readiness for the Winter<br />
Olympics. LUKOIL became general sponsor of the national ski racing team in 2006.<br />
The Company continues to support other leading Russian sports teams, including Spartak Football<br />
Club, LUKOIL-Spartak (the Volgograd water-polo team), LUKOIL-Dinamo (the Astrakhan handball<br />
team, which was the runner-up in the <strong>2005</strong> Russian championship).<br />
As well as helping sportsmen, the Company uses sports events as a testing ground to show how its<br />
products perform in the toughest conditions. In <strong>2005</strong> the LUKOIL-Bashkiria motorbike team won the<br />
Russian speedway championship using LUKOIL lubricants. Also in <strong>2005</strong> the LUKOIL-Racing Team<br />
became Russian champions in Formula 1600, Honda Civic and Formula Rus classes.<br />
LUKOIL continues to back one of the biggest children's sport organizations in Russia, the Children's<br />
Football League. About 250 teams and more than 5,000 young footballers from all over Russia take<br />
part in League competitions every year.<br />
75
CORPORATE GOVERNANCE<br />
The Company views corporate governance first and foremost as an instrument for protecting and<br />
observing the interests of its shareholders. Efficient corporate governance is a decisive factor for<br />
increasing competitiveness of LUKOIL Group. Company development is impossible without a properly<br />
functioning structure, which defines the relationship between the Board of Directors, Management<br />
Committee and shareholders, and without investor confidence that their money is being wisely used<br />
by the Company and is thus contributing to growth of its capitalization.<br />
LUKOIL follows internationally accepted standards of information disclosure, observes the main points<br />
of recommendations by the Russian Federal Service for Financial Markets, and submits to requirements<br />
of the London Stock Exchange. In <strong>2005</strong> LUKOIL published quarterly US GAAP accounts and<br />
management's discussion and analysis of financial condition and results of operations. The Company<br />
also published its annual Analyst DataBook with detailed financial and operating information for the last<br />
five years, and produced its first Report on Sustainable Development in the Russian Federation.<br />
The LUKOIL system of corporate governance aims to create and maintain secure relations of trust<br />
with the investor and shareholder community, thus supporting further increase of the Company's<br />
attractiveness for investors.<br />
76
<strong>ANNUAL</strong> <strong>REPORT</strong>, <strong>2005</strong><br />
Company management is always open to dialog with investors, as shown by regular meetings of top<br />
managers with investors and shareholders, organization of visits to production areas for representatives<br />
of the investment community, and holding of conference calls and internet broadcasts on the<br />
occasion of financial information disclosure and presentation of other important Company events.<br />
In <strong>2005</strong> Standard & Poor's once again designated LUKOIL as the leading Russian oil company for informational<br />
transparency. LUKOIL achieved a score of 68% (for comparison, the average score by UK<br />
companies is 71%).<br />
DIVIDENDS<br />
LUKOIL bases its dividend policy on a balance of interests between the Company and its shareholders,<br />
aiming to increase the Company's investment attractiveness and capitalization, and to respect and<br />
strictly observe the rights of shareholders, as set out in acting legislation of the Russian Federation,<br />
the Company Charter and its internal documents.<br />
In making per share dividend recommendations to the AGM the Board of Directors treats as axiomatic<br />
that dividend payment should not be less than 15% of net profit under consolidated US GAAP.<br />
Dividends Paid for the Previous Year,<br />
$ million<br />
800<br />
600<br />
400<br />
200<br />
244<br />
423<br />
467<br />
661<br />
746<br />
The Company has steadily increased dividend payments.<br />
Dividends for <strong>2005</strong> recommended by the BoD for<br />
approval at the AGM on 28 June, 2006, are 33 roubles<br />
($1.20) per common share, which is 17.9% more than for<br />
2004. Dividend yield is 1.3%. Factual dividend payouts by<br />
LUKOIL in <strong>2005</strong> were $746 million, representing 17.6%<br />
of consolidated net profit for 2004 under US GAAP.<br />
Income per common share rose by 52.1% in <strong>2005</strong> to<br />
$7.91, compared with $5.20 in 2004.<br />
0<br />
2001<br />
2002<br />
2003<br />
2004 <strong>2005</strong><br />
Year Par value of shares Common share dividend, roubles Preferred share dividend, roubles<br />
1999 0.025 3.00 17.45<br />
2000 0.025 8.00 59.16<br />
2001 0.025 15.00 –<br />
2002 0.025 19.50 –<br />
2003 0.025 24.00 –<br />
2004 0.025 28.00 –<br />
<strong>2005</strong>* 0.025 33.00 –<br />
* Dividends recommended by the LUKOIL BoD for approval at the Company AGM on 28 June, 2006.<br />
78
THE MARKET FOR COMPANY SECURITIES<br />
Record Growth of Capitalization<br />
Growth of Company capitalization set a new record in <strong>2005</strong>. The price of LUKOIL shares on the RTS<br />
Exchange grew by 95.7% compared with 83.3% rise by the RTS Index and 25.1% rise of the Bloomberg<br />
Oils Index, which measures capitalization of major international oil companies. The market thus continued<br />
to value the Company above Index levels, proving major growth of LUKOIL investment attractiveness.<br />
CORPORATE GOVERNANCE<br />
The rapid growth of LUKOIL capitalization was due to a number of factors. External factors included:<br />
high prices for oil and petroleum products on world markets; rise of investor interest in emerging markets<br />
and Russia's relatively favourable macroeconomic situation. However, internal factors had an<br />
equally important role in growth of the Company's shareholder value. Internal factors included:<br />
increase of efficiency in all business segments; growth of operating indicators; improvement of corporate<br />
governance; and increase of financial and informational transparency. Increase of the Company<br />
share price was helped by demand for shares from LUKOIL's strategic partner, ConocoPhillips, which<br />
raised its stake in LUKOIL capital from 10% to 16.1% in the course of the year.<br />
During the reporting year the Company's shares were traded inside Russia on the MICEX Exchange<br />
and the RTS Exchanges. Programs of American and Global Depositary Receipts (ADRs and GDRs) on<br />
Company shares continued to operate through <strong>2005</strong>. The depositary receipts were traded on the US<br />
over-the-counter market and on stock exchanges in London, Berlin, Frankfurt, Munich and Stuttgart.<br />
The Company was the leader by trading volumes in <strong>2005</strong> among foreign companies, ADRs of which<br />
are bought and sold via the LSE's IOB system (the main LSE market for trading liquid overseas securities).<br />
The Company's share in average monthly trading of overseas stocks in the IOB system was<br />
nearly 25%. Average monthly trading volume in LUKOIL securities on the LSE rose by nearly 50% to<br />
$2.7 billion compared with $1.8 billion in 2004.<br />
In May <strong>2005</strong> the ratio of underlying Company shares to ADRs in the two most liquid depositary receipt<br />
programs was changed from one receipt per four common shares to one receipt per one common<br />
share. The main point of the change was to increase liquidity and attractiveness of depositary receipts<br />
for all categories of investors.<br />
Monthly Trading in LUKOIL Shares and Depositary Receipts, $ million<br />
12,000<br />
10,000<br />
8,000<br />
6,000<br />
4,000<br />
2,000<br />
0<br />
01.05 02.05 03.05 04.05 05.05 06.05 07.05 08.05 09.05 10.05 11.05 12.05<br />
MICEX RTS LSE FSE US OTC<br />
79
<strong>ANNUAL</strong> <strong>REPORT</strong>, <strong>2005</strong><br />
Total depositary receipts issued on LUKOIL common shares at the end of <strong>2005</strong> were equivalent to<br />
547 million shares (64.3% of authorized capital).<br />
Increase of Company efficiency and improvement of its corporate governance led to steady growth of<br />
investor interest in LUKOIL securities through <strong>2005</strong>. Turnover of shares and ADRs in the fourth quarter<br />
of <strong>2005</strong> on main trading floors (the MICEX and the LSE) was $19.47 billion, which is 130% more<br />
LUKOIL Share Price on the RTS Exchange (<strong>2005</strong>), $<br />
65<br />
60<br />
55<br />
50<br />
45<br />
40<br />
35<br />
30<br />
25<br />
20<br />
01/01/05<br />
+95.7%<br />
03/01/05 05/01/05<br />
07/01/05<br />
09/01/05<br />
11/01/05 12/31/05<br />
LUKOIL Share Price and RTS Index (2004–<strong>2005</strong>), %<br />
290<br />
240<br />
190<br />
140<br />
90<br />
01/01/04<br />
05/01/04<br />
09/01/04<br />
01/01/05<br />
05/01/05<br />
09/01/05 12/31/05<br />
RTS<br />
LUKOIL<br />
LUKOIL Share Price, Bloomberg Oils Index and RTS Index (<strong>2005</strong>), %<br />
210<br />
190<br />
170<br />
150<br />
130<br />
110<br />
90<br />
01/01/05<br />
03/01/05 05/01/05<br />
07/01/05<br />
09/01/05<br />
11/01/05 12/31/05<br />
RTS LUKOIL Bloomberg Oils<br />
80
than in the first quarter of the year. The rise was not only due to growth in market value of Company<br />
shares, but also to increase in the number of shares traded. It should be noted that the volume of<br />
LUKOIL securities trading, measured in numbers of shares and ADRs, was 116% greater in the fourth<br />
quarter than in the first quarter on the MICEX (which trades shares), but 13% less on the LSE (which<br />
trades ADRs).<br />
Main <strong>Lukoil</strong> shareholders (stakes larger than 1%)<br />
CORPORATE GOVERNANCE<br />
Number of<br />
shares on<br />
1 January, <strong>2005</strong><br />
% of total<br />
shares on<br />
1 January, <strong>2005</strong><br />
Number of<br />
shares on<br />
1 January, 2006<br />
% of total<br />
shares on<br />
1 January, 2006<br />
ING Bank (Eurasia)*, of which: 535,975,699 63.01% 552,427,066 64.95%<br />
Capital Group** 26,025,136 3.06% 12,662,836 1.49%<br />
Springtime Holdings Limited 20,328,000 2.39% 72,122,000 8.48%<br />
SDK Garant* 87,986,591 10.34% 83,105,166 9.77%<br />
DK URALSIB* 69,560,926 8.18% 74,802,000 8.79%<br />
KB Citibank*, of which: 66,322,006 7.80% 68,313,541 8.03%<br />
Springtime Holdings Limited 64,638,729 7.60% 64,638,729 7.60%<br />
National Depository Center* 22,056,584 2.59% 14,736,859 1.73%<br />
Depository-Clearing Company* 17,982,613 2.11% 19,159,472 2.25%<br />
* Nominee<br />
**Data pursuant to SEC forms N-CSR and N-Q and also based on information published by Fund companies<br />
BOARD OF DIRECTORS AND MANAGEMENT COMMITTEE<br />
Board of Directors<br />
Valery Grayfer<br />
Chairman of the LUKOIL Board of Directors,<br />
CEO of RITEK<br />
Born 1929<br />
Graduated in 1952 from Moscow's Gubkin Oil Institute. Doctoral Candidate in Technical Sciences. Awarded five orders, four medals, and<br />
a diploma of the Supreme Soviet of the Tatar ASSR. Deputy to the USSR Oil Industry Minister from 1985, Head of the Tyumen Main Office<br />
for the Oil & Gas Industry. From 1992, CEO of the Russian Innovative Fuel and Energy Company (RITEK). Chairman of the Board of<br />
Directors of LUKOIL from 2000.<br />
Professor of the Gubkin Russian State Oil & Gas University, Lenin Prize Winner and Russian Government Prize Winner.<br />
Vagit Alekperov<br />
Chairman of the LUKOIL Management Committee<br />
President of LUKOIL<br />
Born 1950<br />
Graduated in 1974 from the Azizbekov Institute of Oil and Chemistry in Azerbaijan. Doctor of Economics, current Member of the Russian<br />
Academy of Natural Sciences. Awarded four orders and eight medals. Worked from 1968 in the oil industry in Azerbaijan and Western<br />
Siberia. From 1987 to 1990 CEO of Kogalymneftegaz (oil production company), a division of Glavtyumenneftegaz within the Ministry of<br />
the Oil & Gas Industry of the USSR. From 1990 to 1991, Deputy, then First Deputy to the USSR Oil & Gas Industry Minister. From 1992<br />
to 1993 President of Langepasuraykogalymneft (oil production group). Chairman of the Board of Directors of LUKOIL from 1993 to 2000.<br />
President of LUKOIL from 1993.<br />
81
<strong>ANNUAL</strong> <strong>REPORT</strong>, <strong>2005</strong><br />
Mikhail Berezhnoi<br />
President of Non-state Pension Fund LUKOIL-Garant<br />
Member of the LUKOIL BoD Committee on Audit<br />
Born 1945<br />
Graduated in 1974 from the Saratov Institute of Law. Doctoral Candidate in Philosophy. CEO of the Non-state pension fund LUKOIL-Garant<br />
from 1994.<br />
Oleg Kutafin<br />
Independent Director<br />
Rector of the Moscow State Law Academy<br />
Chairman of the LUKOIL BoD Committee on Audit<br />
Born 1937<br />
Graduated in 1959 from Moscow State University. Professor and Doctor of Law. Member of the Russian Academy of Science. Rector of<br />
Moscow State Academy of Law from 1987. Chairman of the Russian Presidential Commission on Nationality. Honored 'For Service to<br />
Russia' order (2nd, 3d and 4th grades), and awarded 10 medals.<br />
Ravil Maganov<br />
First Vice-President of LUKOIL (Exploration & Production)<br />
Member of the LUKOIL BoD Committee on Strategy and Investment<br />
Born 1954<br />
Graduated in 1977 from Moscow's Gubkin Oil & Gas Institute. Honored Employee of the Oil and Gas Industry of the Russian Federation.<br />
Awarded two orders and three medals. Chief Engineer, Deputy CEO, CEO of Langepasneftegaz (oil production company) from 1988 to<br />
1993. Vice-President of LUKOIL from 1993 to 1994. First Vice-President of LUKOIL from 1994.<br />
Richard Matzke<br />
Independent Director<br />
Chairman of the LUKOIL BoD Committee on Strategy and Investment<br />
Born 1937<br />
Graduated from Iowa State University (1959), Pennsylvania State University (1961), and St. Mary's College in California (1977). Master of<br />
Geology, MBA. President of Chevron Overseas Petroleum and Member of the Board of Directors of Chevron Corporation from 1989 to<br />
1999. Vice-Chairman of Chevron Corporation and Chevron-Texaco Corporation from 2000 until 2002.<br />
Kevin Meyers<br />
Russia/Caspian Regional President of ConocoPhillips<br />
Member of the LUKOIL BoD Committee on Strategy and Investment<br />
Born 1953<br />
Graduated in 1975 from Capital University with a Bachelor's Degree in Chemistry and Mathematics, and in 1980 from the Massachusetts<br />
Institute of Technology. Doctorate in Chemical Engineering. President of Arco Alaska from 1998. President of ConocoPhillips Alaska from<br />
2000. Russia/Caspian Region President of ConocoPhillips from November 2004 to the present.<br />
Sergei Mikhailov<br />
Independent Director<br />
Chairman of the BoD of Management-Center<br />
CEO of the company Management-Consulting<br />
Member of the LUKOIL BoD Committee on Audit<br />
Member of the LUKOIL BoD Committee on Personnel and Remuneration<br />
Born in 1957<br />
Graduated in 1979 from Dzerzhinsky Military Academy, in 1981 from the Moscow Aviation Institute (Further Qualification Faculty), in 1998<br />
from the Plekhanov Russian Economics Academy. Doctoral Candidate in Technical Sciences, Doctor of Economic Sciences, Professor.<br />
Awarded four medals. 1974–1992, service in armed forces. Head of Department, Deputy Chairman of the Russian Federal Property Fund<br />
from 1992 to 1996. Head of Restructuring and Investment Department of Ministry of Industry in 1996–1997. CEO of Management Center<br />
(management company) from 1997 to 2003. Chairman of the BoD of Management-Center, CEO of the company Management-Consulting<br />
from 2003.<br />
Igor Sherkunov<br />
Chairman of the Board of Directors of Capital Investment Group<br />
Member of the LUKOIL BoD Committee on Strategy and Investment<br />
Born 1963<br />
Graduated in 1985 from the Moscow Finance Institute, and in 1993 from the All-Union Academy of Foreign Trade. Vice-President of<br />
LUKOIL Insurance Company from 1993 to 1996. CEO of LUKOIL-Reserve-Invest from 1996 to 2002. Chairman of the Board of Directors<br />
of Capital Investment Group from 2003.<br />
82
Alexander Shokhin<br />
Independent Director<br />
President of the Russian Union of Industrialists and Entrepreneurs (Employers)<br />
Chairman of the Coordination Council of Russian Entrepreneur Unions<br />
President of the State University-Higher School of Economics<br />
Chairman of the Supervisory Council of Renaissance Capital Investment Group<br />
Member of the Social Chamber of the Russian Federation<br />
Member of the Inter-departmental Commission of the Security Council of the Russian Federation<br />
Member of the Competitiveness and Enterprise Council of the Russian Federal Government<br />
Member of the Government Consultative Council for Foreign Investments in Russia<br />
Member of the Government Commission for Administrative Reform<br />
Member of the Presidential Council for Realization of Priority National Projects<br />
Chairman of the LUKOIL BoD Committee on Personnel and Remuneration<br />
Born 1951<br />
Graduated from Moscow State University in 1974, Doctor of Economic Science, Professor, Member of the Russian Academy of Natural<br />
Sciences. Awarded the Order of Honor and a Medal on the occasion of the 850th anniversary of the founding of Moscow. Began working<br />
career in 1969. Deputy Chairman of the Government of the Russian Federation, Minister of the Economy, Minister for Labor and<br />
Employment (1991–1994). Deputy of the State Duma of the Russian Federation (1994–2002). First Deputy Chairman of the State Duma<br />
of the Russian Federation (1996–1997). Chairman of Duma Fraction 'Our Home is Russia' (1997–1998). Deputy Chairman of the Russian<br />
Government in 1998. Chairman of the Supervisory Council of Renaissance Capital Investment Group (2002 to present). Chairman of the<br />
Coordination Council of Russian Entrepreneur Unions (from 2004). Currently Chairman of the Coordination Council of the Russian Union of<br />
Industrialists and Entrepreneurs (Employers).<br />
CORPORATE GOVERNANCE<br />
Nikolai Tsvetkov<br />
Executive Chairman of URALSIB<br />
Member of the LUKOIL BoD Committee on Personnel and Remuneration<br />
Born 1960<br />
Graduated in 1980 from Dzerzhinsky Military Aviation Engineering School in Tambov, in 1988 from the Zhukovsky Air Force Academy and<br />
in 1996 from the Plekhanov Russian Economics Academy. Doctoral Candidate in Economics. President of NIKoil Oil Investment Company,<br />
Executive Director of LUKOIL's Securities Department, Vice-President of LUKOIL from 1994 to 1997. President of NIKoil investment bank<br />
from 1998 to 2003. Chairman of AVTOBANK-NIKOIL bank from 2003 to <strong>2005</strong>. Executive Chairman of URALSIB from <strong>2005</strong> to the present.<br />
LUKOIL Management Committee<br />
Vagit Alekperov<br />
Chairman of the LUKOIL Management Committee<br />
President of LUKOIL<br />
Born 1950<br />
Graduated in 1974 from the Azizbekov Institute of Oil and Chemistry in Azerbaijan. Doctor of Economics, current Member of the Russian<br />
Academy of Natural Sciences. Awarded four orders and eight medals. Worked from 1968 in the oil industry in Azerbaijan and Western<br />
Siberia. From 1987 to 1990 CEO of Kogalymneftegaz (oil production company), a division of Glavtyumenneftegaz within the Ministry of<br />
the Oil & Gas Industry of the USSR. From 1990 to 1991, Deputy, then First Deputy to the USSR Oil & Gas Industry Minister. From 1992<br />
to 1993 President of Langepasuraykogalymneft (oil production group). Chairman of the Board of Directors of LUKOIL from 1993 to 2000.<br />
President of LUKOIL from 1993.<br />
Anatoly Barkov<br />
Vice-President, Head of the Main Division of General Affairs, Corporate Security and Communications<br />
Born 1948<br />
Graduated in 1992 from Ufa Oil Institute. Honored Employee of the Oil & Gas Industry of the Russian Federation. Awarded ten medals.<br />
Head of Operations, Head of Oil & Gas Production, Senior Engineer at Kogalymneftegaz from 1987 to 1992. Executive Director, then<br />
Director of the Department of Foreign Projects at Langepasuraykogalymneft in 1992–1993. Vice-President of LUKOIL and Head of the<br />
Main Division of General Affairs, Corporate Security and Communications from 1993.<br />
Jevan Cheloyants<br />
Vice-President, Head of the Main Division of Oil and Gas Production and Infrastructure<br />
Born 1959<br />
Graduated in 1981 from Grozny Oil Institute. Honored Employee of the Oil & Gas Industry. Awarded four medals. Section Head, then<br />
Deputy CEO for Foreign Economic Affairs of Langepasneftegaz from 1990 to 1993. Vice-President of LUKOIL for Foreign Market Trading<br />
from 1993 to 1995. Vice-President of LUKOIL and Head of the Main Department for Maritime and Foreign Projects from 1995 to 2001.<br />
Vice-President, Head of the Main Division of Oil & Gas Production and Infrastructure from 2001.<br />
83
<strong>ANNUAL</strong> <strong>REPORT</strong>, <strong>2005</strong><br />
Leonid Fedun<br />
Vice-President of LUKOIL, Head of Main Division of Strategic Development and Investment Analysis<br />
Born 1956<br />
Graduated in 1977 from Rostov Nedelin Higher Military School. Doctoral Candidate in Philosophy. Awarded seven medals. CEO of LUKOIL<br />
Consulting from 1993 to 1994. Vice-President of LUKOIL and Head of Strategic Develpoment and Investment Analysis from 1994.<br />
Evgueny Havkin<br />
Secretary of the Board of Directors, Head of the BoD Office<br />
Born 1964<br />
Graduated in 2003 from Moscow Institute of Economy, Management and Law. Awarded two medals. Worked in oil companies in West<br />
Siberia from 1988. Deputy Head of the BoD Office, First Deputy Head of the BoD Office of LUKOIL from 1997 to 2003. BoD Secretary,<br />
Head of the BoD Office of LUKOIL from 2003.<br />
Lyubov Khoba<br />
Chief Accountant<br />
Born 1957<br />
Graduated in 1992 from the Sverdlov Institute of National Economy. Doctoral Candidate of Economic Science. Honored Economist of the<br />
Russian Federation. Awarded two medals. Senior Accountant at Kogalymneftegaz from 1991 to 1993. Senior Accountant at LUKOIL from<br />
1993 to 2000. Vice-President of LUKOIL, Head of Financial Accounting from 2000 to 2003. Senior Accountant and Vice-President of<br />
LUKOIL from 2003 to 2004. Chief Accountant of LUKOIL from 2004.<br />
Sergey Kukura<br />
First Vice-President for Economics and Finance<br />
Born 1953<br />
Graduated in 1979 from the Ivano-Frankov Institute of Oil & Gas. Doctor of Economic Science. Honored Economist of the Russian<br />
Federation. Awarded an order and five medals. Vice-President of Langepasuraykogalymneft from 1992 to 1993. First Vice-President of<br />
LUKOIL from 1993.<br />
Ravil Maganov<br />
First Vice-President for Exploration & Production<br />
Born 1954<br />
Graduated in 1977 from Moscow's Gubkin Oil & Gas Institute. Honored Employee of the Oil and Gas Industry of the Russian Federation.<br />
Awarded two orders and three medals. Chief Engineer, Deputy CEO, CEO of Langepasneftegaz (oil production company) from 1988 to<br />
1993. Vice-President of LUKOIL from 1993 to 1994. First Vice-President of LUKOIL from 1994.<br />
Ivan Masliaev<br />
Head of the Main Division of Legal Support<br />
Born 1958<br />
Graduated in 1980 from Moscow State University. Doctoral Candidate in Law. Awarded three medals. Head of the Legal Department of<br />
Langepasuraykogalymneft from 1992 to 1994. Head of the LUKOIL Legal Department from 1994 to 1999. Head of the Main Division of<br />
Legal Support at LUKOIL since 2000.<br />
Alexander Matytsyn<br />
Vice-President, Head of the Main Division of Treasury and Corporate Financing<br />
Born 1961<br />
Graduated in 1984 from Moscow State University. Doctoral Candidate in Economic Science. Awarded two medals. Senior Consultant on<br />
Tax at KPMG-Revikonsult in 1993–1994. CEO of KPMG in 1994–1997. Vice-President, Head of the Main Division of Treasury and Corporate<br />
Finance at LUKOIL from 1997.<br />
Anatoly Moskalenko<br />
Head of the Main Division of Human Resources<br />
Born 1959<br />
Graduated in 1980 from Moscow Higher School of the Armed Forces, from the Military-Diplomatic Academy in 1987, and from the Russian<br />
Presidential Civil Service Academy in <strong>2005</strong>. Awarded four orders and 20 medals. Served in the Armed Forces from 1976 to 2001. Head<br />
of Human Resources Department of LUKOIL from 2001 to 2003. Head of the Main Division of Human Resources at LUKOIL from 2003.<br />
Vladimir Nekrasov<br />
First Vice-President of LUKOIL for Refining & Marketing<br />
Born 1957<br />
Graduated in 1978 from Tyumen Industrial Institute. Doctoral Candidate in Technical Science, Member of the Academy of Mining Sciences.<br />
Awarded an order and three medals. Chief Engineer, CEO of LUKOIL's Kogalymneftegaz from 1992 to 1999. Vice-President of LUKOIL<br />
and CEO of LUKOIL-West Siberia from 1999 to <strong>2005</strong>. First Vice-President of LUKOIL since <strong>2005</strong>.<br />
84
Vagit Sharifov<br />
Vice-President, Head of the Main Division of Control and Internal Audit<br />
Born 1945<br />
Graduated in 1968 from Azerbaijan's Azizbekov Institute of Oil and Gas. Doctor of Economics. Honored Employee of the Oil and Gas<br />
Industry of the Russian Federation. Awarded two orders and six medals. Senior Engineer, CEO of Volgogradnefteprodukt, and LUKOIL-<br />
Volgogradnefteprodukt from 1985 to 1994. CEO of the regional branch of LUKOIL Finance in 1994–1995. CEO of LUKOIL regional office<br />
in Volgograd in 1995–1996. Vice-President of LUKOIL for Petroleum Product Marketing from 1996. Vice-President, Head of the Main<br />
Division of Control and Internal Audit from 2002.<br />
CORPORATE GOVERNANCE<br />
BoD Committees<br />
Strategy and Investment Committee<br />
The purpose of this Committee is to make proposals to the BoD concerning:<br />
design of strategic goals for Company development<br />
analysis of strategic development concepts, programs and plans<br />
dividend amounts and procedure for dividend payment<br />
distribution of Company profit and loss for the financial year<br />
The Committee consists of Richard Matzke (Chairman), Kevin Meyers, Ravil Maganov and Igor<br />
Sherkunov.<br />
Audit Committee<br />
The purpose of this Committee is to make proposals to the BoD concerning:<br />
assessment of quality of services provided by the auditor, and observance by the auditor of auditing<br />
independence<br />
selection and assessment of performance by the auditor<br />
The Committee consists of Oleg Kutafin (Chairman), Mikhail Berezhnoi and Sergei Mikhailov.<br />
Personnel and Remuneration Committee<br />
The purpose of this Committee is to make proposals to the Board concerning:<br />
design of corporate personnel policy<br />
policy and standards in selection of candidates to management positions in the Company, emphasizing<br />
importance of appointing the most highly qualified specialists<br />
The Committee consists of Alexander Shokhin (Chairman), Sergei Mikhailov and Nikolai Tsvetkov.<br />
85
<strong>ANNUAL</strong> <strong>REPORT</strong>, <strong>2005</strong><br />
Shares of BoD and Management Committee members in Charter Capital, as of 31 December, <strong>2005</strong><br />
Members of the BoD and Management Committee Stake, %<br />
Vagit Alekperov 3.56*<br />
Mikhail Berezhnoi 0.005<br />
Valery Grayfer 0.005<br />
Oleg Kutafin –<br />
Ravil Maganov 0.5<br />
Richard Matzke –<br />
Keven Meyers –<br />
Sergei Mikhailov 0.003<br />
Igor Sherkunov 0.04<br />
Alexander Shokhin –<br />
Nikolai Tsvetkov 0.32<br />
Anatoly Barkov 0.08<br />
Jevan Cheloyants 0.1<br />
Leonid Fedun 2.79*<br />
Evgueny Havkin 0.01<br />
Lyubov Khoba 0.34<br />
Sergei Kukura 0.39<br />
Ivan Masliaev 0.02<br />
Alexander Matytsyn 0.3<br />
Anatoly Moskalenko 0.01<br />
Vladimir Nekrasov 0.04<br />
Vagit Sharifov 0.02<br />
* including beneficial interest in Capital Investment Group<br />
Share stakes of BoD and Management Committee members are shown in accordance with Russian<br />
legislative requirements for disclosure of such information, including shares held directly by<br />
Board/Management Committee members, and those held by nominee investors in their names. It<br />
should be noted that stakes in share capital may be calculated differently under the laws of other<br />
countries. In particular the stakes shown in the table above do not correspond to the stakes which<br />
were shown under listing rules of the UK Listing Authority when the Company obtained a listing on<br />
the London Stock Exchange.<br />
Remuneration paid to Management Committee and BoD members*<br />
Paid in <strong>2005</strong>, thousand roubles<br />
Remuneration Salary Bonuses Other payments Total<br />
BoD 47,243** – – 5,746 52,989<br />
Management<br />
Committee<br />
– 313,513 153,057 13,740 480,310<br />
* In the case of BoD members who are also members of the Management Committee, remuneration received for BoD membership<br />
is reflected only in the 'BoD' line, and salaries, bonuses and other payments are reflected only in the 'Management Committee' line.<br />
** The sum includes remuneration to Keven Meyers, which he refused and which was added to Company income<br />
86
The general meeting of shareholders on 24 June, 2004 decided to set remuneration for newly elected<br />
Board directors at $125,000*. There are additional remunerations for carrying out the functions of<br />
Chairman of the Board of Directors, Chairman of a Board Committee, as well as some other remunerations.<br />
The decision of the AGM on 24 June, 2004, concerning size of remuneration and types of expenses,<br />
which are recompensed to LUKOIL BoD members, remains valid until cancellation or change by a general<br />
meeting of LUKOIL shareholders.<br />
CORPORATE GOVERNANCE<br />
The general meeting of shareholders on 28 June, <strong>2005</strong>, decided to keep the level of remuneration<br />
to members of the BoD and Audit Commission, which was decided by the LUKOIL AGM on 24<br />
June, 2004.<br />
The BoD on 19 July, <strong>2005</strong>, determined main conditions of contracts with members of the<br />
Management Committee. These conditions envisage remuneration for members of the Management<br />
Company equal to their basic monthly salary. This payment is subject to achievement of key corporate<br />
targets in the reporting period.<br />
CORPORATE GOVERNANCE AND INFORMATIONAL OPENNESS<br />
Corporate Governance<br />
LUKOIL's system of corporate governance is based on respect for the rights and lawful interests of<br />
all categories of owners and shareholders. Its purposes are to reduce investment risk, make the<br />
Company more attractive for investment, reduce costs of own and borrowed capital, and increase<br />
value of the Company.<br />
Informational Openness<br />
Since receiving a full listing on the London Stock Exchange in 2002 the Company has set up and successfully<br />
operates a system of corporate information disclosure for the investment community. The<br />
Company's policy of informational openness and quality of information disclosure fully comply with<br />
internationally accepted standards and with standards of the LSE.<br />
LUKOIL's information policy includes:<br />
publication of quarterly audited financial accounts under US GAAP;<br />
annual disclosure of the results of international audits of Company hydrocarbon reserves;<br />
conference calls and internet broadcasts for the investment community following publication of<br />
financial results and other important corporate events;<br />
organization of trips for representatives of the investment community to regions where the<br />
Company has industrial activities;<br />
* The remuneration is calculated using the rouble equivalent of $1 at the Russian Central Bank exchange rate on the date of the AGM, at<br />
which payment of the remuneration is decided.<br />
87
<strong>ANNUAL</strong> <strong>REPORT</strong>, <strong>2005</strong><br />
regular meetings with investors and shareholders;<br />
annual publication of the Company’s Analyst DataBook, containing detailed industrial and financial<br />
statistics;<br />
publication every two years of a Company Report on Sustainable Development in the Russian<br />
Federation.<br />
History of LUKOIL Corporate Governance Development<br />
Creation of LUKOIL<br />
Appointment of external auditor (KPMG) and legal consultant (Akin Gump)<br />
Transfer of all subsidiaries to a single share;<br />
first general meeting of shareholders; LUKOIL becomes<br />
first Russian company with a major foreign strategic partner, US ARCO<br />
LUKOIL carries out first-ever issue of American depositary<br />
receipts (ADRs) by a Russian oil company<br />
First annual reserve audit by Miller and Lents<br />
Financial reporting in accordance with US GAAP<br />
1993 1994 1995 1996 1997 1998 2001 2002 2003 2004 <strong>2005</strong><br />
Quarterly financial reporting in accordance with US GAAP;<br />
creation of Internal Audit Division;<br />
exchange of preferred shares for common shares (1:1 ratio)<br />
Full secondary listing on the London Stock Exchange;<br />
start of restructuring program;<br />
three independent BoD directors, representing minority shareholders<br />
Creation of Committees for Strategy and Investment,<br />
Audit, and Personnel and Remuneration;<br />
launch of share incentive scheme for top management<br />
Successful completion of Company privatization;<br />
ConocoPhillips acquires 10% of LUKOIL and the two Companies create a strategic alliance<br />
A representative of ConocoPhillips joins LUKOIL BoD;<br />
LUKOIL and ConocoPhillips start a management exchange program;<br />
changes are made to the Company Charter, significantly extending rights of minority shareholders<br />
Internal Control and Audit<br />
A system of control and internal audit is an inseparable part of corporate governance, guaranteeing<br />
efficiency of Company operations and defence of shareholder and investor interests.<br />
There were 31 control and internal audit checks inside organizations and structural subdivisions of<br />
LUKOIL Group during <strong>2005</strong>, spread over all business segments. Their purpose is to find out whether<br />
88
the Group's organizations and structural subdivisions comply with legal requirements, rules in force<br />
within the Group and its organizations, and international norms and standards.<br />
The main tasks of the checks are:<br />
analysis of efficiency, including investment efficiency, of LUKOIL Group organizations;<br />
ongoing quality monitoring of implementation of internal audit recommendations and compliance<br />
with Company management decisions, which followed previous control and audit checks;<br />
CORPORATE GOVERNANCE<br />
discovering existing risks and preparing recommendations for reducing them, improving the risk<br />
management system;<br />
assessing measures by management of subsidiaries and structural subdivisions of the Company to<br />
ensure stable and efficient functioning of various components of the internal control system;<br />
assessing whether organization and conduct of financial accounting helps to make operating and<br />
financial control more efficient, contributes to further growth of shareholder value and protects<br />
shareholder interests.<br />
There was further monitoring of observance within the Company of the Procedure for Decision-<br />
Making on Participation in Other Organisations, a document approved by the Management Committee<br />
in 2003. A total of 56 relevant deals were considered in <strong>2005</strong>, of which 37 were approved.<br />
The Company has continued work on improvement of its control and internal audit methods. In <strong>2005</strong><br />
internal standards were designed and approved for conduct of control and audit checks of operating<br />
activities by LUKOIL Group organizations in the Exploration & Production and Refining & Marketing<br />
segments.<br />
Overall, the Company has created and successfully operates a system of internal control, which<br />
ensures that the Company's management obtains accurate and objective information on activity of<br />
LUKOIL organizations and structural subdivisions.<br />
89
LUKOIL IN THE CASPIAN REGION<br />
In <strong>2005</strong> LUKOIL marked the 10th anniversary of its business in the Caspian region. In that time<br />
LUKOIL has achieved major successes and built a strong strategic position in one of the world's most<br />
promising oil & gas regions, importance of which for the global economy will steadily grow.<br />
Fields on the Caspian Sea shelf and adjacent fields on land territory of the littoral states are very rich<br />
in hydrocarbon reserves. Expert estimates put potential hydrocarbon reserves in the Caspian region<br />
between 20 and 45 billion tonnes of reference fuel. The region currently accounts for 3.4% of global<br />
hydrocarbon production and the share will grow steadily as new projects come on stream. The Caspian<br />
is conveniently located to supply its hydrocarbons both to Europe and to the Asia-Pacific and US<br />
markets. Ongoing development of transport infrastructure in the region helps to increase its significance<br />
for the world hydrocarbon market.<br />
Nearly all of the major international oil companies (ExxonMobil, ВР, ConocoPhillips, Chevron, Shell,<br />
Norsk Hydro, Total, ENI, etc.) are working along with LUKOIL in the Caspian region.<br />
90
<strong>ANNUAL</strong> <strong>REPORT</strong>, <strong>2005</strong><br />
Projects of LUKOIL Group in the Caspian Region<br />
RUSSIAN FEDERATION<br />
Volgograd<br />
LUKOIL-Nizhnevolzhskneft<br />
Karachaganak<br />
Atyrau<br />
Alibekmola<br />
Kozhasai<br />
Aktyubinsk<br />
KAZAKHSTAN<br />
ASTANA<br />
Karaganda<br />
Kumkol<br />
Novorossiysk<br />
CPC<br />
Astrakhan<br />
Northern Caspian<br />
fields<br />
Arman<br />
Dostyk<br />
North<br />
Buzachi<br />
Tengiz<br />
Karakuduk<br />
D-222<br />
Shimkent<br />
Shakh Deniz<br />
Estimates of Resource Potential in the Caspian Region, billion tonnes of reference fuel<br />
Russian Industry and Energy Ministry 22<br />
US Department of Energy 27–30<br />
International Institute of Strategic Studies (London) 45<br />
LUKOIL is carrying out exploration work and production of oil & gas both on the Caspian Sea shelf and<br />
at onshore fields in the littoral states. During the last 5 years of work in the Caspian region LUKOIL<br />
has invested about $1.4 billion in development of its resource base, and more than $2 billion in acquisition<br />
of producing assets. Proved, probable and possible reserves of LUKOIL in the Caspian region at<br />
the end of <strong>2005</strong> were 8.47 billion boe (21.8% of Group reserves). Daily production in <strong>2005</strong> was<br />
178,000 boe, representing 9.2% of total production by the Group.<br />
92
THE CASPIAN SEA<br />
The Caspian littoral states (Russia, Azerbaijan, Iran, Kazakhstan and Turkmenistan) are gradually<br />
resolving issues connected with the legal status of the Caspian and rights to use of its resources.<br />
Although it has not yet been possible to reach universal agreement, major steps towards such<br />
agreement have been taken. On the basis of bilateral agreements (Russia–Azerbaijan and Russia—<br />
Kazakhstan) and a trilateral agreement (Russia–Azerbaijan–Kazakhstan in May 2003) the northern<br />
part of the Caspian Sea, which occupies 64% of its total area and where the biggest hydrocarbon<br />
fields and the main international projects are located, was divided into three parts. As a result<br />
Kazakhstan took 27% of the total area of the Caspian Sea, Russia took 19% and Azerbaijan took<br />
18%. A further step was taken in January <strong>2005</strong> when the Presidents of Russia and Kazakhstan<br />
signed an agreement on the Russian–Kazakh state border, finalizing agreement on the demarcation<br />
line between the states in land and sea parts of the Caspian region.<br />
LUKOIL IN THE CASPIAN REGION<br />
LUKOIL is carrying out work in the Russian sector of the Caspian Sea as well as in the Kazakh and Azerbaijani<br />
sectors. In the Russian sector, LUKOIL is working independently at the North-East, North, Central-Caspian<br />
and Yalama-Samursky license areas. The Company is also working jointly with Gazprom and KazMunaiGaz<br />
at the Central area (LUKOIL has 25% interest in the project, Gazprom also has 25%, and<br />
KazMunaiGaz has 50% interest). LUKOIL is working with Gazprom and YUKOS at the North-Caspian area.<br />
The large amounts of time, effort and money which LUKOIL has invested in development of its resource<br />
base in the Northern Caspian have been rewarded. Geological exploration work carried out by<br />
the Group in the Russian sector of the Sea in 1995–2004 led to discovery of five large fields: Khvalynskoye<br />
(2000); Yu. Korchagin (2000); 170th Kilometer (2001); Rakushechnoye (2001) and Sarmatskoye<br />
(2002). Use of the latest technologies has enabled unprecedented levels of exploration efficiency by<br />
Russian standards: efficiency of exploration drilling has exceeded 15,000 tonnes of reference fuel per<br />
meter drilled (12 times higher than the Company average), and the success rate of prospecting and<br />
exploration drilling has been 100%, i.e. each field was discovered by the first prospecting well, which<br />
was drilled. At the same time the cost of one reference tonne reserve addition was more than ten times<br />
lower than that of major international oil companies.<br />
The history of LUKOIL success in the Northern Caspian<br />
was continued in November <strong>2005</strong>, when the Company<br />
discovered a new oil and gas condensate field –<br />
the V. Filanovsky field. Provisional assessments suggest<br />
that the field is the biggest in the region. The discovery<br />
well gave flows of light, water-free oil at a daily<br />
rate of 6,400 barrels, which is unusually high for Russia<br />
and comparable with rates in the Middle East. Probable<br />
and possible reserves at the new field are estimated<br />
at 600 million barrels of oil and 985 trillion cubic<br />
feet of gas. These reserves will be upgraded to 'proved'<br />
category after supplementary exploration, preparation<br />
and confirmation of project documents for development<br />
and construction of the field.<br />
LUKOIL 3P Reserves Structure<br />
in the Northern Caspian, as of January 1, 2006<br />
Sarmatskoye 14.7% V. Filanovsky 18.9%<br />
Rakushechnoye 15.1%<br />
Yu. Korchagin 14.2%<br />
170 th Kilometer 4.4%<br />
Khvalynskoye 32.7%<br />
93
<strong>ANNUAL</strong> <strong>REPORT</strong>, <strong>2005</strong><br />
Fields and license areas of LUKOIL Group in the Northern Caspian<br />
Rakushechnoye<br />
100%<br />
V. Filanovsky<br />
100%<br />
100%<br />
50%<br />
Sarmatskoye<br />
Khvalynskoye<br />
Yu. Korchagin<br />
100%<br />
KAZAKHSTAN<br />
100%<br />
170 th Kilometer<br />
RUSSIAN<br />
FEDERATION<br />
Yalama-Samur<br />
100%<br />
25%<br />
Tsentralnoye<br />
The new field is the first predominantly oil field at LUKOIL's license areas in the Northern Caspian. Oil represents<br />
78% of total reserves, whereas all other fields, which the Company has discovered in the Caspian, contain<br />
mainly gas. Oil at the Filanovsky field is of remarkably high quality, with density of 44 API and 0.1% sulphur<br />
content. Because of this the oil is expected to have a price premium of $1.5 per barrel to Brent.<br />
Oil production potential at the Filanovsky field exceeds that at previously discovered Caspian fields,<br />
and it is the largest field discovered in Russia in the last 10 years. Preliminary calculations suggest that<br />
peak annual production at the field will be over 5 million tonnes, which will enable LUKOIL to significantly<br />
improve profitability margins of the high-cost Caspian business.<br />
During 10 years of work in the Russian sector of the Caspian Sea LUKOIL has drilled 9 wells, and total estimated<br />
hydrocarbon discoveries in all categories (proved, probable and possible) are 4.0 billion boe. During the last five<br />
years LUKOIL has spent $200 million on resource base development in the Russian sector of the Caspian Sea.<br />
LUKOIL is currently carrying out supplementary exploration and production preparations at fields in the<br />
Northern Caspian. In <strong>2005</strong> the Astrakhan Shipbuilding Company continued work on an ice-resistant<br />
stationary platform for use by LUKOIL on the Caspian Sea shelf. According to the schedule, the platform<br />
should be ready for towing out to sea in August 2008 and production at the Yu. Korchagin field<br />
will begin in the fourth quarter of the same year.<br />
That will mark the start of commercial oil & gas production at LUKOIL fields in the Northern Caspian.<br />
Other fields will be brought on stream one by one, and daily hydrocarbon production at fields in the<br />
Russian sector of the Caspian Sea should be in excess of 450,000 boe by 2015.<br />
The Caspian Sea has a high level of ecological sensitivity. LUKOIL therefore pays huge attention to<br />
ecological aspects of its work in the Caspian and treats avoidance of environmental hazards as the basic<br />
principle of its strategy in the region.<br />
94
In its Caspian Sea fields development LUKOIL complies with principles of the Tehran Convention for Protection<br />
of the Marine Environment of the Caspian Sea (2003). Before beginning work in the Caspian LU-<br />
KOIL carried out all necessary studies and took account of all the environmental protection measures,<br />
which would be necessary, including compensation and socio-ecological aspects. The Company also devised<br />
technical and technological solutions for exploration work and drilling on a 'zero-discharge' basis.<br />
In 2004 LUKOIL won a prize for its contribution to strengthening of ecological security and sustainable<br />
development in Russia at the National Ecology Awards based on the Company's project, entitled<br />
'Geological exploration work and hydrocarbon field development in the preserved area of the Northern<br />
Caspian – ecologically efficient investments in sustainable development of the Lower Volga region'.<br />
LUKOIL IN THE CASPIAN REGION<br />
In addition to its work in the Russian sector of the Caspian, LUKOIL is also carrying out work in the<br />
Kazakh sector (the Tyub-Karagan and Atashsky projects) and the Azerbaijani sector (the D-222 and<br />
Shakh-Deniz projects).<br />
LUKOIL entered the offshore projects, Tyub-Karagan and Atashsky, in 2004. The first exploration well<br />
at Tyub-Karagan, with depth of 2,500 meters, was drilled in <strong>2005</strong> following completion of 2D seismic<br />
work. However, the well was dismantled for geological reasons. 2D seismic work, geoelectrics and<br />
geological engineering studies continued in <strong>2005</strong> at the neighboring Atashsky field in preparation for<br />
drilling of the first exploration well. Both projects are being implemented jointly with the Kazakh national<br />
oil company KazMunaiGaz. Geological reserves at the license areas are estimated at 3.6 billion<br />
barrels of oil and 2.8 trillion cubic feet of gas.<br />
The D-222 block in the Azerbaijani sector of the Caspian Sea is a continuation of the Yalama-Samursky license<br />
area in the Russian sector of the Sea. LUKOIL is carrying out geological exploration at the block jointly<br />
with the State Oil Company of Azerbaijan, which has 20% interest in the project. Drilling of a 4,500-<br />
meter exploration well was completed in <strong>2005</strong>. The work, which was carried out on a 'zero-discharge'<br />
basis, found gas traces and provided unique geological information about sub-soil structures in the central<br />
part of the Caspian, where drilling had never previously been attempted. Commercial hydrocarbon res-<br />
95
<strong>ANNUAL</strong> <strong>REPORT</strong>, <strong>2005</strong><br />
erves were not discovered. The well was dismantled for geological reasons and work began on drilling of<br />
a second well. Geological reserves at the block are currently estimated at 6.6 billion boe.<br />
The LUKOIL Caspian offshore project, which is nearest to the production phase, is Shakh-Deniz. Work<br />
was completed in <strong>2005</strong> on construction of the production platform, underwater pipelines and the<br />
South Caucasus Export Gas Pipeline (Baku–Tbilisi–Erzerum). Production of gas and condensate will<br />
begin in the third quarter of 2006. Daily output at Shakh Deniz is expected to reach 360,000 boe by<br />
2015. LUKOIL has a 10% interest in the project. Other participants are Total (10%), NICO (10%), State<br />
Oil Company of Azerbaijan (10%), TRAO (9%), Statoil (25.5%) and BP (25.5%, operator).<br />
CASPIAN REGION<br />
In its efforts to secure a leading position in the Caspian region, LUKOIL is pursuing on-shore exploration<br />
and field development projects on the territory of Caspian littoral states in addition to its projects<br />
on the Caspian Sea shelf.<br />
LUKOIL has long-established production operations in the Lower Volga region, where it produces<br />
about 75,000 boe of hydrocarbons per day. The Company is working hard to expand its resource base<br />
in this region. In <strong>2005</strong> the Company acquired a controlling stake in Primorieneftegaz, the owner of<br />
licenses for geological study of the Poimenny license area, located 60 kilometers to the north of Astrakhan<br />
between the Volga and Akhtuba rivers. The promising Tsentralno-Astrakhanskoye field was<br />
discovered in this area in 2004 when a daily flow of 9.2 million cubic feet of gas and 700 barrels of<br />
condensate was obtained from a borehole at depth of 4,188 meters. The Tsentralno-Astrakhanskoye<br />
field is remarkable for the unique composition of its formation fluids and abnormally high strata pressure.<br />
Probable and possible reserves are nearly 1.2 billion barrels of condensate and 9.8 trillion cubic<br />
feet of gas. The field is geographically well-placed, because southern Russia is not rich in gas and because<br />
the trunk gas pipeline from Central Asia to Central Russia is only 300 kilometers away. Daily<br />
production at the Tsentralno-Astrakhanskoye field could exceed 400,000 boe.<br />
96
LUKOIL is also implementing a number of projects in Kazakhstan (Karachaganak, Tengiz, Kumkol). The<br />
Group's share of daily production by these projects in <strong>2005</strong> was 96,000 boe, which is 4.9% of total<br />
production by the Group. All of these projects are moving ahead successfully.<br />
Construction work and drilling of new wells was carried out at Kumkol in <strong>2005</strong>. A total of 12 new wells<br />
with average daily production of 16.6 tonnes were brought on stream, and a project was drawn up for<br />
construction of a gas liquefaction facility with annual capacity of 300 million cubic meters.<br />
A program of multilateral well drilling was completed at the giant Karachaganak field. Two multilateral<br />
wells were drilled, with average daily flow rates of 1,013.5 tonnes. Production of stable condensate<br />
reached the planned daily level of 153,000 barrels. A project was drawn up for construction<br />
of a 150-kilometer trunk gas pipeline from Karachaganak to Uralsk, in order to provide gas<br />
supply to all parts of Western Kazakhstan Region.<br />
LUKOIL IN THE CASPIAN REGION<br />
LUKOIL's acquisition in <strong>2005</strong> of the company Nelson Resources<br />
Limited was part of the Group's strategy of transformation into a<br />
global energy company, but it also had the specific aim of<br />
strengthening Group positions in the Caspian region. Nelson Resources<br />
is taking part in hydrocarbon production projects at a number<br />
of fields in the western part of Kazakhstan (Alibekmola,<br />
Kozhasai, Karakuduk, North Buzachi and Arman). Nelson is the joint<br />
operator in most of these projects. In addition the company has<br />
an option agreement at two exploration blocks in the Kazakh sector<br />
of the Caspian Sea (South Zhambai and South Zaburuniye).<br />
Production by Nelson<br />
Resources Limited (share),<br />
million tonnes<br />
2.0<br />
1.5<br />
1.0<br />
0.5<br />
0.875<br />
1.222<br />
1.608<br />
Proved reserves of Nelson Resources Limited at the end of <strong>2005</strong><br />
were 172 million barrels. Average daily oil production in <strong>2005</strong> was<br />
0.0<br />
2003<br />
2004<br />
<strong>2005</strong><br />
32,000 barrels or 1.8% of total LUKOIL production. Consolidation<br />
of Nelson Resources by LUKOIL began in mid-October <strong>2005</strong>.<br />
Assets of Nelson Resources Limited<br />
Arman field<br />
50%<br />
50%<br />
Kazakhoil-Aktobe<br />
(the Alibekmola<br />
and Kozhasai fields)<br />
Karakuduk field<br />
76%<br />
North Buzachi<br />
field<br />
50%<br />
97
<strong>ANNUAL</strong> <strong>REPORT</strong>, <strong>2005</strong><br />
The company's resource base has high levels of productivity, as confirmed by rapid production growth<br />
rates in recent years. According to forecasts, daily oil production by Nelson Resources will increase to<br />
75,000 barrels by 2009.<br />
Acquisition of Nelson Resources for $1,951 million (the company also had net debt of $60 million at<br />
the time of the acquisition) was the biggest deal in LUKOIL's history and enabled the Company to rise<br />
from 9th to 4th place among the biggest hydrocarbon producers in Kazakhstan.<br />
TRANSPORT PROJECTS IN THE CASPIAN REGION<br />
Company management is aware that LUKOIL's strategically important position in the Caspian region<br />
depends on development of transport infrastructure. LUKOIL is therefore taking an active part in transport<br />
projects, particularly that being implemented by the Caspian Pipeline Consortium (CPC).<br />
The CPC is 1,510-kilometer oil pipeline linking the Tengiz field with South Ozereyevka sea terminal<br />
near Novorossiysk. The first framework agreement on construction of the CPC was signed in mid-<br />
1992 between Kazakhstan, Oman and Russia. The first phase of the pipeline with annual throughput<br />
capacity of 28.2 million tonnes was launched at the end of 2001. In October 2004 it was decided<br />
to increase the CPC capacity to 67 million tonnes by 2008. The first oil tanker, supplied via the<br />
CPC, was loaded with oil in October 2001.<br />
LUKOIL's share of production at the Tengiz oil field has been transported via the CPC since its commissioning<br />
in 2001. In October 2003 LUKOIL and Petrokazakhstan completed construction of the<br />
Kumkol–Dzhusali pipeline, which enables deliveries of oil from the Kumkol field via the CPC (oil is transported<br />
to Dzhusali by pipeline and from there by railway to the CPC). In May 2004 the<br />
Karachaganak–Atyrau pipeline was completed, allowing LUKOIL's stable gas condensate from Karachaganak<br />
to be pumped via the CPC. Finally, in November 2004 completion of a railway oil terminal adjacent<br />
to the Kropotkinskaya Pumping Station made it possible to feed LUKOIL crude from Volga and Western<br />
Siberian fields into the CPC (1.4 million tonnes of crude were transported by these means during <strong>2005</strong>).<br />
In addition to the CPC and associated pipeline projects in Kazakhstan LUKOIL has built an oil export terminal<br />
at Ilinka in Astrakhan Region. The first phase of the terminal was commissioned in October 2003.<br />
Transport Volumes via<br />
the CPC, million tonnes<br />
40<br />
CPC Shareholder Structure (01.01.2006)<br />
BG (2.0%)<br />
Rosneft – Shell (7.5%)<br />
Kazakhstan Pipeline<br />
Ventures (1.75%)<br />
30<br />
20<br />
14.78<br />
22.51<br />
30.50<br />
Oryx CP (1.75%)<br />
Mobil (7.5%)<br />
Agip<br />
International (2.0%)<br />
Russia (24%)<br />
10<br />
LUKArco (12.5%)<br />
Kazakhstan (19%)<br />
0<br />
2003<br />
2004<br />
<strong>2005</strong><br />
Chevron (15%)<br />
Oman (7%)<br />
98
Oil is carried to the terminal by rail, where it is trans-shipped to river-sea tankers. Annual capacity of the<br />
Ilinka terminal is currently 2 million tonnes. The terminal can handle tankers with deadweight up to<br />
5,000 tonnes, and one of its functions is to supply oil to Iran under substitution agreements.<br />
REFINING PROJECTS IN THE CASPIAN REGION<br />
LUKOIL's goals in the region are not limited to realization of oil & gas production projects. The Company<br />
also aims to create value added by refining of hydrocarbons. In <strong>2005</strong> the Company decided to build a gaschemical<br />
complex in Southern Russia for refining of gas and condensate produced in the Caspian region.<br />
The complex will refine more than 14 billion cubic meters of gas and 600,000 tonnes of condensate each<br />
year and will be geographically well-placed (adjacent to domestic markets and with access to export markets).<br />
A feasibility study for investments in the main production facilities is to be carried out in 2006.<br />
LUKOIL IN THE CASPIAN REGION<br />
LUKOIL has also taken part in construction of the Karachaganak Refining Complex with annual capacity for<br />
7 million tonnes of hydrocarbons from the Karachaganak field. The Complex separates mixed hydrocarbon<br />
inputs, carries out dehydration, stabilizes the condensate and feeds it into the pipeline, as well as carrying<br />
out gas treatment. Completion of the<br />
Complex in 2004 allowed stable gas condensate<br />
to be exported through the<br />
LUKOIL Estimated Hydrocarbon Production in the Caspian Region,<br />
thousand boe per day<br />
CPC.<br />
LUKOIL fully recognizes the strategic<br />
1,500<br />
importance of the Caspian region and<br />
intends to continue expansion of its<br />
1,000<br />
business as well as realizing current<br />
projects there. Daily production from<br />
projects already being implemented in<br />
500<br />
the Caspian region is forecast to reach<br />
about 1.3 million barrels by 2015.<br />
0<br />
2006<br />
2007<br />
2008<br />
2009 2010 2011 2012 2013 2014 2015<br />
99
FINANCIAL ACCOUNTS<br />
MANAGEMENT'S DISCUSSION AND ANALYSIS OF FINANCIAL<br />
CONDITION AND RESULTS OF OPERATIONS<br />
The following represents management's analysis of the financial performance and conditions of OAO LUKOIL and significant<br />
trends that may affect its future performance. It should be read in conjunction with our US GAAP consolidated<br />
financial statements and notes and supplemental oil and gas disclosure.<br />
References to "LUKOIL", "the Company", "the Group", "we" or "us" are references to OAO LUKOIL and its subsidiaries and<br />
associates. All dollar amounts are in millions of US dollars, unless otherwise indicated. Tonnes of crude oil produced are<br />
translated into barrels using conversion rates characterizing the density of oil from each of our oilfields. Tonnes of crude oil<br />
purchased as well as other operational indicators expressed in barrels are translated into barrels using an average conversion<br />
rate of 7.33. Billions of cubic feet are translated into millions of oil equivalent barrels using a conversion rate of 0.167.<br />
This report includes forward-looking statements – words such as "believes", "anticipates", "expects", "estimates",<br />
"intends", "plans", etc. – that reflect management's current estimates and beliefs, but are not guarantees of future results.<br />
Please see "Forward-looking statement" on page 179 for a discussion of some of the factors that could cause actual<br />
results to differ materially.<br />
KEY FINANCIAL AND OPERATIONAL RESULTS<br />
<strong>2005</strong><br />
Change<br />
from 2004<br />
2004<br />
Change<br />
from 2003<br />
2003<br />
Sales (including excise and export tariffs) 55,774 64.8% 33,845 53.0% 22,118<br />
Net Income 6,443 51.7% 4,248 14.8% 3,701<br />
Net income excluding cumulative effect<br />
of change in accounting principle and gain<br />
from sale of share in Azeri, Chirag,<br />
Guneshli in 2003 6,443 51.7% 4,248 78.0% 2,386<br />
EBITDA 10,404 44.4% 7,203 27.9% 5,630<br />
Earnings per share of common stock<br />
(US dollars)<br />
Basic earnings 7.91 52.1% 5.20 15.0% 4.52<br />
Diluted earnings 7.79 51.9% 5.13 15.3% 4.45<br />
Crude oil production by consolidated subsidiaries<br />
(thousands of tonnes) 86,193 4.6% 82,408 8.3% 76,072<br />
Crude oil production by the Group<br />
including our share in equity associates<br />
(thousands of tonnes) 90,158 4.6% 86,200 7.4% 80,226<br />
Refined products produced by consolidated<br />
subsidiaries (thousands of tonnes) 44,182 8.2% 40,825 4.1% 39,233<br />
During <strong>2005</strong> net income was $6,443 million, which is $2,195 million more than in the 2004.<br />
The increase in net income resulted from favorable price conditions in <strong>2005</strong> and effective cost control. However,<br />
an increased tax burden has restrained growth of our profitability. This restraining factor as well as other drivers impacting<br />
the results of our operations are considered below in detail.<br />
100
SEGMENT INFORMATION<br />
Our operations are divided into three main business segments:<br />
Exploration and Production – which includes our exploration, development and production operations relating to crude<br />
oil and natural gas. These activities are primarily located within Russia, with additional activities in Azerbaijan,<br />
Kazakhstan, Uzbekistan, the Middle East, Northern Africa and Colombia<br />
Refining, Marketing and Distribution – which includes refining and transport operations, marketing and trading of crude<br />
oil, natural gas and refined products<br />
Chemicals – which includes processing and trading of petrochemical products<br />
Other businesses include banking, finance and other activities. Each of our three main segments is dependent on the<br />
other, with a portion of the revenues of one segment being a part of the costs of the other. In particular, our Refining,<br />
Marketing and Distribution segment purchases crude oil from our Exploration and Production segment. As a result of certain<br />
factors considered in the "Domestic crude oil prices" section on page 103 benchmarking crude oil market prices in<br />
Russia cannot be determined with certainty. Therefore, the prices set for inter-segment purchases of crude oil reflect a<br />
combination of market factors, primarily international crude oil market prices, transportation costs, regional market conditions,<br />
cost of crude oil refining and other factors. Accordingly, an analysis of either of these segments on a stand-alone<br />
basis could give a misleading impression of those segments' underlying financial position and results of operations. For<br />
this reason, we do not analyze either of our main segments separately in the discussion that follows, but we do present<br />
the financial data for each in Note 23 to our consolidated financial statements.<br />
ANALYSIS OF FINANCIAL CONDITION<br />
AND RESULTS OF OPERATIONS<br />
OPERATING DEVELOPMENTS<br />
Restructuring<br />
In <strong>2005</strong> we continued implementing a restructuring plan designed to improve our operations and maximize shareholder<br />
value. The plan included undertaking the following measures in the near term: (i) increase exports of crude oil and refined<br />
products; (ii) accelerate the development of our most productive fields; (iii) shut-in low-producing wells; (iv) apply<br />
enhanced oil recovery technologies; (v) seek competitive bids for oilfield services; (vi) divest non-core businesses, including<br />
certain producing assets where we are not the operator, and reduce headcount; (vii) strengthen performance-related<br />
pay; and (viii) streamline our administration.<br />
The following has been achieved in <strong>2005</strong> and 2004:<br />
Our oil and refined products exports and international sales in <strong>2005</strong> increased by 17.3% in terms of volumes while<br />
domestic oil sales volumes decreased by 58.9%<br />
8 new oil fields and 1 new gas field were brought on line in <strong>2005</strong> (2004: 7 oil fields), which allowed us to increase production<br />
while also shutting in low production wells<br />
425 low production wells were shut in <strong>2005</strong> (2004: 1,161). Average well debits increased to 11.07 tonnes a day<br />
in <strong>2005</strong>, or by 3.5%, compared to 2004<br />
In August 2004 the Company entered into contracts to sell its 99% ownership interest in OAO Bank Petrocommerce<br />
(the "Bank") for $214 million to a group of companies of a related party, whose management and directors include<br />
members of the Group's management and Board of Directors. The Company used an independent valuation in the<br />
determination of the selling price. The transaction was structured to be completed in two phases. The first phase,<br />
representing the sale of 78% of the Group's ownership interest for $169 million was completed on September 22,<br />
2004. The second phase in which the Group is to sell its remaining 21% ownership interest in the Bank for $45 million<br />
was expected to be completed by the end of June 2007. In December <strong>2005</strong> the Group and the buyer cancelled<br />
the contract related to the second phase. Subsequently, in December <strong>2005</strong>, the Group made a public auction on the<br />
sale of its remaining 21% ownership interest in the Bank and entered into a contract with the bidder, the same related<br />
party, at a selling price of $33 million. This transaction is expected to be completed by the end of June 2006<br />
In November 2004 the Company entered into a contract to sell its 100% interest in OOO LUKOIL-Burenie and its<br />
subsidiaries for $69 million. The terms of the contract required signing a five-year contract for drilling services to be<br />
provided to the Group and revising the terms of Group financing previously provided to OOO LUKOIL-Burenie. The<br />
transaction was completed at the end of December 2004<br />
Other achievements in <strong>2005</strong> are described in detail in other parts of this report<br />
101
FINANCIAL ACCOUNTS<br />
Strategic Partnership with ConocoPhillips<br />
In September 2004 LUKOIL entered into a Shareholder agreement forming a broad-based strategic alliance with<br />
ConocoPhillips. In June <strong>2005</strong> LUKOIL and ConocoPhillips finalized the creation of a joint venture to develop resources in<br />
the northern Timan-Pechora area. The joint venture is governed by LUKOIL and ConocoPhillips in equal parts, but with<br />
effective ownership interests of 70% and 30%, respectively. The joint venture was formed by selling to ConocoPhillips<br />
an effective 30% interest in our wholly owned subsidiary OOO Narianmarneftegaz for $529 million. Crude oil production<br />
of OOO Narianmarneftegaz in <strong>2005</strong> was approximately 11 thousand barrels per day.<br />
Recent developments<br />
During the period from November to December <strong>2005</strong> a Group company acquired 51% of the share capital of<br />
OAO Primorieneftegaz for $261 million. OAO Primorieneftegaz is a Russian oil and gas exploration company operating in<br />
the European Russia.<br />
During the period from October 14 to December 5, <strong>2005</strong> a Group company acquired 100% of the share capital of Nelson<br />
Resources Limited ("Nelson") for $1,951 million. Nelson is an exploration and production company operating in western<br />
Kazakhstan. Nelson owns an effective 76% interest in the Karakuduk field, 50% interest in Alibekmola, Kozhasai, North<br />
Buzachi and Arman fields. In addition, Nelson holds an option to acquire a 25% interest in two exploration blocks in the<br />
Kazakhstan sector of the Caspian Sea – South Zhambai and South Zaburunye. The purpose of the acquisition was to<br />
increase the Group's presence in the Kazakhstan oil and gas sector and its international oil and gas reserves.<br />
In November <strong>2005</strong> a Group company acquired the remaining 50% of the share capital of ZAO SeverTEK for $318 million<br />
from Neste Oil Corporation (including $98 million repayment of ZAO SeverTEK debt). The acquisition increased the<br />
Group's ownership stake in ZAO SeverTEK to 100%. ZAO SeverTEK is an exploration and production company operating<br />
within the Komi Republic of the Russian Federation.<br />
In July <strong>2005</strong> a Group company acquired 66.0% of the share capital of OOO Geoilbent for $180 million. OOO Geoilbent is<br />
an exploration and production company operating in the West Siberian region of the Russian Federation. All decisions over<br />
OOO Geoilbent's financing and operating activities require approval by at least a 66.7% majority of the voting rights.<br />
Since the minority shareholder of OOO Geoilbent holds substantive participating rights, the Group accounts for its investment<br />
in OOO Geoilbent using the equity method of accounting.<br />
In July <strong>2005</strong> LUKOIL sold its 100% stake in ZAO Arktikneft, an oil production company, for approximately $40 million,<br />
including about $20 million for settlement of Arktikneft's debt to LUKOIL. ZAO Arktikneft produced 30.3 thousand tonnes<br />
of crude oil in the first half of <strong>2005</strong>.<br />
In June <strong>2005</strong> the Company sold its 38% interest in its construction affiliate ZAO Globalstroy-Engineering – formerly<br />
ZAO LUKOIL-Neftegazstroy for $69 million.<br />
In March <strong>2005</strong> we acquired 100% interest in Oy Teboil Ab and Suomen Petrooli Oy, which are incorporated in Finland,<br />
for $160 million. Oy Teboil Ab and Suomen Petrooli Oy are mainly engaged in the operation of 289 retail gas stations and<br />
132 retail diesel fuel outlets, wholesale of refined oil products as well as production and sale of lubricants.<br />
In January <strong>2005</strong> a Group company acquired an additional 22% interest in LUKOIL Neftochim Bourgas AD for $56 million<br />
(20.7% interest was acquired from a related party for $52 million). The acquisition increased the Group's ownership stake<br />
in LUKOIL Neftochim Bourgas AD to 93.2%. In August <strong>2005</strong> a Group company acquired an additional 4% interest in<br />
LUKOIL Neftochim Bourgas AD for $10 million, thereby increasing the Group's ownership stake in LUKOIL Neftochim<br />
Bourgas AD to 97.2%.<br />
In December 2004 a Group company acquired the remaining 50% interest in LUKAgip N.V. ("LUKAgip") for $143 million<br />
from Eni Group (of which $111 million represents repayment of debt to the Eni Group). The acquisition increased the<br />
Group's ownership in LUKAgip to 100%. LUKAgip owns a 24% interest in the Meleiha Hydrocarbon License Concession<br />
Agreement located onshore in Egypt. It also owns a 10% interest in the Shakh Deniz Exploration, Development and<br />
Production Sharing Agreement, 8% of the midstream gas marketing entity, the Azerbaijan Gas Supply Company, and<br />
100% of LUKAgip Midstream B.V., which holds LUKAgip's 10% interest in the South Caucasus Pipeline Company.<br />
On January 26, 2004 a Group company entered into an agreement with ConocoPhillips to purchase 308 gas stations and<br />
contracts to supply petroleum products to an additional 471 gas stations in the Northeast of the United States of America<br />
for $270 million. The transaction was finalized in May 2004.<br />
102
MAIN MACROECONOMIC FACTORS AFFECTING OUR RESULTS OF OPERATIONS<br />
Change in the price of crude oil and refined products<br />
The price at which we can sell crude oil and refined products is the primary driver of our revenues. During <strong>2005</strong> crude<br />
oil prices steadily increased due to growth of the world economy, driven mainly by the USA and China, and increased<br />
worldwide crude oil consumption accompanied by refining and distribution bottlenecks in some major consuming regions.<br />
In the August <strong>2005</strong> crude oil prices reached their historical records in absolute terms as a result of a crude oil supply<br />
interruption in the USA caused by hurricanes Rita and Katrina. According to International Energy Agency (IEA) in <strong>2005</strong> the<br />
world demand for crude oil and, subsequently, refined products reached the level of 83.3 million barrels per day, which<br />
is 1.3% more than in 2004 and 5.2% more than in 2003. Based on OPEC's data, its actual daily production in <strong>2005</strong><br />
reached 30.0 million barrels a day, or 2.6% more than in 2004, which is near OPEC's full capacity. The current market<br />
situation is also influenced by high political and natural risks, which could cause crude oil production to decrease. This<br />
situation can be viewed as an indicator that crude oil prices will remain steadily high in a medium-term perspective.<br />
Substantially all of the crude oil that we sell for export is the Urals blend. The following table shows the average crude<br />
oil export prices for <strong>2005</strong>, 2004 and 2003 and refined product prices based on Northern Europe averages.<br />
ANALYSIS OF FINANCIAL CONDITION<br />
AND RESULTS OF OPERATIONS<br />
<strong>2005</strong><br />
Change<br />
from 2004<br />
2004<br />
Change<br />
from 2003<br />
2003<br />
(in US dollars per bbl, except for figures in percent)<br />
Brent crude 54.31 41.9% 38.27 33.3% 28.71<br />
Urals crude (CIF Mediterranean)* 50.67 46.9% 34.50 27.6% 27.03<br />
Urals crude (CIF Rotterdam)* 50.12 46.9% 34.13 26.6% 26.96<br />
(in US dollars per metric tonne, except for figures in percent)<br />
Fuel oil 3.5% (FOB Rotterdam) 229.92 51.4% 151.81 2.3% 148.37<br />
Diesel fuel (FOB Rotterdam) 505.01 44.5% 349.37 37.8% 253.53<br />
High-octane gasoline (FOB Rotterdam) 534.11 33.4% 400.33 35.2% 296.13<br />
* The Company sells crude oil on foreign markets on various delivery terms. Thus, the average realized sale price of oil on<br />
international markets differs from the average prices of Urals crude on Mediterranean and Northern Europe markets.<br />
Domestic crude oil prices<br />
Substantially all crude oil produced in Russia is produced by vertically integrated oil companies such as ours, as a result<br />
most transactions are between affiliated entities within vertically integrated groups. Thus, there is no concept of a benchmark<br />
domestic market price for crude oil. Essentially, crude oil prices on traditional international markets will be higher<br />
than those in Russia due to incremental transportation cost incurred to deliver the crude oil from the Russian border to<br />
the markets, and export tariffs. However, the price of crude oil that is produced but not refined or exported by one of the<br />
vertically integrated oil companies is generally determined on a transaction-by-transaction basis against a background of<br />
world market prices, but with no direct reference or correlation. At any time there may exist significant price differences<br />
between regions for similar quality crude oil as a result of the competition and economic conditions in those regions.<br />
Domestic refined product prices<br />
Domestic prices for refined products are determined to some extent by world market prices, but they are also directly<br />
affected by local demand and competition. In general, retail prices on refined products in Russia are comparable to those<br />
in the USA. For example, during <strong>2005</strong> the average retail price on regular gasoline in the USA was about 60 cents per litre,<br />
an increase of 22.0% compared to 2004. In central regions of European Russia the average retail price on gasoline of the<br />
same quality (95 octane) during <strong>2005</strong> was about 57 cents per litre, an increase of 22.0% compared to 2004.<br />
103
FINANCIAL ACCOUNTS<br />
The table below represents average domestic wholesale prices on refined products for respective periods of <strong>2005</strong>, 2004<br />
and 2003.<br />
($/tonne)<br />
<strong>2005</strong><br />
Change<br />
from 2004<br />
2004<br />
Change<br />
from 2003<br />
Fuel oil 122.54 73.1% 70.78 (3.9)% 73.64<br />
Diesel fuel 419.74 47.4% 284.75 39.1% 204.64<br />
2003<br />
High-octane gasoline (Regular) 486.71 27.3% 382.19 35.1% 282.88<br />
High-octane gasoline (Premium) 532.52 25.7% 423.60 33.6% 317.17<br />
Source: Kortes (excluding VAT).<br />
Changes in the US dollar-ruble exchange rate and inflation<br />
A substantial part of our revenues is either denominated in US dollars or is correlated to some extent with US dollar crude<br />
oil prices, while most of our costs in the Russian Federation are settled in Russian rubles. Therefore, the movements of<br />
ruble inflation and exchange rates can significantly affect the results of our operations. In particular, our operating<br />
margins are generally adversely affected by real appreciation of the ruble against the US dollar because this will generally<br />
cause our costs to increase in US dollar terms relative to our revenues.<br />
The following table gives data on inflation in Russia, the nominal change in the ruble-dollar exchange rate, and the level<br />
of real rouble appreciation.<br />
<strong>2005</strong> 2004 2003<br />
Ruble inflation (CPI) 10.9% 11.7% 12.0%<br />
Nominal (devaluation)/appreciation of the exchange rate<br />
(ruble to the US dollar) (3.7)% 5.8% 7.3%<br />
Real appreciation of the exchange rate (ruble to the US dollar) 6.9% 18.5% 20.8%<br />
Average exchange rate for the period (ruble to the US dollar) 28.29 28.82 30.69<br />
Exchange rate at the end of the period (ruble to the US dollar) 28.78 27.75 29.45<br />
Tax burden<br />
Given the relative size of our activities in Russia, our tax profile is largely determined by the taxes payable in Russia (based<br />
on records maintained under Russian legislation – not US GAAP). For <strong>2005</strong>, 2004 and 2003 the tax charge on the Russian<br />
part of our operations was more than 80% of our total tax charge.<br />
In addition to income taxes, we are subject to a number of other taxes in Russia, many of which are based on revenue<br />
or volumetric measures. Other taxes to which we are subject include:<br />
mineral extraction tax<br />
excise and export tariffs<br />
property tax<br />
social taxes<br />
VAT<br />
other local and regional taxes<br />
The effective rates of total taxes and tariffs (total taxes, including income taxes, taxes other than on income and excise<br />
and export tariffs, divided by income before taxes and tariffs) for <strong>2005</strong>, 2004 and 2003, respectively, were 74%, 71%<br />
and 64%. In <strong>2005</strong> tax expenses in Russia were 51.8% of the sales revenue in Russia.<br />
104
The measures that we use for tax planning and management strategies have been based on our understanding of tax<br />
legislation existing at the time of implementation of these measures. We are subject to tax authority audits on an ongoing<br />
basis, as is normal in the Russian environment, and, at times, the authorities have attempted to impose significant additional<br />
taxes on us. We believe that we have adequately met and provided for tax liabilities based on our interpretation of<br />
existing tax legislation. However, the relevant authorities may have differing interpretations and the effects could be<br />
significant. In <strong>2005</strong> the Group recognized an expense of $163 million in relation to the results of tax audits of the Group<br />
companies for periods prior to the 2004 financial year.<br />
The following tables represent average enacted rates for taxes specific to the oil industry in Russia for the respective<br />
periods.<br />
<strong>2005</strong>*<br />
Change<br />
from 2004<br />
2004*<br />
Change<br />
from 2003<br />
2003*<br />
Export tariffs on crude oil $/tonne 130.62 134.2% 55.77 83.5% 30.40<br />
ANALYSIS OF FINANCIAL CONDITION<br />
AND RESULTS OF OPERATIONS<br />
Export tariffs on refined products<br />
Light distillates (gasoline), middle<br />
distillates (jet fuel), diesel<br />
fuel and gasoils $/tonne 92.26 143.2% 37.93 38.6% 27.36<br />
Liquid fuels (fuel oil) $/tonne 52.73 43.9% 36.64 33.9% 27.36<br />
Excise on refined products<br />
High-octane gasoline RUR/tonne 3,629.00 8.0% 3,360.00 12.0% 3,000.00<br />
Low-octane gasoline RUR/tonne 2,657.00 8.0% 2,460.00 12.3% 2,190.00<br />
Diesel fuel RUR/tonne 1,080.00 8.0% 1,000.00 12.4% 890.00<br />
Motor oils RUR/tonne 2,951.00 8.0% 2,732.00 12.0% 2,440.00<br />
Mineral extraction tax RUR/tonne 1,876.26 78.2% 1,052.76 31.4% 801.44<br />
* Average values.<br />
Tax rates set in rubles and translated at the average exchange rates for respective periods are as follows:<br />
<strong>2005</strong>*<br />
Change from<br />
2004<br />
2004*<br />
Change from<br />
2003<br />
2003*<br />
(in USD dollars per tonne)<br />
Excise on refined products<br />
High-octane gasoline 128.29 10.0% 116.59 19.3% 97.76<br />
Low-octane gasoline 93.93 10.0% 85.36 19.6% 71.36<br />
Diesel fuel 38.18 10.0% 34.70 19.7% 29.00<br />
Motor oils 104.33 10.0% 94.80 19.2% 79.51<br />
Mineral extraction tax 66.33 81.7% 36.51 39.8% 26.12<br />
* Average values.<br />
During <strong>2005</strong> our tax burden rose significantly compared to the previous year. Average crude oil export tariffs increased by<br />
134.2% compared to 2004. Approximately 89% of the increase related to growth of crude oil prices, and the remaining<br />
45% resulted from changes in the duty rate calculations effective June 2004 (see below). Export tariffs on gasoline, jet<br />
fuel, diesel fuel and gasoils increased by 143.2%. Excise on refined products in Russia increased by approximately 10.0%.<br />
105
FINANCIAL ACCOUNTS<br />
The mineral extraction tax rate increased by 78.2% compared to 2004. This resulted from an increase of the Urals crude<br />
price and a change in the tax calculation method effective from January 1, <strong>2005</strong>.<br />
The mineral extraction tax rate is determined as follows. Effective from January 1, <strong>2005</strong>, the base rate is set at<br />
419 Rubles per metric tonne extracted (in 2004 – 347 rubles) and is adjusted depending on the international market price<br />
of the Urals blend and the ruble exchange rate. The tax rate is zero when the average Urals blend international market<br />
price for a tax period is less than or equal to $9.00 per barrel (before January 1, <strong>2005</strong> the lower non-taxable threshold<br />
was $8.00 per barrel). As a result, each $1.00 per barrel increase in the international Urals blend price over the threshold<br />
($9.00 per barrel) will effectively result in an increase of the tax rate by $1.61 per tonne extracted (or $0.22 per barrel<br />
extracted using a conversion factor of 7.33). In 2004 each $1.00 per barrel increase in the international Urals blend price<br />
over the threshold ($8.00 per barrel) effectively resulted in an increase of the tax rate by $1.38 per tonne extracted (or<br />
$0.19 per barrel extracted using a conversion factor of 7.33).<br />
In June 2004 the Russian government introduced a new method of crude oil export duty rate calculation with a threelayer<br />
progressive scale. The rate is zero when the average Urals blend international market price is less than or equal to<br />
approximately $15.00 per barrel ($109.50 per metric tonne). If the Urals blend price is in a layer between $15.00 and<br />
$20.00 per barrel ($146.00 per metric tonne), each $1.00 per barrel increase in the Urals blend price over the layer's lower<br />
bound results in an increase of the crude oil export duty rate by $0.35 per barrel exported. If the Urals blend price is in<br />
a layer between $20.00 and $25.00 per barrel ($182.50 per metric tonne), each $1.00 per barrel increase in the Urals<br />
blend price over the layer's lower bound results in an increase of the crude oil export duty rate by $0.45 per barrel exported.<br />
If the Urals blend price is above $25.00 per barrel, each $1.00 dollar per barrel increase in the Urals blend price over<br />
this limit results in an increase of the crude oil export duty rate by $0.65 per barrel exported.<br />
Before June 2004 the crude oil export duty rate was calculated as follows. The rate was zero when the average Urals<br />
blend international market price was less than or equal to approximately $15.00 per barrel. If the Urals blend price was<br />
in a layer between $15.00 and $25.00 per barrel, each $1.00 per barrel increase in the Urals blend price over the layer's<br />
lower bound resulted in an increase of the crude oil export duty rate by $0.35 per barrel exported. If the Urals blend price<br />
was above $25.00 per barrel, each $1.00 dollar per barrel increase in the Urals blend price over this limit resulted in an<br />
increase of the crude oil export duty rate by $0.40 per barrel exported.<br />
Export duty rates on refined products are set by the Russian government. The size of export duty depends on internal<br />
demand on refined products and international crude oil market conditions. Crude oil and refined products exported to CIS<br />
countries, other than Ukraine, are not subject to export duties.<br />
106
OPERATIONAL HIGHLIGHTS<br />
In 2004 our Board of Directors approved the Company's development strategy where we set out targets for the next<br />
10 years. According to this development strategy we plan to have over 3.3 million of oil equivalent barrels of hydrocarbon<br />
production per day by 2014. This represents a 41% increase in crude oil production from the 2004 level and an<br />
8 times increase in gas production compared to 2004. In <strong>2005</strong> we continued to use this strategy as a basis for our business<br />
activities as discussed below.<br />
Crude oil production<br />
In line with our long-term strategy we increased our total daily crude oil production by 4.7% (including the Company's<br />
share in equity associates) and produced 664.3 million barrels (90.2 million tonnes) during <strong>2005</strong>.<br />
<strong>2005</strong><br />
Change<br />
from 2004<br />
2004<br />
Change<br />
from 2003<br />
2003<br />
ANALYSIS OF FINANCIAL CONDITION<br />
AND RESULTS OF OPERATIONS<br />
Daily production of crude oil, including Company's<br />
share in equity associates (thousand barrels per day) 1,820 4.7% 1,738 7.2% 1,622<br />
Own refinery throughput (thousand barrels per day) 945 8.7% 869 2.8% 845<br />
The following table represents our production in <strong>2005</strong> and 2004 by major regions, excluding our share in equity associates.<br />
Change from 2004<br />
(thousands of tonnes)<br />
<strong>2005</strong><br />
Total %<br />
Change in<br />
structure<br />
Organic<br />
growth<br />
2004<br />
Western Siberia 57,345 3.1% - 1,715 55,630<br />
Komi Republic 10,046 5.1% 125 360 9,561<br />
Ural region 10,234 2.2% - 224 10,010<br />
Volga region 3,001 1.1% - 32 2,969<br />
Timan-Pechora<br />
(Nenetsky Autonomous District) 1,739 16.8% (18) 268 1,489<br />
Other in Russia 1,815 31.5% (13) 448 1,380<br />
Crude oil production in Russia 84,180 3.9% 94 3,047 81,039<br />
Crude oil produced internationally 2,013 47.0% 361 283 1,369<br />
Total crude oil produced 86,193 4.6% 455 3,330 82,408<br />
The main oil production region of the Company is Western Siberia. In the oil fields of Western Siberia the Company produced<br />
66.5% of its total production of crude oil in <strong>2005</strong> (67.5% in 2004). The increase of production in Western Siberia<br />
was 3.1%. The organic growth of oil production in traditional production regions resulted from improvement and optimization<br />
of oil production methods. As a result, our average well debits increased from 10.70 tonnes a day in 2004 to<br />
11.07 tonnes a day in <strong>2005</strong>, or by 3.5%. In addition to traditional regions we continued exploration and development of<br />
new promising production regions. Oil production in new oil fields in the Nenetsky Autonomous District led to an increase<br />
of oil production in this region of 1.2 times compared to 2004. In the third quarter of 2004 we started commercial<br />
production at Kravtsovskoye (D-6), a Baltic offshore field. In <strong>2005</strong> we produced 562 thousand tonnes of crude oil from<br />
this field, and we expect that annual crude oil production will reach 700 thousand tonnes by 2007. The structural growth<br />
in international production volumes in <strong>2005</strong> was caused by consolidation of the Company's share in the Meleiha<br />
Hydrocarbon License Agreement as a result of an increase in our share of LUKAgip N.V. at the end of 2004, and by our<br />
acquisition of Nelson in October-December of <strong>2005</strong>.<br />
In addition to our production, we purchase crude oil in Russia and on international markets. In Russia we primarily purchase<br />
crude oil from associated producing companies and other producers, including vertically integrated companies that<br />
107
FINANCIAL ACCOUNTS<br />
lack refining capacity or are unable to export their crude oil. Then we may either refine or export purchased crude oil.<br />
Crude oil purchased on international markets is used mostly for marketing activities and, on certain occasions, supplying<br />
our overseas refineries.<br />
(thousand<br />
of barrels)<br />
<strong>2005</strong> 2004 2003<br />
(thousand<br />
of tonnes)<br />
(thousand<br />
of barrels)<br />
(thousand<br />
of tonnes)<br />
(thousand<br />
of barrels)<br />
(thousand<br />
of tonnes)<br />
Crude oil purchases in Russia 10,760 1,468 20,810 2,839 34,436 4,698<br />
Crude oil purchases<br />
internationally 69,122 9,430 64,695 8,826 59,278 8,087<br />
Total crude oil purchased 79,882 10,898 85,505 11,665 93,714 12,785<br />
The volume of crude oil purchased in Russia in <strong>2005</strong> was 1,371 thousand tonnes less than in 2004 as a result of decrease<br />
in purchases from third parties, however purchases from our associates increased by 587 thousand tonnes mostly as a<br />
result of transactions with OOO Geoilbent, a recently acquired associate. The volume of crude oil purchased internationally<br />
during <strong>2005</strong> increased by 604 thousand tonnes compared to 2004, because in <strong>2005</strong> we extended our marketing<br />
activity on international markets.<br />
Gas production<br />
In <strong>2005</strong> we produced 5,635 million cubic metres of commercial gas (including our share in equity associates), an increase<br />
of 14.4% compared to 2004. In April <strong>2005</strong> we started commercial production on the Nakhodkinskoe gas field and<br />
produced in this year 472 million cubic metres of natural gas. This is the first stage of development of the<br />
Bolshekhetskaya basin fields in the Yamalo-Nenetsky Autonomous District. The field's planned production capacity of<br />
10 billion cubic metres per year is expected to be achieved in 2007. Development of the Bolshekhetskaya basin fields is<br />
a core element of our gas business strategy.<br />
<strong>2005</strong><br />
Change<br />
from 2004<br />
2004<br />
Change<br />
from 2003<br />
2003<br />
Daily production of gas, including<br />
Company's share in associates<br />
(million cubic feet per day) 545 14.8% 475 30.5% 364<br />
Refining and marketing<br />
We operate four refineries located in European Russia and three refineries located overseas – in Bulgaria, Ukraine and<br />
Romania. Our Romanian refinery, Petrotel-LUKOIL S.A., was undergoing significant upgrades until October 2004. In<br />
October 2004, we put Petrotel-LUKOIL back into operation. In August <strong>2005</strong> we commenced a wide-scale upgrade of the<br />
Odessa refinery. The upgrade program is scheduled for three years.<br />
Production of refined products at our refineries in <strong>2005</strong> increased by 8.2% as compared to 2004. Russian refineries<br />
increased production by 5.5%. The overseas refineries increased production by 20.4% primarily due to recommencement<br />
of production by Petrotel-LUKOIL.<br />
In late 2004 we began changing refined products mix at our refineries in order to produce higher quality and more profitable<br />
products. In particular, in <strong>2005</strong> we produced 4,671 thousand tonnes of Euro 4 and Euro 5 diesel fuel at our Russian<br />
refineries (2004: 772 thousand tonnes).<br />
Along with own production of refined products we refine our crude oil at third parties' refineries. In Russia we processed 1,634<br />
thousand tonnes of crude oil during <strong>2005</strong> in order to supply our network in the Ural region. In order to supply our retail networks<br />
in Eastern Europe in <strong>2005</strong> we processed 1,213 thousand tonnes of crude oil at third parties' refineries in Belorussia and Serbia.<br />
In <strong>2005</strong> we continued to expand our marketing activities in Western Europe, South-East Asia, Northern and Central<br />
America. Our marketing activities mainly include wholesale and bunkering operations in Western Europe and South-East<br />
Asia as well as retail operations in the USA, Baltic states and some other regions. The total volume of refined products<br />
purchased from third parties for wholesale and to supply retail networks was 32,225 thousand tonnes or $15,021 million<br />
in <strong>2005</strong> (20,279 thousand tonnes or $6,843 million in 2004). The increase was a result of continuing development of the<br />
existing retail chains outside of Russia and structural changes in the retail networks we operate. In particular, in May 2004<br />
we acquired an additional retail network in the USA, and in March <strong>2005</strong> we acquired a retail network in Finland.<br />
108
In Russia we purchase refined products on occasion, primarily to manage supply chain bottlenecks.<br />
The following tables represent volumes of refined products produced and purchased.<br />
<strong>2005</strong> 2004 2003<br />
(thousand of tonnes)<br />
Refined products produced at the Group refineries in Russia 35,290 33,438 32,444<br />
Refined products produced at the Group refineries outside of Russia 8,892 7,387 6,789<br />
Total refined products produced at the Group refineries 44,182 40,825 39,233<br />
Refined products purchased in Russia 1,394 2,020 1,399<br />
ANALYSIS OF FINANCIAL CONDITION<br />
AND RESULTS OF OPERATIONS<br />
Refined products purchased internationally 32,238 20,507 14,396<br />
Total refined products purchased 33,632 22,527 15,795<br />
Export of crude oil and refined products from Russia<br />
We transport a significant portion of our crude oil through Transneft's trunk oil pipeline system. Access to the Transneft<br />
crude oil export pipeline network is allocated quarterly, based on recent volumes produced and delivered through the<br />
pipeline and proposed export destinations. There is a constraint on the ability of Russian companies to export their crude<br />
oil due to limited capacity of Russian transportation infrastructure on the most profitable export routes.<br />
In order to overcome such limits Transneft has extended the capacity of the Baltic Pipeline System. During <strong>2005</strong> it rose<br />
nearly to 60 million tonnes of crude oil per year. This allowed us to increase the volume of crude oil exported via the<br />
Primorsk terminal in <strong>2005</strong> up to 9,713 thousand tonnes, or 1,316 thousand tonnes more than in 2004.<br />
The crude oil transported by Transneft is the Urals blend – a mix of crude oils of various qualities, therefore Russian companies<br />
which produce crude oil of a higher quality can not obtain benefits from selling it using Transneft's pipeline.<br />
Additional access to international markets bypassing Transneft export routes can be obtained through rail transport, by<br />
tankers or by our own export infrastructure. Our export infrastructure includes the Vysotsk terminal in the Leningrad<br />
region, Varandey terminal in the Nenetsky Autonomous District and the Izhevskoye terminal in the Kaliningrad region.<br />
In <strong>2005</strong> the Company exported 8.5% of crude oil produced, or 7,288 thousand tonnes, by means other than Transneft<br />
(7,389 thousand tonnes in 2004), including 3,755 thousand tonnes through our own export infrastructure (2,319 thousand<br />
tonnes in 2004). In the third quarter of <strong>2005</strong> we ceased the export of crude oil through the Vysotsk terminal due to<br />
increased capacity of the Baltic Pipeline System. Currently we use the terminal to export refined products. In the future<br />
the terminal will be used to export both crude oil and refined products depending on market conditions.<br />
In <strong>2005</strong> we exported 774 thousand tonnes of crude oil to China (in 2004 we did not export crude oil to China).<br />
The volumes of crude oil exported from Russia by our subsidiaries are summarized as follows:<br />
<strong>2005</strong> 2004 2003<br />
(thousand<br />
of barrels)<br />
(thousand<br />
of tonnes)<br />
(thousand<br />
of barrels)<br />
(thousand<br />
of tonnes)<br />
(thousand<br />
of barrels)<br />
(thousand<br />
of tonnes)<br />
Export of crude oil using<br />
Transneft export routs 282,418 38,529 285,204 38,909 240,150 32,763<br />
Export of crude oil bypassing<br />
Transneft 53,421 7,288 54,161 7,389 39,342 5,367<br />
Total crude oil export 335,839 45,817 339,365 46,298 279,492 38,130<br />
In <strong>2005</strong> we exported 16.6 million tonnes of refined products, an increase of 17.7% compared to 2004.<br />
109
FINANCIAL ACCOUNTS<br />
YEAR ENDED DECEMBER 31, <strong>2005</strong> COMPARED TO THE YEAR ENDED DECEMBER 31, 2004<br />
Results of operations<br />
The table below details certain income and expense items from our consolidated statements of income for the periods<br />
indicated. All items are presented in millions of US dollars, except for earnings per share data and percentage of<br />
changes to 2004.<br />
<strong>2005</strong><br />
Change<br />
from 2004<br />
2004<br />
Revenues<br />
Sales (including excise and export tariffs) 55,774 64.8% 33,845<br />
Equity share in income of affiliates 441 107.0% 213<br />
Total revenues 56,215 65.1% 34,058<br />
Costs and other deductions<br />
Operating expenses (3,487) 21.1% (2,880)<br />
Cost of purchased crude oil, petroleum and chemical products (19,398) 91.6% (10,124)<br />
Transportation expenses (3,519) 26.4% (2,784)<br />
Selling, general and administrative expenses (2,578) 27.4% (2,024)<br />
Depreciation, depletion and amortization (1,315) 22.3% (1,075)<br />
Taxes other than income taxes (6,334) 80.7% (3,505)<br />
Excise and export tariffs (9,931) 89.2% (5,248)<br />
Exploration expenses (317) 85.4% (171)<br />
Gain (loss) on disposals and impairments of assets 52 - (213)<br />
Income from operating activities 9,388 55.6% 6,034<br />
Interest expense (275) (8.3)% (300)<br />
Interest and dividend income 96 (46.7)% 180<br />
Currency translation (loss) gain (134) – 135<br />
Other non-operating (expense) income (44) – 21<br />
Minority interest (121) 95.2% (62)<br />
Income before income taxes 8,910 48.3% 6,008<br />
Current income taxes (2,301) 42.6% (1,614)<br />
Deferred income taxes (166) 13.7% (146)<br />
Total income tax expense (2,467) 40.2% (1,760)<br />
Net income 6,443 51.7% 4,248<br />
Earnings per share of common stock (in US dollars):<br />
Basic 7.91 52.1% 5.20<br />
Diluted 7.79 51.9% 5.13<br />
The analysis of the main financial indicators of the financial statements is provided below.<br />
110
Sales revenues<br />
Sales breakdown<br />
<strong>2005</strong> 2004<br />
(millions of US dollars)<br />
Crude oil<br />
Export and sales on international markets other than CIS 15,589 28.0% 10,338 30.5%<br />
Export and sales to CIS 778 1.4% 602 1.8%<br />
Domestic sales 120 0.2% 181 0.5%<br />
16,487 29.6% 11,121 32.8%<br />
Refined products<br />
Export and sales on international markets<br />
Wholesale 22,923 41.1% 11,403 33.7%<br />
Retail 6,293 11.3% 3,914 11.6%<br />
Domestic sales<br />
Wholesale 4,753 8.5% 3,429 10.1%<br />
Retail 1,972 3.5% 1,236 3.7%<br />
35,941 64.4% 19,982 59.1%<br />
ANALYSIS OF FINANCIAL CONDITION<br />
AND RESULTS OF OPERATIONS<br />
Petrochemicals<br />
Export and sales on international markets 1,134 2.0% 1,021 3.0%<br />
Domestic sales 469 0.9% 332 1.0%<br />
1,603 2.9% 1,353 4.0%<br />
Other 1,743 3.1% 1,389 4.1%<br />
Total sales 55,774 100.0% 33,845 100.0%<br />
Sales volumes <strong>2005</strong> 2004<br />
Crude oil<br />
(thousands of barrels)<br />
Export and sales on international markets other than CIS 312,712 307,523<br />
Export and sales to CIS 23,852 29,877<br />
Domestic sales 4,926 11,999<br />
Crude oil<br />
(thousands of tonnes)<br />
Export and sales on international markets other than CIS 42,662 34.7% 41,954 38.6%<br />
Export and sales to CIS 3,254 2.6% 4,076 3.7%<br />
Domestic sales 672 0.5% 1,637 1.5%<br />
46,588 37.8% 47,667 43.8%<br />
Refined products<br />
(thousands of tonnes)<br />
Export and sales on international markets<br />
Wholesale 49,549 40.2% 35,946 33.1%<br />
Retail 7,117 5.8% 5,480 5.0%<br />
Domestic sales<br />
Wholesale 16,421 13.3% 16,981 15.6%<br />
Retail 3,549 2.9% 2,743 2.5%<br />
76,636 62.2% 61,150 56.2%<br />
Total sales volume of crude oil and refined products 123,224 100.0% 108,817 100.0%<br />
111
FINANCIAL ACCOUNTS<br />
<strong>2005</strong> 2004<br />
Realized average sales prices<br />
($/barrel) ($/tonne) ($/barrel) ($/tonne)<br />
Average realized price international<br />
Oil (excluding CIS) 49.85 365.41 33.62 246.42<br />
Oil (CIS) 32.63 239.20 20.13 147.57<br />
Refined products<br />
Wholesale 462.61 317.24<br />
Retail 884.30 714.19<br />
Average realized price within Russia<br />
Oil 24.44 179.15 15.09 110.58<br />
Refined products<br />
Wholesale 289.41 201.94<br />
Retail. 555.80 450.64<br />
During <strong>2005</strong> our revenues increased by $21,929 million, or 64.8%, compared to 2004.<br />
The total volume of crude oil and refined products sold amounted to 123.2 million tonnes, which is 13.2% more than in<br />
2004. Our revenues from crude oil sales increased by $5,366 million, or 48.3%. Our sales of refined products increased<br />
by $15,959 million, or 79.9%.<br />
Sales of crude oil and refined products on the international markets, including the CIS, accounted for 83.3% of total sales<br />
volume in <strong>2005</strong> compared to 80.4% in 2004.<br />
112
The increase in sales was principally due to the following:<br />
favorable price conditions (see "Change in the price of crude oil and refined products" on page 103)<br />
increase in total volume of crude oil production (see "Crude oil production" on page 107)<br />
increase in marketing activities (see page 108)<br />
increase in crude oil refining<br />
Sales of crude oil<br />
During <strong>2005</strong> the Company decreased its sales of crude oil on the domestic market compared to 2004 by 965 thousand<br />
tonnes, or 58.9%, due to increased volume of refining in Russia.<br />
In order to obtain benefits from increased refined products prices in Russia and on international markets and due to a<br />
higher level of export tariff on crude oil compared to export tariffs on refined products we slightly decreased the volume<br />
of crude oil exported from Russia by 481 thousand tonnes, or 1.0%, compared to 2004.<br />
ANALYSIS OF FINANCIAL CONDITION<br />
AND RESULTS OF OPERATIONS<br />
Sales of refined products<br />
Sales of refined products made up 64.4% of our total revenues (62.2% in terms of volumes sold) compared to 59.1%<br />
(56.2% – in terms of volumes) in 2004. The portion of our domestic refined product sales in <strong>2005</strong> was 16.2% of the total<br />
tonnes sold (2004: 18.1%), but represented 12.0% of our total revenues (2004: 13.8%). The decrease of this portion is<br />
accounted for by more extensive expansion of marketing activities outside of Russia.<br />
The average realized wholesale price on refined products outside of Russia increased by $145.37 per tonne, or 45.8%,<br />
compared to 2004. Volumes of refined products sold outside of Russia increased by 13,603 thousand tonnes, or 37.8%<br />
(see also "Refining and marketing" on page 108). As a result, our revenue from wholesale of refined products outside of<br />
Russia increased by $11,520 million, or 101.0%.<br />
In <strong>2005</strong> retail sales of refined products outside of Russia increased by 1,637 thousand tonnes, or by 29.9%, compared<br />
to 2004. The increase was a result of continuing development of the existing retail chains outside of Russia and structural<br />
changes in the retail networks we operate. In particular, in May 2004 we acquired an additional retail network in the<br />
USA, and in March <strong>2005</strong> we acquired a retail network in Finland. Average retail prices increased up to $884.30 per tonne,<br />
or by 23.8%. As a result, our revenue from retail sales increased by $2,379 million, or 60.8%. In <strong>2005</strong> revenue from retail<br />
sales was 21.5% (in 2004 – 25.6%) of total refined products sales outside of Russia. Our international retail sales include<br />
supplies of refined products to third parties' retail networks within the bounds of long-term contracts with pricing similar<br />
to retail pricing.<br />
Wholesale of refined products within Russia in <strong>2005</strong> slightly decreased compared to 2004 because of growth in retail<br />
sales and export of refined products from Russia. The average domestic realized price on refined products increased by<br />
$87.47 per tonne, or 43.3%. As a result, our revenue from wholesale of refined products on the domestic market<br />
increased by $1,324 million, or 38.6%.<br />
Retail sales within Russia in <strong>2005</strong> increased by 806 thousand tonnes, or 29.4%, compared to 2004. Average retail prices<br />
increased up to $555.80 per tonne, or by 23.3%. As a result, our revenue from retail sales increased by $736 million, or<br />
59.5%. Revenue from retail sales was 29.3% of total refined products sales in Russia in <strong>2005</strong> (in 2004 – 26.5%).<br />
Sales of petrochemical products<br />
Revenue from sales of petrochemical products increased by $250 million, or 18.5%, during <strong>2005</strong>. This was mainly due<br />
to an increase in average realized prices.<br />
Sales of other products<br />
Other sales include revenues from sales of gas, gas refined products and other services provided and goods not related<br />
to our primary activities (such as electricity, heat, etc.) sold by our production and marketing companies. Other sales<br />
increased by $354 million, or 25.5%, as a result of sales of other products produced by the Company, primarily gas and<br />
gas refined products, and increased activity in providing other services to third parties.<br />
Equity share in income of affiliates<br />
Our share in the income of affiliates in <strong>2005</strong> increased by $229 million, or 107.5%, compared to 2004 due to a general<br />
increase in profitability of our crude oil production affiliates in particular due to an increase in the net income of<br />
ZAO Turgai-Petroleum. ZAO Turgai-Petroleum, our 50% interest affiliate company, is a partner in the Turgai-Petroleum<br />
joint venture developing the Kumkol oil field in Kazakhstan. The Group's share in the net income of ZAO Turgai-Petroleum<br />
in <strong>2005</strong> was $198 million, which represents an increase of $153 million as compared to the previous year.<br />
113
FINANCIAL ACCOUNTS<br />
Operating expenses<br />
Operating expenses include the following types of costs:<br />
<strong>2005</strong> 2004<br />
(millions of US dollars)<br />
Crude oil extraction expenses 1,740 1,556<br />
Refining expenses 644 532<br />
Petrochemical expenses 214 207<br />
Other operating expenses 889 585<br />
Total operating expenses 3,487 2,880<br />
Cost of purchased crude oil, petroleum and chemical products 19,398 10,124<br />
Compared to 2004, operating expenses increased by $607 million, or 21.1%. Real appreciation of the ruble against the<br />
US dollar is still a significant factor affecting our operating expenses in Russia. In <strong>2005</strong> the real ruble appreciation was<br />
6.9%.<br />
Crude oil extraction expenses. Our extraction expenses include expenditures related to repairs of extraction equipment,<br />
labor costs, expenses of artificial stimulation of reservoirs, fuel and electricity costs, property insurance of extraction<br />
equipment and other similar costs.<br />
Expenses of the Company's oil production enterprises related to the sale of services and goods (such as electricity, heat,<br />
etc.) that do not relate to core activities have been excluded from extraction expenses and are included in other operating<br />
costs.<br />
In <strong>2005</strong> our extraction expenses rose by $184 million, or 11.8%, compared to 2004. The increase resulted from growth<br />
of crude oil produced by our subsidiaries up to 86.2 million tonnes, or by 4.6%, compared to 2004, and increased expenses<br />
on repairs, overhaul and artificial stimulation of reservoirs in our production subsidiaries. Moreover, extraction costs<br />
were affected by the real ruble appreciation. However, the impact of these factors was partly mitigated by an increase<br />
of average well debits from 10.70 tonnes a day in 2004 to 11.07 tonnes a day in <strong>2005</strong>. As a result our average extraction<br />
cost per barrel increased from $2.58 to $2.75 per barrel, or by 6.6% (average extraction cost calculated using an average<br />
tonnes to barrels conversion rate of 7.33).<br />
Refining expenses at our refineries increased by $112 million, or 21.1%, in <strong>2005</strong> compared to 2004.<br />
Refining expenses of our domestic refineries increased by 13.8%, or $55 million as a result of increased production<br />
volume and due to effect of the real ruble appreciation. Moreover, in late 2004 we began changing product mix in order<br />
to produce higher quality and more profitable products (in particular, Euro 4 quality standard diesel fuel), which led to an<br />
increase of our refinery expenses.<br />
Refining expenses of our international refineries increased by 43.2%, or $57 million, as a result of the recommencement<br />
of operations of our Romanian refinery Petrotel-LUKOIL after modernization, and due to growth in heating and power cost<br />
at our Bulgarian refinery.<br />
Operating expenses of petrochemical companies increased by $7 million, or 3.4%, compared to 2004.<br />
Other operating expenses include natural gas extraction expenses, operating expenses of our gas processing plants,<br />
and the costs of other services provided and goods not related to primary activities (such as electricity, heat, etc.) sold<br />
by our production and marketing companies, and operating expenses of other non-core businesses of the Group.<br />
Other operating expenses also include transportation costs associated with the delivery of crude oil from the Group's<br />
exploration and production entities to the Group's refineries, processing fees paid to third parties' refineries, and the<br />
amount of the change in crude oil and refined products inventory originated within the Group. Other operating expenses<br />
increased by $304 million compared to 2004. The increase was explained by increased volumes of our crude oil<br />
refined on the third parties' refineries, growth of volume of the other products sales (primarily gas and gas refined<br />
products), and as a result of change in crude oil and refined product inventory originated within the Group in the fourth<br />
quarter of <strong>2005</strong>.<br />
Cost of purchased crude oil, petroleum and chemical products increased by $9,274 million in <strong>2005</strong>, or 91.6%, compared<br />
to the previous year due to a significant increase in volumes of sales of purchased crude oil and refined products<br />
in <strong>2005</strong> by 10,094 thousand tonnes, or about 29.5%, compared to 2004 and growth of market prices on crude oil and<br />
petroleum products.<br />
114
Transportation expenses<br />
The increase in the total volume of sales together with the increase in transportation tariffs led to growth of our transportation<br />
expenses in <strong>2005</strong> by $735 million, or 26.4%, compared to 2004.<br />
According to the Federal Statistics Service of the Russian Federation, in <strong>2005</strong> transportation tariffs increased as follows:<br />
transportation of oil by pipeline transport – 33.3% (including certain specific tariffs established for individual parts of the<br />
Transneft pipeline which did not have a material impact on transportation expenses of the Group), transportation of<br />
refined products by pipeline transport – 24.8%, railway transport – 13.3%.<br />
Sea shipping tariffs decreased in <strong>2005</strong> by 14.9%, compared to 2004 (calculated as weighted average by volumes transported<br />
to different locations). At the same time, a significant increase of tariffs and demurrage cost in the fourth<br />
quarter of <strong>2005</strong> led to an increase of transportation expenses by approximately $70 million.<br />
Selling, general and administrative expenses<br />
Our selling, general and administrative expenses increased by $554 million, or 27.4%, compared to 2004. The abovementioned<br />
expenses include general business expenses, payroll costs (excluding extraction entities' and refineries'<br />
production staff costs), insurance costs (except for property insurance related to oil and gas, and refinery equipment),<br />
costs of maintenance of social infrastructure, movement in bad debt provision and other expenses.<br />
The increase in selling, general and administrative expenses was a result of general expansion of our operations primarily<br />
outside of Russia. Also, the expenses were affected by an increase in expenses related to a share-based compensation<br />
program for management in <strong>2005</strong>, which was $263 million compared to $65 million in 2004. At the same time we<br />
partially mitigated an effect of the real ruble appreciation.<br />
Selling, general and administrative expenses for <strong>2005</strong> also included $66 million of expenses related to our Finnish subsidiaries<br />
acquired in March <strong>2005</strong> and $20 million of expenses related to Nelson, which we acquired in October-<br />
December of <strong>2005</strong>.<br />
ANALYSIS OF FINANCIAL CONDITION<br />
AND RESULTS OF OPERATIONS<br />
Depreciation, depletion and amortization<br />
Depreciation, depletion and amortization expenses include depletion of assets fundamental to production, depreciation of<br />
other productive and non-productive assets and certain intangible assets. Our depreciation, depletion and amortization<br />
expenses increased by $240 million, or 22.3%, compared to 2004. The increase was a result of the Company's capital<br />
expenditures and corresponding growth of depreciable assets, also the increase included $41 million of depreciation,<br />
depletion and amortization expenses related to Nelson acquired in <strong>2005</strong>.<br />
Taxes other than income taxes<br />
Taxes other than income taxes include mineral extraction tax, property tax and social taxes.<br />
<strong>2005</strong> 2004<br />
In Russia International In Russia International<br />
(millions of US dollars)<br />
Mineral extraction tax 5,590 - 2,971 -<br />
Social security taxes and contributions 284 40 302 28<br />
Property tax 210 23 91 20<br />
Other taxes 162 25 60 33<br />
6,246 88 3,424 81<br />
Total 6,334 3,505<br />
The increase in taxes other than income taxes resulted primarily from a $2,619 million increase in mineral extraction tax,<br />
which is linked to international crude oil prices (see "Tax burden" on page 104). Property tax in Russia increased in <strong>2005</strong><br />
primarily due to recalculation of domestic property tax related to 2002 and 2003. In <strong>2005</strong> the Group recognized an<br />
expense of $163 million in relation to the results of tax audits of the Group companies for periods prior to the 2004 financial<br />
year. The amount of such additional taxes recognized as other taxes was approximately $150 million.<br />
115
FINANCIAL ACCOUNTS<br />
Excise and export tariffs<br />
Our excise and export tariffs include taxes on sales of refined products and export tariffs on export of crude oil and refined<br />
products. Excise and export tariffs increased by $4,683 million, or 89.2%, compared to 2004. The increase in export<br />
tariff expenses resulted from an increase in export tariff rates (see "Tax burden" on page 106). The increase in international<br />
excise taxes on refined products resulted from an increase in volumes of products sold across our international<br />
group, primarily in the USA, and due to commencement of our operations in Finland.<br />
<strong>2005</strong> 2004<br />
In Russia International In Russia International<br />
(millions of US dollars)<br />
Excise tax and sales taxes on refined products 654 2,679 547 1,774<br />
Export tariffs 6,590 8 2,913 14<br />
7,244 2,687 3,460 1,788<br />
Total 9,931 5,248<br />
Exploration expenses<br />
During <strong>2005</strong> the amount charged to exploration expense increased in comparison with the previous year by $146 million,<br />
or by 85.4%. This is attributable to the fact that during <strong>2005</strong> the Group completed drilling the first two exploratory wells<br />
of the Yalama (D-222) and Tyub-Karagan exploration projects. Both exploratory wells were dry and their costs in the<br />
amount of $105 million were charged to expense. Notwithstanding the fact that the initial exploratory wells were not<br />
successful, the Group continues to perform further geological studies and is using the results of the first exploratory<br />
drilling in its analysis to assess potential placement of hydrocarbon deposits and to determine drilling programs for the<br />
second exploratory wells in both fields.<br />
Gain (loss) on disposals and impairments of assets<br />
Gain on disposals of assets in <strong>2005</strong> amounted to $52 million compared to $213 million loss in 2004.<br />
In <strong>2005</strong> we recognized an $152 million gain on the sale our 30% interest in OOO Narianmarneftegaz to ConocoPhillips,<br />
a gain of $4 million on the sale of our 38% interest in ZAO Globalstroy-Engineering and a gain of $25 million on the sale<br />
of the entire interest in ZAO Arktikneft. Also in <strong>2005</strong> the Group recognized an additional impairment loss of $12 million<br />
related to sale of our ownership interests in OAO Bank Petrocommerce.<br />
In 2004 we recognized an impairment loss in relation to our decision to sell our ownership interests in OAO Bank<br />
Petrocommerce in the amount of $35 million and an impairment loss of $70 million in relation to our decision to sell our<br />
ownership interest in OOO LUKOIL-Burenie.<br />
Other losses relate to disposals of a number of non-core assets and individually insignificant impairments on nonperforming<br />
business units.<br />
Interest expense<br />
Interest expense in <strong>2005</strong> decreased by $25 million compared to 2004 primarily due to the sale of our ownership interest<br />
in OAO Bank Petrocommerce in the third quarter of 2004. However the decrease was compensated in the fourth<br />
quarter of <strong>2005</strong> by accrued interest expense related to the loan of $1,934 million, which the Group obtained to finance<br />
the acquisition of Nelson.<br />
Income taxes<br />
Our total income tax expense increased by $707 million, or 40.2%, compared to 2004, due to an increase of income<br />
before income tax by $2,902 million, or 48.3%.<br />
Our effective income tax rate in <strong>2005</strong> was 27.7% (in 2004 it was 29.3%), which is higher than the maximum statutory<br />
rate for the Russian Federation (24%). This is attributable to the fact that some costs incurred during the period are not<br />
tax deductible or only deductible to a certain limit.<br />
116
Reconciliation of income before income tax to EBITDA<br />
(earnings before interest, income taxes, depreciation and amortization)<br />
<strong>2005</strong> 2004<br />
(millions of US dollars)<br />
Income before income taxes 8,910 6,008<br />
Add back:<br />
Depreciation and amortization 1,315 1,075<br />
Interest expense 275 300<br />
Interest and dividend income (96) (180)<br />
ANALYSIS OF FINANCIAL CONDITION<br />
AND RESULTS OF OPERATIONS<br />
EBITDA 10,404 7,203<br />
117
FINANCIAL ACCOUNTS<br />
YEAR ENDED DECEMBER 31, 2004 COMPARED TO THE YEAR ENDED DECEMBER 31, 2003<br />
Results of operations<br />
The table below details certain income and expense items from our consolidated statements of income for the periods<br />
indicated. All items are presented in millions of US dollars, except for earnings per share data and percentage of changes<br />
to 2003.<br />
2004<br />
Change<br />
from 2003<br />
2003<br />
Revenues<br />
Sales (including excise and export tariffs) 33,845 53.0% 22,118<br />
Equity share in income of affiliates 213 17.7% 181<br />
Total revenues 34,058 52.7% 22,299<br />
Costs and other deductions<br />
Operating expenses (2,880) 13.1% (2,546)<br />
Cost of purchased crude oil, petroleum and chemical products (10,124) 71.3% (5,909)<br />
Transportation expenses (2,784) 35.7% (2,052)<br />
Selling, general and administrative expenses (2,024) 12.4% (1,800)<br />
Depreciation, depletion and amortization (1,075) 16.8% (920)<br />
Taxes other than income taxes (3,505) 42.7% (2,456)<br />
Excise and export tariffs (5,248) 77.7% (2,954)<br />
Exploration expenses (171) 25.7% (136)<br />
Gain from sale of interest in the Azeri, Chirag, Guneshli project - - 1,130<br />
Loss on disposals and impairments of assets (213) 208.7% (69)<br />
Income from operating activities 6,034 31.5% 4,587<br />
Interest expense (300) 9.9% (273)<br />
Interest and dividend income 180 29.5% 139<br />
Currency translation gain 135 (8.8)% 148<br />
Other non-operating income 21 90.9% 11<br />
Minority interest (62) 72.2% (36)<br />
Income before income taxes 6,008 31.3% 4,576<br />
Current income taxes (1,614) 71.9% (939)<br />
Deferred income taxes (146) 114.7% (68)<br />
Total income tax expense (1,760) 74.8% (1,007)<br />
Net income 4,248 19.0% 3,569<br />
Cumulative effect of change in accounting principle, net of tax - - 132<br />
Net income 4,248 14.8% 3,701<br />
118
Earnings per share of common stock (in US dollars):<br />
2004<br />
Change<br />
from 2003<br />
Basic 5.20 15.0% 4.52<br />
Diluted 5.13 15.3% 4.45<br />
Exclusion of special items:<br />
Cumulative effect of change in accounting principle, net of tax - - (132)<br />
Gain from sale of interest in the Azeri, Chirag, Guneshli project - - (1,130)<br />
Pension curtailment - - (53)<br />
2003<br />
ANALYSIS OF FINANCIAL CONDITION<br />
AND RESULTS OF OPERATIONS<br />
Net income excluding special items 4,248 78.0% 2,386<br />
The analysis of the main financial indicators of the financial statements is provided below.<br />
Special items<br />
In December 2003 we took the decision to replace the Group's existing defined benefit pension plan with a new plan. The<br />
new plan is principally a defined contribution plan. This resulted in the recognition of a curtailment gain of $53 million.<br />
Net income for 2003 includes a non-taxable gain from the sale of our interest in the Azeri, Chirag, Guneshli project of<br />
$1,130 million.<br />
119
FINANCIAL ACCOUNTS<br />
Sales revenue<br />
Sales breakdown<br />
2004 2003<br />
(millions of US dollars)<br />
Crude oil<br />
Export and sales on international markets other than CIS 10,338 30.5% 6,411 29.0%<br />
Export and sales to CIS 602 1.8% 433 2.0%<br />
Domestic sales 181 0.5% 374 1.7%<br />
11,121 32.8% 7,218 32.7%<br />
Refined products<br />
Export and sales on international markets<br />
Wholesale 11,403 33.7% 7,214 32.6%<br />
Retail 3,914 11.6% 2,266 10.3%<br />
Domestic sales<br />
Wholesale 3,429 10.1% 2,608 11.8%<br />
Retail 1,236 3.7% 842 3.8%<br />
19,982 59.1% 12,930 58.5%<br />
Petrochemicals<br />
Export and sales on international markets 1,021 3.0% 671 3.0%<br />
Domestic sales 332 1.0% 251 1.1%<br />
1,353 4.0% 922 4.1%<br />
Other 1,389 4.1% 1,048 4.7%<br />
Total sales 33,845 100.0% 22,118 100.0%<br />
Sales volumes 2004 2003<br />
Crude oil<br />
(thousands of barrels)<br />
Export and sales on international markets other than CIS 307,523 246,889<br />
Export and sales to CIS 29,877 29,826<br />
Domestic sales 11,999 43,826<br />
Crude oil<br />
(thousands of tonnes)<br />
Export and sales on international markets other than CIS 41,954 38.6% 33,682 34.3%<br />
Export and sales to CIS 4,076 3.7% 4,069 4.1%<br />
Domestic sales 1,637 1.5% 5,979 6.1%<br />
47,667 43.8% 43,730 44.5%<br />
Refined products<br />
(thousands of tonnes)<br />
Export and sales on international markets<br />
Wholesale 35,946 33.1% 30,193 30.8%<br />
Retail 5,480 5.0% 3,802 3.9%<br />
Domestic sales<br />
Wholesale 16,981 15.6% 17,967 18.3%<br />
Retail 2,743 2.5% 2,506 2.5%<br />
61,150 56.2% 54,468 55.5%<br />
Total sales volume of crude oil and refined products 108,817 100.0% 98,198 100.0%<br />
120
Realized average sales prices<br />
2004 2003<br />
($/barrel) ($/tonne) ($/barrel) ($/tonne)<br />
Average realized price international<br />
Oil (excluding CIS) 33.62 246.42 25.97 190.35<br />
Oil (CIS) 20.13 147.57 14.50 106.25<br />
Refined products<br />
Wholesale 317.24 238.94<br />
Retail 714.19 596.02<br />
Average realized price within Russia<br />
Oil 15.09 110.58 8.53 62.54<br />
Refined products<br />
Wholesale 201.94 145.15<br />
Retail 450.64 335.90<br />
ANALYSIS OF FINANCIAL CONDITION<br />
AND RESULTS OF OPERATIONS<br />
During 2004 sales revenues increased by $11,727 million, or 53.0%, compared to 2003.<br />
The total volume of crude oil and refined products sold amounted 108.8 million tonnes, which is 10.8% more than that<br />
sold in 2003. Our revenues from crude oil sales increased by $3,903 million, or 54.1%. Our sales of refined products<br />
increased by $7,052 million, or 54.5%.<br />
Sales of crude oil and refined products on the international market, including the CIS, accounted for 80.4% of total sales<br />
volume in 2004 compared to 73.1% in 2003.<br />
The increase in sales was principally due to the following:<br />
favorable price conditions: international crude oil market prices were at a ten-year high<br />
increase in total volume of crude oil production<br />
increase in marketing activities<br />
decrease of crude oil sales in Russia and increase in volumes exported on international markets<br />
Sales of crude oil<br />
During 2004 the Company decreased its sales of crude oil on the domestic market compared to the previous year by<br />
4,342 thousand tonnes, or 72.6%. This change was caused by an increase in volumes exported by the Company's<br />
domestic producers and an increase in the Group's refineries throughput.<br />
During 2004 we increased exports of crude oil on international markets by the Company's domestic producers by<br />
8,168 thousand tonnes. The increase in export sales, along with an increase in the average realized export price of crude<br />
oil on international markets (other than CIS) from $25.97 to $33.62 per barrel, allowed us to obtain an additional<br />
$2,012 million in revenues.<br />
Sales of refined products<br />
Sales of refined products made up 59.1% of our total sales revenues (56.2% in terms of volumes sold) compared to<br />
58.5% (55.5% – in terms of volumes) in 2003.<br />
The average realized wholesale price on refined products outside of Russia increased by $78.30 per tonne, or 32.8%.<br />
Volumes of refined products sold outside of Russia increased by 5,753 thousand tonnes, or 19.1%. As a result, our<br />
revenues from wholesale of refined products outside of Russia increased by $4,189 million, or 58.1%.<br />
In 2004 we increased retail sales of refined products outside of Russia by 1,678 thousand tonnes, or by 44.1% as<br />
compared to 2003. The increase was a result of continuing development of the existing retail chains in other regions and<br />
structural changes in the retail network we operate. In particular, we acquired Beopetrol in Serbia in 2003 and the additional<br />
retail network in the USA in May 2004. Retail sales primarily include sales of gasoline, diesel oil and other refined<br />
products (heating oil, lubricants, etc.). Average retail prices increased up to $714.19 per tonne, or by 19.8%. As a result,<br />
our revenues from retail sales increased by $1,648 million, or 72.7%. Revenue from retail sales was 25.6% of total sales<br />
of refined products outside of Russia in 2004.<br />
121
FINANCIAL ACCOUNTS<br />
Wholesale of refined products within Russia in 2004 decreased by 986 thousand tonnes, or 5.5%, as compared to the same<br />
period in 2003. The decrease was caused by an increase in retail sales and increase in export of refined products. It was<br />
compensated by an increase of the average domestic realized price on refined products of $56.79 per tonne, or 39.1%. As<br />
a result, our revenues from wholesale of refined products on the domestic market increased by $821 million, or 31.5%.<br />
Retail sales within Russia in 2004 increased by 237 thousand tonnes, or 9.5%, as compared to 2003. Average retail prices<br />
increased up to $450.64 per tonne, or by 34.2%. As a result, our revenues from retail sales increased by $394 million, or<br />
46.8%. Revenue from retail sales was 26.5% of total sales of refined products in Russia in 2004.<br />
Sales of petrochemical products<br />
Revenues from sales of petrochemical products increased by $431 million, or 46.7%, during 2004. This was mainly due<br />
to an increase of production volume up to 2,240 thousand tonnes, or by 7.8%, compared to 2003, and an increase in<br />
average realized prices.<br />
Sales of other products<br />
Other sales increased by $341 million, or 32.5%, as a result of sales of other products produced by the Company, and<br />
also increased activity in providing other services to third parties.<br />
Equity share in income of affiliates<br />
Our share in the income of affiliates in 2004 increased by $32 million, or 17.7%, compared to 2003, primarily due to an<br />
increase in the net income of ZAO Turgay-Petroleum. ZAO Turgay-Petroleum, our 50% interest affiliate company, is a<br />
partner in the Turgay Petroleum joint venture developing the Kumkol field in Kazakhstan. The Group's share in the net<br />
income of ZAO Turgay-Petroleum in 2004 amounted $45 million that represents an increase of $17 million as compared<br />
to 2003.<br />
Operating expenses<br />
Operating expenses include the following types of costs:<br />
2004 2003<br />
(millions of US dollars)<br />
Crude oil extraction expenses 1,556 1,458<br />
Refining expenses 532 454<br />
Petrochemical expenses 207 174<br />
Other operating expenses 585 460<br />
Total operating expenses 2,880 2,546<br />
Cost of purchased crude oil, petroleum and chemical products 10,124 5,909<br />
Compared to 2003, operating expenses increased by $334 million, or 13.1%.<br />
Crude oil extraction expenses. Our extraction expenses include expenditures related to repairs of extraction equipment,<br />
labor costs, expenses of artificial stimulation of reservoirs, fuel and electricity costs and other similar costs.<br />
Expenses of the Company's production enterprises related to the sale of services and goods (such as electricity, heat,<br />
etc.) that do not relate to core activities have been excluded from extraction expenses and are included in other operating<br />
costs.<br />
Crude oil extraction expenses rose by $98 million, or 6.7%, compared to the respective period of 2003. The increase in<br />
total extraction expenses resulted from an increase in volumes of oil produced by our subsidiaries from 76.1 million<br />
tonnes in 2003 to 82.4 million tonnes in 2004 as well as an 18.5% real ruble appreciation during the 2004. Despite these<br />
facts our average extraction cost per barrel slightly decreased from $2.61 to $2.58 per barrel, or 1.1% (average extraction<br />
cost calculated using an average tonnes to barrels conversion rate of 7.33). The decrease was caused by an increase<br />
in an average daily oil flow per well from 9.7 tonnes a day in the 2003 to 10.7 tonnes a day in the 2004, or 10.3%, and<br />
restructuring of our oil producing assets in the Perm region.<br />
122
Refining expenses at our refineries increased by $78 million, or 17.2%, in 2004 compared to 2003.<br />
Refining expenses of our domestic refineries increased by 18.7%, or $63 million. This was primarily caused by an appreciation<br />
in the exchange rate of the ruble to the US dollar and an increase in volumes produced.<br />
Refining expenses of our international refineries increased by 12.8%, or $15 million due to the recommencement of<br />
operations of our Romanian refinery Petrotel-LUKOIL after modernization and an increase in volumes produced.<br />
Operating expenses of petrochemical companies increased by $33 million, or 19.0%, compared to 2003, as result of<br />
an appreciation in the exchange rate of the ruble to the US dollar and an increase in volumes produced.<br />
Other operating expenses include the costs of other services provided and goods not related to primary activities (such<br />
as electricity, heat, etc.) sold by our production companies, and operating expenses of other non-core businesses of the<br />
Group. Other operating expenses also include costs associated with the delivery of crude oil from the Group's exploration<br />
and production entities to the Group's refineries, as well as the amount of the change in crude oil and refined products<br />
inventory at the Group's marketing entities. Other operating expenses increased by $125 million, or 27.3%, as compared<br />
to 2003 primarily as a result of change in crude oil and refined products inventory in 2004.<br />
Cost of purchased crude oil, petroleum and chemical products increased by $4,215 million in 2004, or 71.3%, compared<br />
to the prior period due to a significant increase in volumes of refined products purchased for resale in 2004 by<br />
6,394 thousand tonnes and growth of market prices on crude oil and petroleum products.<br />
ANALYSIS OF FINANCIAL CONDITION<br />
AND RESULTS OF OPERATIONS<br />
Transportation expenses<br />
The increase in the total volume of sales led to an increase in transportation expenses. However, the main factor in the<br />
increase of $732 million, or 35.7%, in these expenses compared to 2003 was the increase in the transportation tariffs.<br />
During 2004, transportation tariffs increased as follows: pipeline transport – 10.9%, including increase of Transneft's tariff –<br />
13.3%, sea shipping – 46.7% (weighted average by volumes transported to different locations), railway transport – 21.6%.<br />
Selling, general and administrative expenses<br />
Our selling, general and administrative expenses increased by $224 million, or 12.4%, compared to 2003. The above-mentioned<br />
expenses include general business expenses, payroll costs (excluding extraction entities' and refineries' production staff cost),<br />
insurance costs, costs of maintenance of social infrastructure, movement in bad debt provision and other expenses.<br />
The increase in selling, general and administrative expenses was primarily caused by 18.5% real appreciation of the ruble<br />
during 2004. It was partly compensated by movements in the bad debt provision. During 2004 the bad debt provision<br />
increased by $48 million, thus increasing general expenses, while for 2003 the bad debt provision increased by $79 million.<br />
Also, in 2004 the Company accrued $65 million of compensation to management in relation to the share-based<br />
compensation program, compared to $26 million in 2003.<br />
Depreciation, depletion and amortization<br />
Depreciation, depletion and amortization expenses include depletion of assets fundamental to production, depreciation of<br />
other productive and non-productive assets and certain intangible assets. Our depreciation, depletion and amortization expenses<br />
increased by $155 million, or 16.8%, in comparison to 2003. The increase was a result of the Company's capital expenditure<br />
program and corresponding growth of depreciable assets. This increase was partly compensated by upward revisions of<br />
the Company's proved reserves and, consequently, an increase in estimated useful economic life of fixed assets.<br />
Taxes other than income taxes<br />
Taxes other than income taxes include mineral extraction tax, property tax and social taxes.<br />
2004 2003<br />
in Russia International in Russia International<br />
(millions of US dollars)<br />
Mineral extraction tax 2,971 - 1,966 -<br />
Social security taxes and contributions 302 28 235 21<br />
Property tax 91 20 123 16<br />
Other taxes 60 33 59 36<br />
3,424 81 2,383 73<br />
Total 3,505 2,456<br />
123
FINANCIAL ACCOUNTS<br />
The increase in taxes other than income taxes resulted primarily from a $1,005 million increase in mineral extraction tax,<br />
which is linked to international crude oil prices. Social taxes and contributions in Russia increased by $67 million, or<br />
28.5%, as compared to 2003. As allowed by the current legislation we recalculated domestic property tax for 2002 and<br />
2003 that resulted in $36 million decrease in property tax charge for 2004.<br />
Excise and export tariffs<br />
Our excise and export tariffs include taxes on sales of refined products and export tariffs on export of crude oil and refined<br />
products. Excise and export tariffs increased by $2,294 million, or 77.7%, compared to 2003. The increase in export<br />
tariff expenses resulted from an increase in export tariff rates and also an increase in volumes exported. The increase in<br />
international excise taxes on refined products resulted from an increase in excise taxes and fuel sales taxes and from an<br />
increase in volumes of products sold across our international group, primarily in the USA.<br />
2004 2003<br />
in Russia International in Russia International<br />
(millions of US dollars)<br />
Excise tax and sales taxes on refined products 547 1,774 449 1,106<br />
Export tariffs 2,913 14 1,392 7<br />
3,460 1,788 1,841 1,113<br />
Total 5,248 2,954<br />
Exploration expenses<br />
During 2004 the amount charged to exploration expense increased in comparison with 2003 by $35 million, or by 25.7%.<br />
Loss on disposal and impairment of assets<br />
Loss on disposal and impairment of assets in 2004 was $213 million compared to $69 million in 2003. In the second quarter<br />
of 2004 we recognized an impairment loss of $35 million in relation to our decision to sell our ownership interest in<br />
OAO Bank Petrocommerce. In the third quarter of 2004 we recognized an impairment loss of $70 million in relation to<br />
our decision to sell our ownership interest in OOO LUKOIL-Burenie.<br />
Interest expense<br />
Interest expense in 2004 increased by $27 million compared to 2003 primarily due to an increase of LIBOR rates in 2004.<br />
Income taxes<br />
Our total income tax expense increased by $753 million, or 74.8%, compared to 2003 while our income before income<br />
tax increased by $1,432 million, or 31.3% (excluding gain on sale of interest in Azeri, Chirag, Guneshli, our income before<br />
income tax increased by $2,562 million, or 74.3%).<br />
Our effective tax rate in 2004 was 29.3% (in 2003 it was 29.2%, excluding the effect of gain on sale of interest in Azeri,<br />
Chirag, Guneshli), which is higher than the maximum statutory rate for the Russian Federation (24%). This is attributable<br />
to the fact that some costs incurred during the period are not tax deductible or only deductible to a certain<br />
limit. Moreover, despite the impairment losses recorded in the consolidated financial statements, the disposals of<br />
OAO Bank Petrocommerce and OOO LUKOIL-Burenie resulted in a taxable gain under Russian tax legislation. In 2004<br />
income tax expense included $28 million related to these disposals, thus increasing our effective tax rate.<br />
Reconciliation of income before income tax to EBITDA<br />
(earnings before interest, income taxes, depreciation and amortization)<br />
2004 2003<br />
(millions of US dollars)<br />
Income before income taxes 6,008 4,576<br />
Add back:<br />
Depreciation and amortization 1,075 920<br />
Interest expense 300 273<br />
Interest and dividend income (180) (139)<br />
EBITDA 7,203 5,630<br />
124
LIQUIDITY AND CAPITAL RESOURCES<br />
<strong>2005</strong> 2004 2003<br />
(million US dollars)<br />
Net cash provided by operating activities 6,097 4,180 2,936<br />
Net cash used in investing activities (6,225) (3,741) (2,792)<br />
Net cash provided by (used in) financing activities 539 (650) (4)<br />
Net debt 3,354 2,620 3,376<br />
Current ratio 2.14 1.89 1.50<br />
ANALYSIS OF FINANCIAL CONDITION<br />
AND RESULTS OF OPERATIONS<br />
Total debt to equity 19% 19% 28%<br />
Long term debt to long term debt and equity 13% 11% 12%<br />
Total net debt to cash flow from operations 0.55 0.63 1.15<br />
Our primary source of cash flow is funds generated from our operations. During <strong>2005</strong> cash generated by operating activities<br />
was $6,097 million, an increase of $1,917 million compared to 2004. In <strong>2005</strong> cash inflow from operating activity was<br />
impacted by the following factors:<br />
increase in revenue<br />
increase in amount of income tax paid<br />
increase in volume of export sales and, consequently, prepayment of custom fees, export duties and transportation<br />
tariffs.<br />
Moreover, in <strong>2005</strong> our operating cash inflows were significantly affected by an increase of working capital (excluding<br />
effect of acquisitions) by $1,540 million compared to January 1, <strong>2005</strong>. This was mainly caused by:<br />
an increase in trade accounts and notes receivable by $942 million, which was resulted from an increase in the price<br />
of crude oil and refined products and expansion of marketing activities<br />
an increase of inventory by $735 million, which was resulted from increased volumes of crude oil and refined products<br />
in stock and increased purchase prices.<br />
At the same time, this change in working capital was partly compensated by an increase in trade accounts and notes<br />
payable by $194 million, which was resulted from an increase in volumes of purchased crude oil and refined products<br />
and growth of related prices.<br />
During <strong>2005</strong> the Company spent $6,856 million on capital investments and acquisitions of interests in other companies,<br />
which was $3,131 million more than in 2004. In <strong>2005</strong> we paid $2,874 million (an increase of $2,397 million compared to<br />
2004) mainly for the acquisitions of Nelson, OAO Primorieneftegaz, Oy Teboil Ab and Suomen Petrooli Oy, remaining<br />
interest in ZAO SeverTEK, equity interest in OOO Geoilbent and increase of our share in LUKOIL Neftochim Burgas. Cash<br />
flows from investing activities include $588 million of cash received primarily from the sale of interests in<br />
OOO Narianmarneftegaz, ZAO Globalstroy-Engineering and ZAO Arktikneft.<br />
In <strong>2005</strong> the result of our financing activity was an inflow of $539 million compared to an outflow of $650 million in 2004.<br />
This change is explained by the loan of $1,934 million we received for financing acquisition of Nelson. Also in <strong>2005</strong> we<br />
repaid short-term borrowings by $468 million more than in 2004.<br />
The Company made payments of $746 million, $661 million, and $467 million for dividends in <strong>2005</strong>, 2004 and 2003,<br />
respectively.<br />
The Company has sufficient borrowing capacity to meet unanticipated cash requirements. As of December 31, <strong>2005</strong><br />
the Company had available unutilized short-term credit facilities with a number of banks in the amount of $1,264 million.<br />
During <strong>2005</strong> the Group systematically worked at decreasing the level of secured debt, mainly represented by the pledge<br />
of export receivables and fixed assets. As of December 31, <strong>2005</strong> the level of secured debt was 35% of the total debt,<br />
while as of December 31, 2004 – 48%.<br />
125
FINANCIAL ACCOUNTS<br />
Analysis of capital expenditures<br />
<strong>2005</strong> 2004 2003<br />
(millions of US dollars)<br />
Exploration and production<br />
Russia 2,487 2,100 1,537<br />
International 431 189 247<br />
Total exploration and production 2,918 2,289 1,784<br />
Refining, marketing and distribution<br />
Russia 654 677 911<br />
International 475 393 264<br />
Total refining, marketing and distribution 1,129 1,070 1,175<br />
Chemicals<br />
Russia 59 55 28<br />
International 18 16 11<br />
Total chemicals 77 71 39<br />
Other 53 17 20<br />
Total capital expenditures* 4,177 3,447 3,018<br />
Acquisitions of subsidiaries **<br />
Exploration and production<br />
Russia 778 23 989<br />
International 1,959 143 -<br />
Total exploration and production 2,737 166 989<br />
Refining, marketing and distribution<br />
Russia 27 1 23<br />
International 229 305 257<br />
Total refining, marketing and distribution 256 306 280<br />
Chemicals<br />
Russia - - -<br />
International - - -<br />
Total chemicals _ _ _<br />
Other _ 5 _<br />
Less cash acquired (119) - (44)<br />
Total 2,874 477 1,225<br />
* Including non-cash transactions.<br />
** Including prepayments related to acquisitions of subsidiaries and minority shareholding interest.<br />
126
Capital expenditures, including non-cash transactions, during <strong>2005</strong> amounted to $4,177 million, $730 million more than<br />
in the previous year. The growth was mainly caused by expenditures in our exploration and production segment, which<br />
increased by $629 million compared to 2004. The growth in exploration and production capital expenditures in new<br />
regions amounted to $367 million. The capital expenditures in traditional exploration regions of the Western Siberia<br />
increased by $110 million.<br />
The table below shows our exploration and production capital expenditures in new promising oil regions.<br />
Exploration and production<br />
<strong>2005</strong> 2004 2003<br />
(millions of US dollars)<br />
Northern Timan-Pechora 673 379 363<br />
Yamal 216 325 116<br />
ANALYSIS OF FINANCIAL CONDITION<br />
AND RESULTS OF OPERATIONS<br />
Caspian region 259 77 118<br />
Total 1,148 781 597<br />
2006 Capital Expenditures Program<br />
The Company estimates 2006 capital expenditures will be $5,068 million, which is about 21.3% higher than capital<br />
expenditures in <strong>2005</strong>. About $3,400 million, or 67.1% of the total, is budgeted for exploration and production activities,<br />
with $266 million of that outside of Russia. Exploration and production expenditures will target the most promising<br />
exploratory prospects in the Caspian region and major development projects in Timano-Pechora region as well as on the<br />
maintenance and increase of production on existing fields in the other regions. Refining, marketing and distribution<br />
capital spending is estimated to be $1,015 million, with $366 million of that outside of Russia. Refining, marketing and<br />
distribution expenditures in Russia will be allocated to upgrading our refineries and selling facilities. International refining,<br />
marketing and distribution capital spending will target our distribution infrastructure in the USA, Hungary, Romania and<br />
the other countries, as well as our refineries in Bulgaria, Ukraine and Romania. The capital expenditures in our chemical<br />
segment are estimated to be $85 million. The Company may amend the capital expenditures program during the year<br />
depending on economic conditions and financial performance of the Group.<br />
Credit rating<br />
The Company has a credit rating of BB by Standard and Poor's, which is three grades below the Russian country credit<br />
rating of BBB. Our bonds issued in 2002 are also rated BB.<br />
Moody's rated the Company at Ba1, which is two grades below the Russian country rating of Baa2.<br />
At the beginning of 2006 Fitch Ratings assigned the Company foreign currency and local currency Issuer Default Ratings<br />
(IDR) of BBB– and Short-term rating of F3. The outlooks for IDR are Stable. The Fitch's Russian country rating is BBB.<br />
127
FINANCIAL ACCOUNTS<br />
GUARANTEES, OFF-BALANCE-SHEET AGREEMENTS AND CONTRACTUAL OBLIGATIONS, AND<br />
OTHER CONTINGENCIES<br />
Financial Guarantees<br />
Commitment Expiration by Period<br />
Millions of dollars Total 2006 2007 2008 2009 2010 After<br />
Guarantees of equity affiliate's debt 454 42 129 80 93 110 -<br />
Guarantees of third party's debt 19 15 4 - - - -<br />
As of December 31, <strong>2005</strong> the Company provided guarantees of $454 million for loans of equity investee and $19 million<br />
for third parties. Guarantees issued in regard to LUKARCO, equity investee, primarily relate to borrowings for capital<br />
projects. These guarantees were undertaken to enhance the credit standing of the affiliated operations and to achieve<br />
lower interest rates. Under the terms of the guarantee, the Company would be required to perform should an affiliate be<br />
in default of its loans. There are no assets held as collateral for the obligations of affiliate.<br />
Capital commitments and contractual obligations<br />
The Company and its subsidiaries have significant capital commitments in respect to development of oil and gas fields<br />
in Russia. These commitments are regulated by law and described in the individual license agreements. Management<br />
believes that a significant portion of these commitments will be fulfilled by the services to be performed by Eurasia<br />
Drilling Company and ZAO Globalstroy-Engineering as discussed below. We also have long-term lease obligations for<br />
retail outlets in the USA and vessels.<br />
The Group owns and operates refineries in Bulgaria (LUKOIL Neftochim Bourgas AD) and Romania (Petrotel-LUKOIL). As<br />
a result of Bulgaria and Romania joining the European Union in 2007, LUKOIL Neftochim Bourgas AD and Petrotel-LUKOIL<br />
are required to upgrade their refining plants to comply with the requirements of European Union legislation in relation to<br />
the quality of produced petroleum products and environmental protection. These requirements are stricter than existing<br />
Bulgarian and Romanian legislation. The Group estimates the amount of future capital commitment required to upgrade<br />
LUKOIL Neftochim Bourgas AD and Petrotel-LUKOIL to be approximately $607 million and $60 million, respectively.<br />
In connection with the sale of LUKOIL-Burenie (now named Eurasia Drilling Company) the Group signed a five year contract<br />
for drilling services. Under the terms of the contract drilling services will be provided by Eurasia Drilling Company<br />
during the next four years totaling $2,276 million.<br />
The Company has signed a four-year agreement for the provision of construction, engineering and technical services with<br />
ZAO Globalstroy-Engineering. The volume of these services is based on the Group's capital construction program, which<br />
is re-evaluated on an annual basis. The Group estimates the amount of capital commitment under this agreement for<br />
2006 to be approximately $850 million.<br />
Group companies have investment commitments relating to oil deposits in Iraq of $495 million to be spent within 3 years<br />
from when exploitation becomes possible. Due to significant changes in the political and economic situation in Iraq the<br />
future of this contract is not clear, however, the Group is actively pursuing its legal right to this contract in Iraq in alliance<br />
with ConocoPhillips.<br />
128
The following table displays our total on and off balance sheet contractual obligations:<br />
Millions of dollars<br />
On balance sheet<br />
Total 2006 2007 2008 2009 2010 After<br />
Short term debt 316 316 - - - - -<br />
Long-term bank loans and borrowings 4,107 471 483 2,374 240 328 211<br />
Long-term non-bank loans and borrowings 126 19 34 25 9 9 30<br />
Long-term loans and borrowings from<br />
related parties 65 - - - - - 65<br />
3.5% Convertible US dollar bonds 94 28 66 - - - -<br />
ANALYSIS OF FINANCIAL CONDITION<br />
AND RESULTS OF OPERATIONS<br />
7.25% Russian ruble bonds 208 - - - 208 - -<br />
Capital lease obligations 74 19 17 15 10 9 4<br />
TOTAL 4,990 853 600 2,414 467 346 310<br />
Off balance sheet<br />
Operating lease obligations 1,140 316 180 108 88 88 360<br />
Obligation under contract with<br />
Eurasia Drilling Company 2,276 378 571 661 666 - -<br />
Capital commitment<br />
in LUKOIL-Neftochim Bourgas AD 607 80 168 186 173 - -<br />
Capital commitment in LUKOIL-Petrotel 60 5 9 3 7 12 24<br />
Obligation under contract with<br />
ZAO Globalstroy-Engineering 850 850 - - - - -<br />
Capital commitments in PSAs 479 339 60 34 4 2 40<br />
Capital commitments under oil<br />
and gas license agreements in Russia 1,495 421 424 206 226 103 115<br />
Litigation and claims<br />
On November 27, 2001, Archangel Diamond Corporation ("ADC"), a Canadian diamond development company, filed a lawsuit<br />
in the District Court of Denver, Colorado, against OAO "Arkhangelskgeoldobycha" ("AGD"), a Group company, and the<br />
Company (together the "Defendants"). ADC claims, among other things, that the Defendants interfered with the transfer<br />
of a diamond exploration license to Almazny Bereg, a joint venture between ADC and AGD. The total damages claimed<br />
by ADC are approximately $4.8 billion, including compensatory damages of $1.2 billion and punitive damages of $3.6 billion.<br />
On October 15, 2002, the District Court of Denver, Colorado dismissed ADC's action against the Defendants based<br />
on lack of personal jurisdiction. On November 22, 2002, the Denver District Court denied ADC's request for reconsideration<br />
of the Court's October 15th order dismissing the case. ADC subsequently filed an appeal on November 27, 2002<br />
with the Court of Appeals in the State of Colorado. On March 25, 2004, the Court of Appeals upheld the October 15, 2002<br />
decision of the District Court. On April 17, 2004, ADC filed a motion for rehearing that was denied on June 17, 2004. ADC<br />
then filed a petition for writ of certiorari with the Colorado Supreme Court on July 16, 2004. On January 10, <strong>2005</strong>, the<br />
Colorado Supreme Court granted certiorari on a narrow issue: whether the Court of Appeals erred by concluding that a<br />
trial court may decide a motion to dismiss for lack of personal jurisdiction by weighing and resolving factual issues without<br />
an evidentiary hearing. The Colorado Supreme Court declined to review ADC's other requested issue concerning<br />
jurisdiction. On November 21, <strong>2005</strong>, the Colorado Supreme Court affirmed the lower courts' findings that no specific<br />
jurisdiction exists over the Defendants. By virtue of this finding, AGD (the holder of the diamond exploration license) was<br />
dismissed from the lawsuit. The Supreme Court found however, that the trial court erred by not holding an evidentiary<br />
hearing concerning the existence of general jurisdiction, which is whether the Company had systematic and continuous<br />
contacts in the State of Colorado at the time the lawsuit was filed. Therefore, the lawsuit was initially remanded to the<br />
trial court to hold an evidentiary hearing on the issue of general jurisdiction. However, in response to a petition for rehear-<br />
129
FINANCIAL ACCOUNTS<br />
ing filed by the Company, the Supreme Court issued a modified opinion on December 19, <strong>2005</strong> remanding this case to<br />
the Court of Appeals to consider any remaining issues that were not addressed by the Court of Appeals' previous decision.<br />
On March 2, 2006, the Court of Appeals granted the Company's motion to permit supplemental briefing on the issue<br />
of forum non convenience. Briefs on this issue were filed by the Company and ADC on March 27, 2006. The Company<br />
has filed a motion requesting oral argument on forum non convenience; the Court of Appeals has not ruled on this<br />
request. No other timetable has been established for the proceedings in the Court of Appeals. Management does not<br />
believe that the ultimate resolution of this matter will have a material adverse effect on the Group's financial condition.<br />
On February 20, 2004, the Stockholm District Court overturned the decision of the Arbitral Tribunal of the Arbitration<br />
Institute of the Stockholm Chamber of Commerce made on June 25, 2001 dismissing ADC's action against AGD based<br />
on lack of jurisdiction. ADC's lawsuit against AGD was initially filed with the Arbitral Tribunal of the Arbitration Institute<br />
of the Stockholm Chamber of Commerce claiming alleged non-performance under an agreement between the parties<br />
and its obligation to transfer the diamond exploration license to Almazny Bereg. This lawsuit claimed compensation of<br />
damages amounting to $492 million. In March 2004, AGD filed an appeal against the Stockholm District Court decision<br />
with the Swedish Court of Appeals. On November 15, <strong>2005</strong>, the Swedish Court of Appeals denied AGD's appeal and<br />
affirmed the Stockholm District Court decision. On December 13, <strong>2005</strong>, AGD filed an appeal against the Swedish Court<br />
of Appeals decision with the Swedish Supreme Court. The decision of the Swedish Supreme Court is expected to be<br />
issued during 2006. Management does not believe that the ultimate resolution of this matter will have a material adverse<br />
effect on the Group's financial condition.<br />
The Group is involved in various other claims and legal proceedings arising in the normal course of business. While these<br />
claims may seek substantial damages against the Group and are subject to uncertainty inherent in any litigation, management<br />
does not believe that the ultimate resolution of such matters will have a material adverse impact on the Group's<br />
operating results or financial condition.<br />
130
QUANTITATIVE AND QUALITATIVE DISCLOSURES ABOUT MARKET RISKS<br />
Interest rate risk<br />
We are exposed to changes in interest rates, primarily associated with our variable rate short-term and long-term<br />
borrowings. We do not utilize any interest rate swaps or other derivatives to hedge against the risk of changes in interest<br />
rates on our variable rate debt. As of December 31, <strong>2005</strong> our long-term borrowings that are sensitive to change in<br />
interest rates totaled $3,805 million (for details please refer to Note 12 "Long term debts" of the consolidated financial<br />
statement). Utilizing the actual fixed interest rates in effect and the balance of our variable rate debt as of December 31,<br />
<strong>2005</strong> and assuming a 10% change in interest rates and no change in the balance of debt outstanding, the potential effect<br />
on annual interest expense would not be material to our results of operations.<br />
Foreign currency risk<br />
The countries in which our principal operations are located have been subject to hyperinflation and during the last<br />
10 years the local currency has been subject to large devaluations. As a result we are subject to the risk that the local<br />
currency may suffer future devaluation that may subject us to losses, depending on our net monetary asset position. We<br />
currently do not use any formal hedging arrangements to minimize the effect of these potential losses. Additionally,<br />
because we have operations in a number of other countries we are required to conduct business in a variety of foreign<br />
currencies and, as a result, we are subject to foreign exchange rate risk on cash flows related to sales, expenses, financing<br />
and investment transactions. The impacts of fluctuations in foreign currency exchange rates on our geographically<br />
diverse operations are varied. We recognized a net foreign currency translation loss of $134 million in <strong>2005</strong>, and gains of<br />
$135 million and $148 million for the years ended December 31, 2004 and 2003, respectively.<br />
Appreciation of ruble against the US dollar in <strong>2005</strong> had a negative impact on our operating profit and cash flows since it<br />
lead to an increase of our costs in dollar terms and a decrease of amount of the export cash revenue in the ruble terms.<br />
As mentioned above, a substantial part of our revenue is denominated in US dollars or, to some extent, bound to the oil<br />
prices quoted in US dollars, while a significant part of our costs is ruble denominated.<br />
ANALYSIS OF FINANCIAL CONDITION<br />
AND RESULTS OF OPERATIONS<br />
Commodity instruments<br />
The Group participates in certain petroleum products marketing and trading activity outside of its physical crude oil and<br />
petroleum products businesses. The Group's derivative activity is limited to these marketing and trading activities and<br />
hedging of commodity price risks. Currently this activity involves the use of futures and swaps contracts together with<br />
purchase and sale contracts that qualify as derivative instruments. The Company maintains a system of controls over these<br />
marketing and trading activities that includes policies covering the authorization, reporting and monitoring of derivative<br />
activity. We do not believe our derivative activities pose material credit or market risks to our operations, financial condition<br />
or liquidity. The Group recognized an expense from the use of derivative instruments of $171 million, $55 million and<br />
$37 million during <strong>2005</strong>, 2004 and 2003, respectively. The fair value of derivative contracts outstanding and recorded on<br />
the consolidated balance sheet as of December 31, <strong>2005</strong> was a net liability of $26 million (a net asset of $28 million and<br />
a net liability $1 million in 2004 and 2003, respectively).<br />
131
FINANCIAL ACCOUNTS<br />
CRITICAL ACCOUNTING POLICIES<br />
The preparation of financial statements in conformity with accounting principles generally accepted in the United States<br />
of America requires management to select appropriate accounting policies and to make estimates and assumptions that<br />
affect the reported amounts of assets, liabilities, revenues and expenses. See Note 2, "Summary of significant accounting<br />
policies," for descriptions of the Company's major accounting policies. Certain of these accounting policies involve<br />
judgments and uncertainties to such an extent that there is a reasonable likelihood that materially different amounts<br />
would have been reported under different conditions, or if different assumptions had been used.<br />
Successful Efforts Accounting for Oil and Gas Activities<br />
Accounting for oil and gas activities is subject to special accounting rules that are unique to the oil and gas industry.<br />
Property acquisitions, successful exploratory wells, all development costs and support equipment and facilities are<br />
capitalized. Artificial stimulation and well work-over costs are included in operating expenses as incurred.<br />
Property Acquisition Costs<br />
For individually significant undeveloped properties, management periodically performs impairment test based on exploration<br />
and drilling efforts to date. For undeveloped properties that individually are relatively small, management exercises<br />
judgment and determines a periodic property impairment charge as required that is reported in exploration expense.<br />
Exploratory Costs<br />
For exploratory wells, drilling costs are temporarily capitalized, or "suspended", on the balance sheet, pending a judgmental<br />
determination of whether potentially economic oil and gas reserves have been discovered by the drilling effort.<br />
If a judgment is made that the well did not encounter potentially economic oil and gas quantities, the well costs are<br />
expensed as a dry hole and are reported in exploration expense. Exploratory wells that are judged to have discovered<br />
potentially economic quantities of oil and gas and that are in areas where a major capital expenditure would be required<br />
before production could begin, remain capitalized on the balance sheet as long as additional exploratory appraisal work<br />
is under way or firmly planned. There is no periodic impairment assessment of suspended exploratory well costs.<br />
Management continuously monitors the results of the additional appraisal drilling and seismic work and expenses the<br />
suspended well costs as dry holes when it judges that the potential field does not warrant further exploratory efforts<br />
in the near term.<br />
Other exploratory expenditures, including geological and geophysical costs are expensed as incurred.<br />
Proved Oil and Gas Reserves<br />
Proved oil and gas reserves are the estimated quantities of crude oil, natural gas liquids including condensate and<br />
natural gas that geological and engineering data demonstrate with reasonable certainty can be recovered in future<br />
years from known reservoirs under existing economic and operating conditions. Reserves are considered proved if<br />
they can be produced economically as demonstrated by either actual production or conclusive formation tests. Proved<br />
reserves do not include additional quantities of oil and gas reserves that may result from extensions of currently<br />
proved areas or from applying secondary or tertiary recovery techniques not yet tested and determined to be economic.<br />
Proved developed reserves are expected to be produced through existing wells and with existing facilities and<br />
operating methods.<br />
The estimates are made using all available geological and reservoir data as well as historical production data. Estimates<br />
are reviewed and revised as appropriate. Revisions occur as a result of changes in prices, costs, fiscal regimes, reservoir<br />
performance or a change in the Company's plans.<br />
The Group has included within proved reserves quantities, which the Group expects to produce after the expiry dates of<br />
its current production licenses. These licenses expire between 2011 and 2026, with the most significant expiring<br />
between 2011 and 2014. We believe the licenses will be extended to produce subsequent to their current expiry dates.<br />
The Group is in the process of extending all of its production licenses in the Russian Federation. The Group has already<br />
extended a portion of these licenses and expects to extend the remaining licenses for indefinite periods. To date there<br />
have been no unsuccessful license renewal applications.<br />
Impairment Of Long-Lived Assets<br />
Long lived assets, such as oil and gas properties, other property, plant, and equipment, and purchased intangibles<br />
subject to amortization, are assessed for impairment whenever events or changes in circumstances indicate that the<br />
carrying amount of an asset group may not be recoverable. Recoverability of assets to be held and used is measured by<br />
a comparison of the carrying amount of an asset group to the estimated undiscounted future cash flows expected to be<br />
generated by that group. If the carrying amount of an asset group exceeds its estimated undiscounted future cash flows,<br />
an impairment charge is recognized by writing down the carrying amount to the estimated fair value of the asset group,<br />
132
generally determined as discounted future net cash flows. Assets to be disposed of are separately presented in the balance<br />
sheet and reported at the lower of the carrying amount or fair value less costs to sell, and are no longer depreciated.<br />
The assets and liabilities of a disposed group classified as held for sale are presented separately in the appropriate<br />
asset and liability sections of the balance sheet.<br />
Asset Retirement Obligations<br />
Under various laws, contracts, permits and regulations, the Company has legal obligations to remove tangible equipment<br />
and restore the land or seabed at the end of operations at production sites. The largest asset retirement obligations of<br />
the Company relate to wells and oil and gas production facilities and pipelines. In accordance with SFAS No. 143,<br />
"Accounting for Asset Retirement Obligations", the Company records the fair value of liabilities associated with such obligations<br />
when incurred. See Note 2 of the financial statements which describes the Company's adoption of SFAS No. 143<br />
effective January 1, 2003. Estimating the future asset retirement obligations costs necessary for this accounting calculation<br />
involves significant estimates and judgments by management. Most of these obligations are many years in the<br />
future and the contracts and regulations often have vague descriptions of what removal practices and criteria will have<br />
to be met when the removal event actually occurs. Asset removal technologies and costs are constantly changing, as<br />
well as political, environmental, safety and public relations considerations.<br />
ANALYSIS OF FINANCIAL CONDITION<br />
AND RESULTS OF OPERATIONS<br />
Contingencies<br />
The Company is required to both determine whether a loss is probable based on judgment and interpretation of laws and<br />
regulations and determine that the loss can be reasonably estimated. When the loss is determined it is charged to income<br />
statement. The Company's management must continually monitor known and potential contingent matters and make<br />
appropriate provisions by charges to income statement when warranted by circumstance.<br />
Pension Benefits<br />
Determination of the projected benefit obligations for the Company's defined benefit pension plan is important to the<br />
recorded amounts for such obligations on the balance sheet and to the amount of benefit expense in the income statement.<br />
This also impacts the required Company contributions into the plans. The actuarial determination of projected<br />
benefit obligations and Company contribution requirements involves judgment about uncertain future events, including<br />
estimated retirement dates, salary levels at retirement, mortality rates, lump-sum election rates and rates of return on<br />
plan assets. The judgmental assumptions used in the actuarial calculations significantly affect periodic financial statements<br />
and funding patterns over time. Benefit expense is particularly sensitive to the discount rate and return on plan<br />
assets assumptions. Due to the specialized nature of these calculations, the Company engages outside actuarial firms to<br />
assist in the determination of these projected benefit obligations.<br />
Recent Accounting Pronouncements<br />
In December 2004, the FASB issued SFAS No. 123(R) "Share-Based Payment", which revises SFAS No. 123 and supersedes<br />
Accounting Principles Board (APB) Opinion No. 25 regarding stock-based employee compensation plans. SFAS No.<br />
123(R) requires all share-based payments to employees, including grants of employee stock options, to be valued at fair<br />
value on the date of grant, and to be expensed over the applicable vesting period. The Group will adopt the provisions of<br />
SFAS No. 123(R) in the first quarter 2006 and is currently assessing the effect of adoption.<br />
In April <strong>2005</strong>, the FASB staff issued FASB Staff Position ("FSP") No. FAS 19-1 "Accounting for Suspended Well Costs".<br />
FSP No. 19-1 amends SFAS No. 19 "Financial Accounting and Reporting by Oil and Gas Producing Companies" to revise<br />
the criteria for continued capitalization of costs in relation to exploratory wells and exploratory-type stratigraphic wells.<br />
As amended, SFAS No. 19 allows continued capitalization of such costs for more than one year, provided (a) the well has<br />
found a sufficient quantity of reserves to justify its completion as a producing well and (b) the company is making sufficient<br />
progress assessing the reserves and the economic and operating viability of the project. If either condition is not<br />
met or if a company obtains information that raises substantial doubt about the economic or operational viability of the<br />
project, the exploratory well would be assumed impaired, and its costs, net of any salvage value, would be charged to<br />
expense. Following adoption of the changes, certain exploration costs which would have been charged to the income<br />
statement will remain capitalized and will instead be subject to depreciation, depletion and amortization in future periods.<br />
FSP No. 19-1 also requires certain additional disclosures in relation to suspended well costs. The adoption of the provisions<br />
of FSP No. 19-1 during <strong>2005</strong> did not have a material impact on the Group's results of operations, financial position<br />
or cash flows.<br />
133
FINANCIAL ACCOUNTS<br />
CONSOLIDATED FINANCIAL STATEMENTS<br />
(PREPARED IN ACCORDANCE WITH US GAAP)<br />
AS OF DECEMBER 31, <strong>2005</strong> AND 2004 AND FOR EACH OF THE<br />
YEARS IN THE THREE YEAR PERIOD ENDED DECEMBER 31, <strong>2005</strong><br />
INDEPENDENT AUDITORS' <strong>REPORT</strong><br />
To the Board of Directors of OAO LUKOIL:<br />
We have audited the accompanying consolidated balance sheets of OAO LUKOIL and its subsidiaries as of December<br />
31, <strong>2005</strong> and 2004, and the related consolidated statements of income, stockholders' equity and comprehensive income,<br />
and cash flows for each of the years in the three-year period ended December 31, <strong>2005</strong>. These consolidated financial<br />
statements are the responsibility of the management of OAO LUKOIL. Our responsibility is to express an opinion on<br />
these consolidated financial statements based on our audits.<br />
We conducted our audits in accordance with auditing standards generally accepted in the United States of America.<br />
Those standards require that we plan and perform the audit to obtain reasonable assurance about whether the financial<br />
statements are free of material misstatement. An audit includes examining, on a test basis, evidence supporting the<br />
amounts and disclosures in the financial statements. An audit also includes assessing the accounting principles used and<br />
significant estimates made by management, as well as evaluating the overall financial statement presentation. We<br />
believe that our audits provide a reasonable basis for our opinion.<br />
In our opinion, the consolidated financial statements referred to above present fairly, in all material respects, the financial<br />
position of OAO LUKOIL and its subsidiaries as of December 31, <strong>2005</strong> and 2004, and the results of their operations and<br />
their cash flows for each of the years in the three-year period ended December 31, <strong>2005</strong>, in conformity with accounting<br />
principles generally accepted in the United States of America.<br />
KPMG Limited<br />
Moscow, Russian Federation<br />
May 15, 2006<br />
134
OAO LUKOIL<br />
Consolidated Balance Sheets<br />
As of December 31, <strong>2005</strong> and 2004<br />
(Millions of US dollars, unless otherwise noted)<br />
Note <strong>2005</strong> 2004<br />
Assets<br />
Current assets<br />
Cash and cash equivalents 3 1,650 1,257<br />
Short-term investments 111 149<br />
Accounts and notes receivable, net 5 5,533 3,867<br />
Inventories 6 2,619 1,759<br />
Prepaid taxes and other expenses 2,107 1,242<br />
Other current assets 287 300<br />
Assets held for sale 10 190 -<br />
Total current assets 12,497 8,574<br />
CONSOLIDATED FINANCIAL STATEMENTS<br />
Investments 7 1,110 779<br />
Property, plant and equipment 8 25,464 19,329<br />
Deferred income tax assets 13 181 138<br />
Goodwill and other intangible assets 9 680 610<br />
Other non-current assets 413 331<br />
Total assets 40,345 29,761<br />
Liabilities and Stockholders' equity<br />
Current liabilities<br />
Accounts payable 2,167 1,787<br />
Short-term borrowings and current portion of long-term debt 11 853 1,265<br />
Taxes payable 2,087 1,238<br />
Other current liabilities 729 255<br />
Total current liabilities 5,836 4,545<br />
Long-term debt 12, 16 4,137 2,609<br />
Deferred income tax liabilities 13 1,830 698<br />
Asset retirement obligations 8 387 307<br />
Other long-term liabilities 332 338<br />
Minority interest in subsidiary companies 1,019 453<br />
Total liabilities 13,541 8,950<br />
Stockholders' equity 15<br />
Common stock 15 15<br />
Treasury stock, at cost (527) (706)<br />
Additional paid-in capital 3,730 3,564<br />
Retained earnings 23,586 17,938<br />
Total stockholders' equity 26,804 20,811<br />
Total liabilities and stockholders' equity 40,345 29,761<br />
_________________________________________________<br />
President of OAO LUKOIL<br />
Alekperov V.Y.<br />
_______________________________________________<br />
Deputy Chief accountant of OAO LUKOIL<br />
Kozyrev I.A.<br />
The accompanying notes are an integral part of these consolidated financial statements.<br />
135
FINANCIAL ACCOUNTS<br />
OAO LUKOIL<br />
Consolidated Statements of Income<br />
For the years ended December 31, <strong>2005</strong>, 2004 and 2003<br />
(Millions of US dollars, unless otherwise noted)<br />
Revenues<br />
Note <strong>2005</strong> 2004 2003<br />
Sales (including excise and export tariffs) 23 55,774 33,845 22,118<br />
Equity share in income of affiliates 7 441 213 181<br />
Total revenues 56,215 34,058 22,299<br />
Costs and other deductions<br />
Operating expenses (3,487) (2,880) (2,546)<br />
Cost of purchased crude oil, petroleum and chemical<br />
products (19,398) (10,124) (5,909)<br />
Transportation expenses (3,519) (2,784) (2,052)<br />
Selling, general and administrative expenses (2,578) (2,024) (1,800)<br />
Depreciation, depletion and amortization (1,315) (1,075) (920)<br />
Taxes other than income taxes 13 (6,334) (3,505) (2,456)<br />
Excise and export tariffs (9,931) (5,248) (2,954)<br />
Exploration expenses (317) (171) (136)<br />
Gain from sale of interest in Azeri Chirag Guneshli 10 - - 1,130<br />
Gain (loss) on disposals and impairments of assets 52 (213) (69)<br />
Income from operating activities 9,388 6,034 4,587<br />
Interest expense (275) (300) (273)<br />
Interest and dividend income 96 180 139<br />
Currency translation (loss) gain (134) 135 148<br />
Other non-operating (expense) income (44) 21 11<br />
Minority interest (121) (62) (36)<br />
Income before income taxes 8,910 6,008 4,576<br />
Current income taxes (2,301) (1,614) (939)<br />
Deferred income taxes (166) (146) (68)<br />
Total income tax expense 13 (2,467) (1,760) (1,007)<br />
Income before cumulative effect of change<br />
in accounting principle 6,443 4,248 3,569<br />
Cumulative effect of change in accounting<br />
principle, net of tax 2 - - 132<br />
Net income 6,443 4,248 3,701<br />
Per share of common stock (US dollars):<br />
Income before cumulative effect of change<br />
in accounting principle<br />
Basic 15 7.91 5.20 4.36<br />
Diluted 15 7.79 5.13 4.30<br />
Net Income<br />
Basic 15 7.91 5.20 4.52<br />
Diluted 15 7.79 5.13 4.45<br />
The accompanying notes are an integral part of these consolidated financial statements.<br />
136
OAO LUKOIL<br />
Consolidated Statements of Stockholders' Equity and Comprehensive Income<br />
For the years ended December 31, <strong>2005</strong>, 2004 and 2003<br />
(Millions of US dollars, unless otherwise noted)<br />
Common stock<br />
Stockholders'<br />
equity<br />
<strong>2005</strong> 2004 2003<br />
Comprehensive<br />
income<br />
Stockholders'<br />
equity<br />
Comprehensive<br />
income<br />
Stockholders'<br />
equity<br />
Balance as of January 1 15 15 15<br />
Outstanding as of December 31 15 15 15<br />
Treasury stock<br />
Balance as of January 1 (706) (435) (428)<br />
Stock purchased - (502) (368)<br />
Stock sold 179 231 361<br />
Balance as of December 31 (527) (706) (435)<br />
Additional paid-in capital<br />
Balance as of January 1 3,564 3,522 3,229<br />
Premium on non-outstanding shares issued 47 - 38<br />
Proceeds from sale of treasury stock<br />
in excess of carrying amount 119 42 255<br />
Balance as of December 31 3,730 3,564 3,522<br />
Retained earnings<br />
Comprehensive<br />
income<br />
Balance as of January 1 17,938 - 14,371 - 11,186 -<br />
Net income 6,443 6,443 4,248 4,248 3,701 3,701<br />
Dividends on common stock (795) - (681) - (516) -<br />
Balance as of December 31 23,586 17,938 14,371<br />
CONSOLIDATED FINANCIAL STATEMENTS<br />
Accumulated other comprehensive loss, net of tax<br />
Balance as of January 1 - - (1) - (2) -<br />
Foreign currency translation adjustment - - 1 1 1 1<br />
Balance as of December 31 - - (1)<br />
Total comprehensive income for the year 6,443 4,249 3,702<br />
Total stockholders' equity as of December 31 26,804 20,811 17,472<br />
Share activity<br />
<strong>2005</strong> 2004 2003<br />
(millions of shares) (millions of shares) (millions of shares)<br />
Common stock, issued<br />
Balance as of January 1 850 850 850<br />
Balance as of December 31 850 850 850<br />
Treasury stock<br />
Balance as of January 1 (34) (26) (27)<br />
Purchase of treasury stock - (18) (19)<br />
Sales of treasury stock 12 10 20<br />
Balance as of December 31 (22) (34) (26)<br />
The accompanying notes are an integral part of these consolidated financial statements.<br />
137
FINANCIAL ACCOUNTS<br />
OAO LUKOIL<br />
Consolidated Statements of Cash Flows<br />
For the years ended December 31, <strong>2005</strong>, 2004 and 2003<br />
(Millions of US dollars)<br />
Cash flows from operating activities<br />
Note <strong>2005</strong> 2004 2003<br />
Net income 6,443 4,248 3,701<br />
Adjustments for non-cash items:<br />
Cumulative effect of change in accounting principle - - (132)<br />
Depreciation, depletion and amortization 1,315 1,075 920<br />
Equity share in income of affiliates (397) (169) (122)<br />
Gain from sale of interest in Azeri Chirag Guneshli 10 - - (1,130)<br />
Dry hole costs 170 42 48<br />
(Gain) loss on disposals and impairments of assets (52) 213 69<br />
Deferred income taxes 166 146 68<br />
Non-cash currency translation (gain) loss (26) (4) 17<br />
Non-cash investing activities (133) (123) (64)<br />
All other items – net 151 97 32<br />
Changes in operating assets and liabilities:<br />
Accounts and notes receivable (1,314) (694) (797)<br />
Short-term loans receivable of a banking subsidiary (23) (101) (223)<br />
Customer deposits placed in a banking subsidiary 49 (90) 341<br />
Inventories (735) (571) (153)<br />
Accounts payable 245 306 186<br />
Taxes payable 705 310 284<br />
Other current assets and liabilities (467) (505) (109)<br />
Net cash provided by operating activities 6,097 4,180 2,936<br />
Cash flows from investing activities<br />
Capital expenditures (3,982) (3,248) (2,881)<br />
Proceeds from sale of property, plant and equipment 51 99 62<br />
Purchases of investments (242) (540) (459)<br />
Proceeds from sale of investments 234 242 374<br />
Proceeds from sale of interest in Azeri Chirag Guneshli 10 - - 1,337<br />
Sale of interests in subsidiaries and affiliated companies 588 183 -<br />
Acquisitions of subsidiaries and minority shareholding<br />
interest (including advances related to these acquisitions),<br />
net of cash acquired (2,874) (477) (1,225)<br />
Net cash used in investing activities (6,225) (3,741) (2,792)<br />
The accompanying notes are an integral part of these consolidated financial statements.<br />
138
OAO LUKOIL<br />
Consolidated Statements of Cash Flows<br />
For the years ended December 31, <strong>2005</strong>, 2004 and 2003 (continued)<br />
(Millions of US dollars)<br />
Cash flows from financing activities<br />
Note <strong>2005</strong> 2004 2003<br />
Net movements of short-term borrowings (638) (170) 220<br />
Proceeds from issuance of long-term debt 2,474 1,191 1,445<br />
Principal repayments of long-term debt (704) (778) (1,124)<br />
Dividends paid (746) (661) (467)<br />
Financing from related party 101 - -<br />
CONSOLIDATED FINANCIAL STATEMENTS<br />
Purchase of treasury stock - (502) (368)<br />
Proceeds from sale of treasury stock 46 273 290<br />
Other – net 6 (3) -<br />
Net cash provided by (used in) financing activities 539 (650) (4)<br />
Effect of exchange rate changes on cash and cash equivalents (18) 33 43<br />
Net increase (decrease) in cash and cash equivalents 393 (178) 183<br />
Cash and cash equivalents at beginning of year 1,257 1,435 1,252<br />
Cash and cash equivalents at end of year 3 1,650 1,257 1,435<br />
Supplemental disclosures of cash flow information<br />
Interest paid 296 291 320<br />
Income taxes paid 2,402 1,803 895<br />
The accompanying notes are an integral part of these consolidated financial statements.<br />
139
FINANCIAL ACCOUNTS<br />
OAO LUKOIL<br />
Notes to Consolidated Financial Statements<br />
(Millions of US dollars, except as indicated)<br />
NOTE 1. ORGANIZATION AND ENVIRONMENT<br />
The primary activities of OAO LUKOIL (the "Company") and its subsidiaries (together, the "Group") are oil exploration,<br />
production, refining, marketing and distribution. The Company is the ultimate parent entity of this vertically integrated<br />
group of companies.<br />
The Group was established in accordance with Presidential Decree 1403, issued on November 17, 1992 under which,<br />
on April 5, 1993, the Government of the Russian Federation transferred to the Company 51% of the voting shares of<br />
fifteen enterprises, and Government Resolution 861 issued on September 1, 1995 under which, during 1995, a further<br />
nine enterprises were transferred to the Group. Since 1995 the Group has carried out a share exchange program to<br />
increase its shareholding in each of the twenty-four founding subsidiaries to 100%.<br />
From formation, the Group has expanded substantially through consolidation of its interests, acquisition of new companies<br />
and establishment of new businesses.<br />
Business and economic environment<br />
The Russian Federation has been experiencing political and economic change, which has affected and will continue to<br />
affect the activities of enterprises operating in this environment. Consequently, operations in the Russian Federation<br />
involve risks, which do not typically exist in other markets.<br />
The accompanying financial statements reflect management's assessment of the impact of the business environment in<br />
the countries in which the Group operates on the operations and the financial position of the Group. The future business<br />
environments may differ from management's assessment.<br />
Basis of preparation<br />
These consolidated financial statements have been prepared by the Company in accordance with accounting principles<br />
generally accepted in the United States of America ("US GAAP").<br />
NOTE 2. SUMMARY OF SIGNIFICANT ACCOUNTING POLICIES<br />
Principles of consolidation<br />
The financial position and results of subsidiaries of which the Company directly or indirectly owns more than 50% of the<br />
voting interest and which the Company controls, are included with the financial position and results of the Company in<br />
these consolidated financial statements unless minority interest holders have substantive participating rights. The Group<br />
applies the same principles of consolidation for variable interest entities where it is determined to be the primary beneficiary.<br />
Other significant investments in companies of which the Company directly or indirectly owns between 20% and<br />
50% of the voting interest and over which the Company exercises significant influence but not control, are accounted<br />
for using the equity method of accounting. Investments in companies of which the Company directly or indirectly owns<br />
more than 50% of the voting interest but where minority interest shareholders have substantive participating rights are<br />
accounted for using the equity method of accounting. Investments in other companies are recorded at cost. Equity<br />
investments and investments in other companies are included in "Investments" in the consolidated balance sheets.<br />
Use of estimates<br />
The preparation of financial statements in conformity with US GAAP requires management to make estimates and assumptions<br />
that affect the reported amounts of assets and liabilities and disclosure of contingent assets and liabilities at the date of<br />
the financial statements, and the reported amounts of revenues and expenses during the reporting period. Significant items<br />
subject to such estimates and assumptions include the carrying value of oil and gas properties and other property, plant and<br />
equipment, goodwill impairment assessment, asset retirement obligations, deferred income taxes, valuation of financial<br />
instruments, and obligations related to employee benefits. Eventual actual amounts could differ from those estimates.<br />
Revenue recognition<br />
Revenues from the production and sale of crude oil and petroleum products are recognized when title passes<br />
to customers.<br />
Revenues from non-cash sales are recognized at the fair market value of the crude oil and petroleum products sold.<br />
140
Foreign currency translation<br />
The Company maintains its accounting records in Russian rubles. The Company's functional currency is the US dollar and<br />
the Group's reporting currency is the US dollar.<br />
For operations in the Russian Federation, hyperinflationary economies or operations where the US dollar is the functional<br />
currency, monetary assets and liabilities have been translated into US dollars at the rate prevailing at each balance<br />
sheet date. Non-monetary assets and liabilities have been translated into US dollars at historical rates. Revenues, expenses<br />
and cash flows have been translated into US dollars at rates, which approximate actual rates at the date of the transaction.<br />
Translation differences resulting from the use of these rates are included in the consolidated statement of income.<br />
For the majority of operations outside the Russian Federation, the US dollar is the functional currency. For certain other<br />
operations outside the Russian Federation, where the US dollar is not the functional currency and the economy is not<br />
hyperinflationary, assets and liabilities are translated into US dollars at year-end exchange rates and revenues and expenses<br />
are translated at average exchange rates for the year. Resulting translation adjustments are reflected as a separate<br />
component of comprehensive income.<br />
Foreign currency transaction gains and losses are included in the consolidated statement of income.<br />
As of December 31, <strong>2005</strong>, 2004 and 2003, exchange rates of 28.78, 27.75 and 29.45 Russian rubles to the US dollar,<br />
respectively, have been used for translation purposes.<br />
The Russian ruble and other currencies of republics of the former Soviet Union are not readily convertible outside of their<br />
countries. Accordingly, the translation of amounts recorded in these currencies into US dollars should not be construed<br />
as a representation that such currency amounts have been, could be or will in the future be converted into US dollars at<br />
the exchange rate shown or at any other exchange rate.<br />
CONSOLIDATED FINANCIAL STATEMENTS<br />
Cash and cash equivalents<br />
Cash and cash equivalents include all highly liquid investments with an original maturity of three months or less.<br />
Cash with restrictions on immediate use<br />
Cash funds for which restrictions on immediate use exist are accounted for within other non-current assets. Interest<br />
bearing security deposits with credit institutions that do not reduce the balance on long-term loan accounts are accounted<br />
for within long-term investments.<br />
Accounts and notes receivable<br />
Accounts and notes receivable are recorded at their transaction amounts less provisions for doubtful debts. Provisions<br />
for doubtful debts are recorded to the extent that there is a likelihood that any of the amounts due will not be obtained.<br />
Non-current receivables are discounted to the present value of expected cash flows in future periods using the original<br />
discount rate.<br />
Inventories<br />
Inventories, consisting primarily of stocks of crude oil, petroleum products and materials and supplies, are stated at the<br />
lower of cost or market value. Cost is determined using an "average cost" method.<br />
Investments<br />
Debt and equity securities are classified into one of three categories: trading, available-for-sale, or held-to-maturity.<br />
Trading securities are bought and held principally for the purpose of selling in the near term. Held-to-maturity securities<br />
are those securities in which a Group company has the ability and intent to hold until maturity. All securities not included<br />
in trading or held-to-maturity are classified as available-for-sale.<br />
Trading and available-for-sale securities are recorded at fair value. Held-to-maturity securities are recorded at cost, adjusted<br />
for the amortization or accretion of premiums or discounts. Unrealized holding gains and losses on trading securities<br />
are included in the consolidated statement of income. Unrealized holding gains and losses, net of the related tax effect,<br />
on available-for-sale securities are reported as a separate component of comprehensive income until realized. Realized<br />
gains and losses from the sale of available-for-sale securities are determined on a specific identification basis. Dividends<br />
and interest income are recognized in the consolidated statement of income when earned.<br />
A permanent decline in the market value of any available-for-sale or held-to-maturity security below cost is accounted for<br />
as a reduction in the carrying amount to fair value. The impairment is charged to the consolidated statement of income<br />
and a new cost base for the security is established. Premiums and discounts are amortized or accreted over the life of<br />
the related held-to-maturity or available-for-sale security as an adjustment to yield using the effective interest method and<br />
such amortization and accretion is recorded in the consolidated statement of income.<br />
141
FINANCIAL ACCOUNTS<br />
Property, plant and equipment<br />
Oil and gas properties are accounted for using the successful efforts method of accounting whereby property acquisitions,<br />
successful exploratory wells, all development costs, and support equipment and facilities are capitalized.<br />
Unsuccessful exploratory wells are expensed when a well is determined to be non-productive. Other exploratory expenditures,<br />
including geological and geophysical costs are expensed as incurred.<br />
Depreciation, depletion and amortization of capitalized costs of oil and gas properties is calculated using the<br />
unit-of-production method based upon proved reserves for the cost of property acquisitions and proved developed<br />
reserves for exploration and development costs.<br />
Production and related overhead costs are expensed as incurred.<br />
Depreciation of assets not directly associated with oil production is calculated on a straight-line basis over the economic<br />
lives of such assets, estimated to be in the following ranges:<br />
Buildings and constructions 5 – 40 Years<br />
Machinery and equipment 5 – 20 Years<br />
In addition to production assets, certain Group companies also maintain and construct social assets for the use of local<br />
communities. Such assets are capitalized only to the extent that they are expected to result in future economic benefits<br />
to the Group. If capitalized, they are depreciated over their estimated economic lives.<br />
Goodwill and other intangible assets<br />
Goodwill represents the excess of the cost of an acquired entity over the net of the amounts assigned to assets acquired<br />
and liabilities assumed. It is assigned to reporting units as of the acquisition date. Goodwill is not amortized, but is<br />
tested for impairment at least on an annual basis and between annual tests if an event occurs or circumstances change<br />
that would more likely than not reduce the fair value of a reporting unit below its carrying amount. The impairment test<br />
requires estimating the fair value of a reporting unit and comparing it with its carrying amount, including goodwill<br />
assigned to the reporting unit. If the estimated fair value of the reporting unit is less than its net carrying amount, including<br />
goodwill, then the goodwill is written down to its implied fair value.<br />
Intangible assets with indefinite useful lives are tested for impairment at least annually. Intangible assets that have<br />
limited useful lives are amortized on a straight-line basis over the shorter of their useful or legal lives.<br />
Impairment of long-lived assets<br />
Long lived assets, such as oil and gas properties, other property, plant, and equipment, and purchased intangibles subject to<br />
amortization, are assessed for impairment whenever events or changes in circumstances indicate that the carrying amount<br />
of an asset group may not be recoverable. Recoverability of assets to be held and used is measured by a comparison of the<br />
carrying amount of an asset group to the estimated undiscounted future cash flows expected to be generated by that group.<br />
If the carrying amount of an asset group exceeds its estimated undiscounted future cash flows, an impairment charge is recognized<br />
by writing down the carrying amount to the estimated fair value of the asset group, generally determined as disco<br />
unted future net cash flows. Assets to be disposed of are separately presented in the balance sheet and reported at the lower<br />
of the carrying amount or fair value less costs to sell, and are no longer depreciated. The assets and liabilities of a disposed<br />
group classified as held for sale are presented separately in the appropriate asset and liability sections of the balance sheet.<br />
Deferred income taxes<br />
Deferred income tax assets and liabilities are recognized in respect of future tax consequences attributable to temporary<br />
differences between the carrying amounts of existing assets and liabilities for the purposes of the consolidated financial<br />
statements and their respective tax bases and in respect of operating loss and tax credit carryforwards. Deferred income<br />
tax assets and liabilities are measured using enacted tax rates expected to apply to taxable income in the years in which<br />
those temporary differences are expected to reverse and the assets be recovered and liabilities settled. The effect on<br />
deferred income tax assets and liabilities of a change in tax rates is recognized in the consolidated statement of income<br />
in the reporting period which includes the enactment date.<br />
The ultimate realization of deferred income tax assets is dependent upon the generation of future taxable income in the<br />
reporting periods in which the originating expenditure becomes deductible. In assessing the realizability of deferred<br />
income tax assets, management considers whether it is more likely than not that the deferred income tax assets will be<br />
realized. In making this assessment, management considers the scheduled reversal of deferred income tax liabilities,<br />
projected future taxable income, and tax planning strategies.<br />
Interest-bearing borrowings<br />
Interest-bearing borrowings are initially recorded at the value of net proceeds received. Any difference between the net<br />
proceeds and the redemption value is amortized at a constant rate over the term of the borrowing. Amortization is included<br />
in the consolidated statement of income each year and the carrying amounts are adjusted as amortization accumulates.<br />
142
If borrowings are repurchased or settled before maturity, any difference between the amount paid and the carrying amount<br />
is recognized in the consolidated statement of income in the period in which the repurchase or settlement occurs.<br />
Pension benefits<br />
The expected costs in respect of pension obligations of Group companies are determined by an independent actuary.<br />
Obligations in respect of each employee are accrued over the reporting periods during which the employee renders<br />
service in the Group.<br />
Treasury stock<br />
Purchases by Group companies of the Company's outstanding stock are recorded at cost and classified as treasury stock<br />
within Stockholders' equity. Shares shown as Authorized and Issued include treasury stock. Shares shown as<br />
Outstanding do not include treasury stock.<br />
Earnings per share<br />
Basic earnings per share is computed by dividing net income available to common stockholders by the weighted-average<br />
number of shares of common stock outstanding during the reporting period. A calculation is carried out to establish<br />
if there is potential dilution in earnings per share if convertible securities were to be converted into shares of common<br />
stock or contracts to issue shares of common stock were to be exercised. If there is such dilution, diluted earnings per<br />
share is presented.<br />
CONSOLIDATED FINANCIAL STATEMENTS<br />
Contingencies<br />
Certain conditions may exist as of the balance sheet date, which may result in losses to the Group but the impact of<br />
which will only be resolved when one or more future events occur or fail to occur.<br />
If a Group company's assessment of a contingency indicates that it is probable that a material loss has been incurred<br />
and the amount of the liability can be estimated, then the estimated liability is accrued and charged to the consolidated<br />
statement of income. If the assessment indicates that a potentially material loss is not probable, but is reasonably<br />
possible, or is probable, but cannot be estimated, then the nature of the contingent liability, together with an estimate of<br />
the range of possible loss, is disclosed in the notes to the consolidated financial statements. Loss contingencies considered<br />
remote or related to unasserted claims are generally not disclosed unless they involve guarantees, in which case<br />
the nature of the guarantee is disclosed.<br />
Environmental expenditures<br />
Estimated losses from environmental remediation obligations are generally recognized no later than completion of<br />
remedial feasibility studies. Group companies accrue for losses associated with environmental remediation obligations<br />
when such losses are probable and reasonably estimable. Such accruals are adjusted as further information becomes<br />
available or circumstances change. Costs of expected future expenditures for environmental remediation obligations are<br />
not discounted to their present value.<br />
Use of derivative instruments<br />
The Group's derivative activity is limited to certain petroleum products marketing and trading outside of its physical<br />
crude oil and petroleum products businesses and hedging of commodity price risks. Currently this activity involves<br />
the use of futures and swaps contracts together with purchase and sale contracts that qualify as derivative instruments.<br />
The Group accounts for these activities under the mark-to-market methodology in which the derivatives are<br />
revalued each accounting period. Resulting realized and unrealized gains or losses are presented in the consolidated<br />
statement of income on a net basis. Unrealized gains and losses are carried as assets or liabilities on the consolidated<br />
balance sheet.<br />
Recent accounting pronouncements<br />
In December 2004, the FASB issued SFAS No. 123(R) "Share-Based Payment", which revises SFAS No. 123 and supersedes<br />
Accounting Principles Board (APB) Opinion No. 25 regarding stock-based employee compensation plans. SFAS No.<br />
123(R) requires all share-based payments to employees, including grants of employee stock options, to be valued at fair<br />
value on the date of grant, and to be expensed over the applicable vesting period. The Group will adopt the provisions of<br />
SFAS No. 123(R) in the first quarter 2006 and is currently assessing the effect of adoption.<br />
In April <strong>2005</strong>, the FASB staff issued FASB Staff Position ("FSP") No. FAS 19-1 "Accounting for Suspended Well Costs".<br />
FSP No. 19-1 amends SFAS No. 19 "Financial Accounting and Reporting by Oil and Gas Producing Companies" to revise<br />
the criteria for continued capitalization of costs in relation to exploratory wells and exploratory-type stratigraphic wells.<br />
As amended, SFAS No. 19 allows continued capitalization of such costs for more than one year, provided (a) the well has<br />
143
FINANCIAL ACCOUNTS<br />
found a sufficient quantity of reserves to justify its completion as a producing well and (b) the company is making<br />
sufficient progress assessing the reserves and the economic and operating viability of the project. If either condition is<br />
not met or if a company obtains information that raises substantial doubt about the economic or operational viability of<br />
the project, the exploratory well would be assumed impaired, and its costs, net of any salvage value, would be charged<br />
to expense. Following adoption of the changes, certain exploration costs which would have been charged to the income<br />
statement will remain capitalized and will instead be subject to depreciation, depletion and amortization in future periods.<br />
FSP No. 19-1 also requires certain additional disclosures in relation to suspended well costs. The adoption of the provisions<br />
of FSP No. 19-1 during <strong>2005</strong> did not have a material impact on the Group's results of operations, financial position<br />
or cash flows.<br />
Cumulative effect of change in accounting principle<br />
Effective January 1, 2003, the Group adopted SFAS No. 143, "Accounting for Asset Retirement Obligations." This accounting<br />
standard applies to legal obligations associated with the retirement of tangible long-lived assets. SFAS No. 143<br />
requires entities to record the fair value of a liability for an asset retirement obligation in the period in which it is incurred<br />
and a corresponding increase in the carrying amount of the related long-lived asset. Subsequently, the liability is accreted<br />
for the passage of time and the related asset is depreciated over its estimated useful life.<br />
Upon adoption of SFAS No. 143, the Group recorded a cumulative-effect adjustment resulting in an increase to net<br />
income of $132 million (net of income tax of $46 million), including the Group's share of the effect of adoption by its equity<br />
affiliates. The effect of adoption also included an increase of net property, plant and equipment of $330 million,<br />
minority interest of $12 million, non-current deferred income tax assets and liabilities of a net $46 million and an increase<br />
in the asset retirement obligation of $140 million.<br />
In March <strong>2005</strong>, the FASB issued FASB Interpretation No. 47, "Accounting for Conditional Asset Retirement Obligations –<br />
an interpretation of FASB Statement No. 143" (FIN 47). This Interpretation clarifies that an entity is required to recognize<br />
a liability for a legal obligation to perform asset retirement activities when the retirement is conditional on a future event<br />
and if the liability's fair value can be reasonably estimated. The adoption of the provisions of FIN 47 in the fourth quarter<br />
of <strong>2005</strong> did not have a material impact on the Group's results of operations, financial position or cash flows.<br />
Comparative amounts<br />
Certain prior period amounts have been reclassified to conform with current period presentation.<br />
NOTE 3. CASH AND CASH EQUIVALENTS<br />
As of December 31, <strong>2005</strong> As of December 31, 2004<br />
Cash held in Russian rubles 346 218<br />
Cash held in other currencies 905 557<br />
Cash of a banking subsidiary in other currencies 102 176<br />
Cash held in affiliated banks in Russian rubles 173 255<br />
Cash held in affiliated banks in other currencies 124 51<br />
Total cash and cash equivalents 1,650 1,257<br />
NOTE 4. NON-CASH TRANSACTIONS<br />
The consolidated statement of cash flows excludes the effect of non-cash transactions, which are described in the<br />
following table:<br />
Year ended<br />
December 31, <strong>2005</strong><br />
Year ended<br />
December 31, 2004<br />
Year ended<br />
December 31, 2003<br />
Non-cash investing activity 133 123 64<br />
Settlement of bond liability with<br />
the Company's common stock 300 - 395<br />
Total non-cash transactions 433 123 459<br />
144
The following table shows the effect of non-cash transactions on investing activity:<br />
NOTE 5. ACCOUNTS AND NOTES RECEIVABLE, NET<br />
Year ended<br />
December 31, <strong>2005</strong><br />
Year ended<br />
December 31, 2004<br />
As of<br />
December 31, <strong>2005</strong><br />
Year ended<br />
December 31, 2003<br />
Net cash used in investing activity 6,225 3,741 2,792<br />
Non-cash investing activity 133 123 64<br />
Total investing activity 6,358 3,864 2,856<br />
As of<br />
December 31, 2004<br />
CONSOLIDATED FINANCIAL STATEMENTS<br />
Trade accounts and notes receivable (net of provisions<br />
of $80 million and $85 million as of December 31, <strong>2005</strong><br />
and 2004, respectively) 3,410 2,316<br />
Current VAT and excise recoverable 1,772 1,302<br />
Short-term loans receivable of a banking subsidiary 48 25<br />
Other current accounts receivable (net of provisions<br />
of $46 million and $66 million as of December 31, <strong>2005</strong><br />
and 2004, respectively) 303 224<br />
Total accounts and notes receivable 5,533 3,867<br />
NOTE 6. INVENTORIES<br />
As of<br />
December 31, <strong>2005</strong><br />
As of<br />
December 31, 2004<br />
Crude oil and petroleum products 1,975 1,310<br />
Materials for extraction and drilling 250 162<br />
Materials and supplies for refining 29 49<br />
Other goods, materials and supplies 365 238<br />
Total inventories 2,619 1,759<br />
NOTE 7. INVESTMENTS<br />
As of<br />
December 31, <strong>2005</strong><br />
As of<br />
December 31, 2004<br />
Investments in equity method affiliates and joint ventures 934 559<br />
Long-term loans given by non-banking subsidiaries 165 197<br />
Other long-term investments 11 23<br />
Total long-term investments 1,110 779<br />
145
FINANCIAL ACCOUNTS<br />
Investments in "equity method" affiliates and joint ventures<br />
The summarized financial information below is in respect of equity method affiliates and corporate joint ventures. The<br />
companies are primarily engaged in crude oil exploration, production, marketing, refining and distribution operations in the<br />
Russian Federation and crude oil production and marketing in Kazakhstan.<br />
Year ended<br />
December 31, <strong>2005</strong><br />
Total<br />
Group's<br />
share<br />
Year ended<br />
December 31, 2004<br />
Total<br />
Group's<br />
share<br />
Year ended<br />
December 31, 2003<br />
Total<br />
Group's<br />
share<br />
Revenues 2,972 1,383 2,885 1,313 1,676 757<br />
Income before income taxes 1,214 605 761 392 444 235<br />
Less income taxes (338) (164) (362) (179) (106) (54)<br />
Net income 876 441 399 213 338 181<br />
As of December 31, <strong>2005</strong> As of December 31, 2004<br />
Total Group's share Total Group's share<br />
Current assets 2,650 859 2,727 832<br />
Property, plant and equipment 2,171 1,129 2,073 1,081<br />
Other non-current assets 71 32 457 77<br />
Total assets 4,892 2,020 5,257 1,990<br />
Short-term debt 1,599 347 1,803 396<br />
Other current liabilities 590 249 692 320<br />
Long-term debt 904 487 1,455 705<br />
Other non-current liabilities 6 3 23 10<br />
Net assets 1,793 934 1,284 559<br />
NOTE 8. PROPERTY, PLANT AND EQUIPMENT AND ASSET RETIREMENT OBLIGATIONS<br />
As of December<br />
31, <strong>2005</strong><br />
At cost<br />
As of December<br />
31, 2004<br />
As of December<br />
31, <strong>2005</strong><br />
Net<br />
As of December<br />
31, 2004<br />
Exploration and Production:<br />
Western Siberia 14,237 13,421 6,669 6,063<br />
European Russia 13,245 11,237 8,122 6,434<br />
International 4,527 1,459 4,150 1,305<br />
Total 32,009 26,117 18,941 13,802<br />
Refining, Marketing, Distribution and Chemicals:<br />
Western Siberia 27 28 22 23<br />
European Russia 6,374 5,765 3,921 3,489<br />
International 3,537 2,824 2,254 1,734<br />
Total 9,938 8,617 6,197 5,246<br />
Other:<br />
Western Siberia 159 154 78 77<br />
European Russia 215 195 190 158<br />
International 73 62 58 46<br />
Total 447 411 326 281<br />
Total property, plant and equipment 42,394 35,145 25,464 19,329<br />
146
As described in Note 2, effective January 1, 2003, the Group adopted SFAS No. 143 and began recording asset<br />
retirement obligations for estimated dismantlement, abandonment and restoration costs of property, plant and equipment<br />
in which a legal obligation exists. In accordance with SFAS No. 143, property, plant and equipment listed above include<br />
asset retirement costs associated with these asset retirement obligations.<br />
As of December 31, <strong>2005</strong> and 2004, the asset retirement obligation amounted to $397 million and $317 million, respectively,<br />
of which $10 million was included in "Other current liabilities" in the consolidated balance sheets as of each<br />
balance sheet date. During <strong>2005</strong> and 2004, asset retirement obligations changed as follows:<br />
<strong>2005</strong> 2004<br />
Asset retirement obligations as of January 1 317 221<br />
Accretion expense 30 8<br />
New obligations and changes in estimates of existing obligations 66 88<br />
Spending on existing obligations (7) (8)<br />
CONSOLIDATED FINANCIAL STATEMENTS<br />
Property dispositions (4) (7)<br />
Foreign currency translation and other adjustments (5) 15<br />
Asset retirement obligations as of December 31 397 317<br />
NOTE 9. GOODWILL AND OTHER INTANGIBLE ASSETS<br />
The carrying value of goodwill and other intangible assets as of December 31, <strong>2005</strong> and 2004 was as follows:<br />
As of<br />
December 31, <strong>2005</strong><br />
As of<br />
December 31, 2004<br />
Amortized intangible assets<br />
Software 205 127<br />
Licenses and other assets 58 66<br />
Goodwill 417 417<br />
Total goodwill and other intangible assets 680 610<br />
All goodwill amounts relate to the refining, marketing and distribution segment.<br />
NOTE 10. DISPOSITIONS OF SUBSIDIARIES AND ASSETS<br />
In December <strong>2005</strong>, the Company made a decision to sell ten tankers. A Group company finalized the sale of eight<br />
tankers for a price that approximates the carrying value of $190 million in May 2006. As of December 31, <strong>2005</strong>,<br />
the Group classified these tankers as assets held for sale in the consolidated balance sheet. The sale of the<br />
remaining two tankers is expected to be finalized by July 2007. The Group will use these tankers until that date<br />
and they continue to be accounted for as property, plant and equipment. These tankers are included in the<br />
"Refining, marketing and distribution" operating segment and "European Russia" geographical segment in Note 23<br />
"Segment information."<br />
In November, 2004, the Company entered into a contract to sell its 100% interest in OOO LUKOIL-Burenie and its<br />
subsidiaries ("LUKOIL-Burenie") for $69 million. The terms of the contract required signing a five-year contract for drilling<br />
services (refer to Note 20 "Commitments and contingencies") to be provided to the Group and revising the terms of Group<br />
financing previously provided to LUKOIL-Burenie. The transaction was completed at the end of December 2004. The<br />
Group recognized an impairment loss of $70 million in relation to this transaction during 2004.<br />
In August 2004, the Company entered into contracts to sell its 99% ownership interest in OAO Bank Petrocommerce<br />
(the "Bank") for $214 million to a group of companies of a related party, whose management and directors include<br />
147
FINANCIAL ACCOUNTS<br />
members of the Group's management and Board of Directors. The Company used an independent valuation in the determination<br />
of the selling price. The transaction was structured to be completed in two phases. The first phase, representing<br />
the sale of 78% of the Group's ownership interest for $169 million was completed on September 22, 2004. The<br />
second phase, in which the Group was to sell its remaining 21% ownership interest in the Bank for $45 million, was<br />
expected to be completed by the end of June 2007. The Group recognized an impairment loss of $35 million in relation<br />
to this transaction during 2004. In December <strong>2005</strong> the Group and the buyer cancelled the contract related to the second<br />
phase. Subsequently, in December <strong>2005</strong>, the Group made a public auction for the sale of its remaining 21% ownership<br />
interest in the Bank and entered into a contract with the bidder, the same related party, at a selling price of $33 million.<br />
This transaction is expected to be completed by the end of June 2006. The Group recognized an additional impairment<br />
loss of $12 million during <strong>2005</strong>.<br />
As of December 31, <strong>2005</strong> the carrying value of the Group's investment in the Bank is $33 million and is included in<br />
"Investments" in the consolidated balance sheet.<br />
In April 2003 a Group company completed the sale of its 10% interest in the production sharing agreement operated by<br />
the Azerbaijan International Operating Company for net $1,337 million cash, resulting in the recognition of a net gain of<br />
$1,130 million during 2003. This gain is included in the "Exploration and production" operating segment and "International"<br />
geographical segment in Note 23 "Segment information."<br />
NOTE 11. SHORT-TERM BORROWINGS AND CURRENT PORTION OF LONG-TERM DEBT<br />
As of<br />
December 31, <strong>2005</strong><br />
As of<br />
December 31, 2004<br />
Short-term borrowings from third parties 315 875<br />
Short-term borrowings from related parties 1 18<br />
Current portion of long-term debt 537 372<br />
Total short-term borrowings and current portion of long-term debt 853 1,265<br />
Short-term borrowings are primarily payable in US dollars and are unsecured. The weighted-average interest rate on shortterm<br />
borrowings from third parties was 5.6% and 5.0% per annum as of December 31, <strong>2005</strong> and 2004, respectively.<br />
NOTE 12. LONG-TERM DEBT<br />
As of<br />
December 31, <strong>2005</strong><br />
As of<br />
December 31, 2004<br />
Long-term loans and borrowings from third parties (including loans<br />
from banks in the amount of $4,107 million and $1,878 million<br />
as of December 31, <strong>2005</strong> and 2004, respectively) 4,233 2,276<br />
Long-term loans and borrowings from related parties 65 14<br />
3.5% Convertible US dollar bonds, maturing 2007 94 380<br />
7.25% Russian ruble bonds, maturing 2008 208 216<br />
Capital lease obligation 74 95<br />
Total long-term debt 4,674 2,981<br />
Current portion of long-term debt (537) (372)<br />
Total non-current portion of long-term debt 4,137 2,609<br />
148
Long-term loans and borrowings<br />
Long-term loans and borrowings are primarily repayable in US dollars, maturing from 2006 through 2017. About one third of<br />
this debt is secured by export sales and property, plant and equipment. The weighted-average interest rate on long-term<br />
loans and borrowings from third parties was 5.8% and 5.6% per annum as of December 31, <strong>2005</strong> and 2004, respectively.<br />
A Group company has an unsecured syndicated loan agreement, arranged by Citibank, ABN AMRO Bank, BNP Paribas,<br />
Sumitomo Banking Corporation and Societe Generale with an outstanding amount of $1,934 million as of December 31,<br />
<strong>2005</strong>, maturing in 2008. Borrowings under this agreement bear interest at LIBOR plus 0.7% per annum. This loan facility<br />
was used for financing the acquisition of Nelson Resources Limited ("Nelson") (refer to Note 17 "Business combinations").<br />
The Company has a secured syndicated loan agreement, arranged by ABN AMRO Bank and Citibank, with an outstanding<br />
amount of $715 million as of December 31, <strong>2005</strong>. Borrowings of $429 million under this agreement bear interest at<br />
LIBOR plus 1.35% per annum and have maturity dates up to 2008. The balance of $286 million bears interest at LIBOR<br />
plus 2.5% per annum and has maturity dates up to 2010.<br />
A Group company has an unsecured syndicated loan agreement with CALYON and ABN AMRO with an outstanding<br />
amount of $251 million as of December 31, <strong>2005</strong>. Borrowings under this agreement bear interest at LIBOR plus 1.2%<br />
per annum and have maturity dates up to 2010.<br />
A Group company has a secured loan agreement, arranged by Credit Swiss First Boston, with an outstanding amount of<br />
$222 million as of December 31, <strong>2005</strong>. Borrowings under this agreement bear interest at LIBOR plus 4.8% per annum<br />
and have maturity dates up to 2015.<br />
A Group company has a number of loan agreements with Natexis bank with a total outstanding amount of $211 million<br />
as of December 31, <strong>2005</strong>. These agreements have maturity dates up to 2009. Borrowings under these agreements bear<br />
interest at a range from LIBOR plus 0.9% to LIBOR plus 2.5% per annum.<br />
A Group company has a loan agreement with Vnesheconombank with an outstanding amount of $129 million as of<br />
December 31, <strong>2005</strong>. Borrowings under this agreement bear interest at a fixed rate of 3% per annum and have maturity<br />
dates up to 2011.<br />
A Group company has a loan agreement with the European Bank of Reconstruction and Development with an outstanding<br />
amount of $125 million as of December 31, <strong>2005</strong>. Borrowings under this agreement bear interest at LIBOR plus 3.0%<br />
per annum and have maturity dates up to 2008.<br />
A Group company has a number of loan agreements with International Finance Corporation with a total outstanding<br />
amount of $109 million as of December 31, <strong>2005</strong>. These agreements have maturity dates up to 2011. Borrowings under<br />
these agreements bear interest at a range from LIBOR plus 2.0% to LIBOR plus 2.5% per annum.<br />
As of December 31, <strong>2005</strong> the Group has a number of other fixed rate loan agreements with a number of banks and organizations<br />
totaling $299 million, maturing from 2006 to 2017. The weighted average interest rate under these loans was<br />
5.6% per annum.<br />
As of December 31, <strong>2005</strong> the Group has a number of floating rate loan agreements with a number of banks and organizations<br />
totaling $238 million, maturing from 2006 to 2015. The weighted average interest rate under these loans was<br />
7.1% per annum.<br />
A Group company has a loan agreement with ConocoPhillips, the Group's related party, with outstanding amount of<br />
$61 million as of December 31, <strong>2005</strong>. Borrowings under this agreement bear interest at a fixed rate of 10% per annum<br />
and have maturity dates up to 2017. This agreement is a part of the Company's broad-based strategic alliance with<br />
ConocoPhillips and this financing is used to develop the distribution infrastructure in the Timan-Pechora region of the<br />
Russian Federation.<br />
CONSOLIDATED FINANCIAL STATEMENTS<br />
Convertible US dollar bonds<br />
On November 29, 2002, a Group company issued 350,000 3.5% convertible bonds with a face value of $1,000 each,<br />
maturing on November 29, 2007, and exchangeable for 12.112 (previously 11.948) global depository receipts ("GDRs") of<br />
the Company per bond. The bonds are convertible into GDRs on or after January 9, 2003 up to the maturity dates. The<br />
GDRs are exchangeable into four shares of common stock of the Company. Bonds not converted by the maturity date<br />
must be redeemed for cash. The redemption price at maturity will be 120.53% of the face value in respect of these<br />
bonds. A Group company may redeem the bonds for cash prior to maturity, subject to certain restrictions and early<br />
redemption charges. The carrying amount of the bonds is being accreted to their redemption value with the accreted<br />
amount being charged to the consolidated statement of income.<br />
As of December 31, <strong>2005</strong>, bondholders had converted 266,821 bonds into 12.9 million shares of common stock of the<br />
Company. Subsequent to year end, as of May 15, 2006, bondholders had converted an additional 28,295 bonds into<br />
1.4 million shares of common stock of the Company.<br />
Group companies held sufficient treasury stock to permit the full conversion of the bonds to GDRs.<br />
149
FINANCIAL ACCOUNTS<br />
Russian ruble bonds<br />
In November 2004, the Company issued 6 million Russian ruble bonds with a nominal value of 1,000 Russian rubles each,<br />
maturing on November 23, 2009. For a period of 7 days commencing on November 13, 2007 the bonds holders have the<br />
right to demand the Company repurchase the bonds. The bonds have a half year coupon period and bear interest at<br />
7.25% per annum.<br />
Maturities of long-term debt<br />
Annual maturities of total long-term debt during the next five years, including the portion classified as current, are<br />
$537 million in 2006, $600 million in 2007, $2,414 million in 2008, $467 million in 2009, $346 million in 2010 and<br />
$310 million thereafter.<br />
NOTE 13. TAXES<br />
The Group is taxable in a number of jurisdictions within and outside of the Russian Federation and, as a result, is subject<br />
to a variety of taxes as established under the statutory provisions of each jurisdiction.<br />
The total cost of taxation to the Group is reported in the consolidated statement of income as "Total income tax expense"<br />
for income taxes, as "Excise and export tariffs" for excise taxes, export tariffs and petroleum products sales taxes and as<br />
"Taxes other than income taxes" for other types of taxation. In each category taxation is made up of taxes levied at<br />
various rates in different jurisdictions.<br />
Operations in the Russian Federation are subject to Federal and city tax rates that total 9.5% and a regional tax rate that<br />
varies from 10.5% to 14.5% at the discretion of the individual regional administration. The majority of the Group's operations<br />
in Russia were subject to a combined statutory tax rate of 24%.<br />
There are not currently, and have not been during the three years ended December 31, <strong>2005</strong>, any provisions in the<br />
taxation legislation of the Russian Federation to permit the Group to reduce taxable profits in a Group company by<br />
offsetting tax losses in another Group company against such profits. Tax losses of a Group company in the Russian<br />
Federation may, however, be used fully or partially to offset taxable profits in the same company in any of the ten years<br />
following the year of loss, subject to the restriction that no more than 50% of the taxable profit in 2006 can be reduced<br />
by loss relief. Starting from January 1, 2007 this restriction will no longer apply.<br />
Domestic and foreign components of income before income taxes were:<br />
Year ended<br />
December 31, <strong>2005</strong><br />
Year ended<br />
December 31, 2004<br />
Year ended<br />
December 31, 2003<br />
Domestic 7,992 5,167 3,298<br />
Foreign 918 841 1,278<br />
Income before income taxes 8,910 6,008 4,576<br />
Domestic and foreign components of income taxes were:<br />
Year ended<br />
December 31, <strong>2005</strong><br />
Year ended<br />
December 31, 2004<br />
Year ended<br />
December 31, 2003<br />
Current<br />
Domestic 2,194 1,511 883<br />
Foreign 107 103 56<br />
Current income tax expense 2,301 1,614 939<br />
Deferred<br />
Domestic 61 76 49<br />
Foreign 105 70 19<br />
Deferred income tax expense 166 146 68<br />
Total income tax expense 2,467 1,760 1,007<br />
150
The following table is a reconciliation of the amount of income tax expense that would result from applying the Russian<br />
statutory tax rate to income before income taxes to total income taxes:<br />
Year ended<br />
December 31, <strong>2005</strong><br />
Year ended<br />
December 31, 2004<br />
Year ended<br />
December 31, 2003<br />
Income before income taxes 8,910 6,008 4,576<br />
Notional income tax at Russian statutory<br />
rates 2,138 1,442 1,098<br />
Increase (reduction) in income tax due to:<br />
Non-deductible items, net 407 301 168<br />
Foreign rate differences (12) 4 (11)<br />
Domestic rate differences (125) (23) (7)<br />
Non-taxable gain on sale of interest in<br />
Azeri Chirag Guneshli - - (271)<br />
Foreign currency effect (5) 6 3<br />
Change in valuation allowance 64 30 (1)<br />
Other - - 28<br />
CONSOLIDATED FINANCIAL STATEMENTS<br />
Total income tax expense 2,467 1,760 1,007<br />
Taxes other than income taxes were:<br />
Year ended<br />
December 31, <strong>2005</strong><br />
Year ended<br />
December 31, 2004<br />
Year ended<br />
December 31, 2003<br />
Mineral extraction tax 5,590 2,971 1,966<br />
Social taxes and contributions 324 330 257<br />
Property tax 233 111 139<br />
Other taxes and contributions 187 93 94<br />
Taxes other than income taxes 6,334 3,505 2,456<br />
Deferred income taxes are included in the consolidated balance sheets as follows:<br />
As of<br />
December 31, <strong>2005</strong><br />
As of<br />
December 31, 2004<br />
Other current assets 52 69<br />
Deferred income tax assets – non-current 181 138<br />
Other current liabilities (18) (16)<br />
Deferred income tax liabilities – non-current (1,830) (698)<br />
Net deferred income tax liability (1,615) (507)<br />
151
FINANCIAL ACCOUNTS<br />
The following table sets out the tax effects of each type of temporary differences which give rise to deferred income tax<br />
assets and liabilities:<br />
As of<br />
December 31, <strong>2005</strong><br />
As of<br />
December 31, 2004<br />
Accounts receivable 15 18<br />
Long-term liabilities 145 111<br />
Inventories 5 29<br />
Property, plant and equipment 131 115<br />
Accounts payable 27 19<br />
Long-term investments 3 5<br />
Operating loss carry forwards 121 131<br />
Other 69 51<br />
Total gross deferred income tax assets 516 479<br />
Less valuation allowance (134) (70)<br />
Deferred income tax assets 382 409<br />
Property, plant and equipment (1,747) (714)<br />
Accounts payable (8) (5)<br />
Accounts receivable (9) (8)<br />
Long-term liabilities (117) (72)<br />
Inventories (30) (17)<br />
Long-term investments (66) (83)<br />
Other (20) (17)<br />
Deferred income tax liabilities (1,997) (916)<br />
Net deferred income tax liability (1,615) (507)<br />
As a result of business combinations, during <strong>2005</strong> the Group recognised a net deferred tax liability of $923 million.<br />
As of December 31, <strong>2005</strong>, retained earnings of foreign subsidiaries included $7,066 million for which deferred taxation<br />
has not been provided because remittance of the earnings has been indefinitely postponed through reinvestment and,<br />
as a result, such amounts are considered to be permanently invested. The amount of deferred tax liability on this amount<br />
is not practicable to calculate.<br />
In accordance with SFAS No. 52 "Foreign currency translation" and SFAS No. 109, "Accounting for Income Taxes," deferred<br />
tax assets and liabilities are not recognized for exchange rate effects resulting from the translation of transactions and<br />
balances from the Russian ruble to the US dollar using historical exchange rates. Also, in accordance with SFAS No. 109,<br />
no deferred tax assets or liabilities are recognized for the effects of the related statutory indexation of property, plant and<br />
equipment.<br />
Based upon the level of historical taxable income and projections for future taxable income over the periods in which the<br />
deferred income tax assets are deductible, management believes it is more likely than not that Group companies will<br />
realize the benefits of the deductible temporary differences and loss carry forwards, net of existing valuation allowances<br />
as of December 31, <strong>2005</strong> and 2004.<br />
As of December 31, <strong>2005</strong>, the Group had operating loss carry forwards of $475 million of which $1 million expire during<br />
2010, $36 million expire during 2013, $38 million expire during 2014, $21 million expire during 2015, and $379 million<br />
have indefinite carry forward.<br />
152
NOTE 14. PENSION BENEFITS<br />
The Company sponsors a post employment and post retirement benefits program. The primary component of the post<br />
employment and postretirement benefits program is a defined benefit pension plan that covers the majority of the<br />
Group's employees. This plan is administered by a non-state pension fund, LUKOIL-GARANT, and provides pension<br />
benefits primarily based on years of service and final remuneration levels. The Company also provides several long-term<br />
employee benefits such as death-in-service benefit and lump-sum payments upon retirement of a defined benefit nature<br />
and other defined benefits to certain old age and disabled pensioners who have not vested any pensions under the<br />
pension plan.<br />
In December 2003, the Company took the decision to replace its existing pension plan with a new plan. The new plan<br />
primarily consists of a defined benefit plan enabling employees to contribute a portion of their salary to the plan and at<br />
retirement to receive a lump sum amount from the Company equal to all past contributions made by the employee up to<br />
7% of their annual salary. Employees also have the right to receive upon retirement the benefits accumulated under the<br />
previous pension plan. These benefits have been fixed and included in the benefit obligation as of December 31, <strong>2005</strong> and<br />
2004. The amount was determined primarily based on a formula including past pensionable service and relative salaries as<br />
of December 31, 2003. The Company recorded a gain of $53 million during 2003 as a result of this curtailment.<br />
The Company uses December 31 as the measurement date for its post employment and post retirement benefits<br />
program. An independent actuary has assessed the benefit obligations as of December 31, <strong>2005</strong> and 2004.<br />
The following table provides information about the benefit obligations, plan assets and actuarial assumptions used as of<br />
December 31, <strong>2005</strong> and 2004. The benefit obligations below represent the projected benefit obligation of the pension plan.<br />
CONSOLIDATED FINANCIAL STATEMENTS<br />
<strong>2005</strong> 2004<br />
Benefit obligations<br />
Benefit obligations as of January 1 198 156<br />
Effect of exchange rate changes (8) 11<br />
Service cost 9 7<br />
Interest cost 17 14<br />
Plan amendments 4 7<br />
Actuarial loss 2 29<br />
Benefits paid (20) (12)<br />
Curtailment gain - (14)<br />
Benefit obligations as of December 31 202 198<br />
Plan assets<br />
Fair value of plan assets as of January 1 63 55<br />
Effect of exchange rate changes (3) 4<br />
Return on plan assets 9 8<br />
Employer contributions 24 14<br />
Benefits paid (20) (12)<br />
Assets transferred as a result of settlement - (6)<br />
Fair value of plan assets as of December 31 73 63<br />
Funded status (129) (135)<br />
Unamortized prior service cost 53 54<br />
Unrecognized actuarial gain (45) (47)<br />
Net amount recognized (121) (128)<br />
Amounts recorded in the consolidated balance sheets were:<br />
Accrued benefit liabilities included in "Other long-term liabilities" (121) (128)<br />
Assumptions:<br />
Discount rate 9.2% 9.2%<br />
Expected return on plan assets 10.0% 10.0%<br />
153
FINANCIAL ACCOUNTS<br />
The real returns on bonds and equities are based on what is observed in the international markets over extended<br />
periods of time. In the calculation of the expected return on assets no use is made of the historical returns<br />
LUKOIL-GARANT has achieved.<br />
In addition to the plan assets, LUKOIL-GARANT holds assets in the form of an insurance reserve. The purpose of this<br />
insurance reserve is to satisfy pension obligations should the plan assets not be sufficient to meet pension obligations.<br />
The Group's contributions to the pension plan are determined without considering the assets in the insurance reserve.<br />
The plans are funded on a discretionary basis through a solidarity account, which is held in trust with LUKOIL-GARANT.<br />
LUKOIL-GARANT does not allocate separately identifiable assets to the Group or its other third party clients. All funds of<br />
plan assets and other individual pension accounts are managed as a pool of investments.<br />
The asset allocation of the investment portfolio maintained by LUKOIL-GARANT for the Group and its clients was as<br />
follows:<br />
Type of assets<br />
As of<br />
December 31, <strong>2005</strong><br />
As of<br />
December 31, 2004<br />
Promissory notes of Russian issuers 30% 6%<br />
Russian corporate bonds 20% 23%<br />
Bank deposits 16% 8%<br />
Equity securities of Russian issuers 10% 19%<br />
Russian state bonds 9% -<br />
Shares of OAO LUKOIL 5% 8%<br />
Shares in investment funds 5% -<br />
Russian municipal bonds 3% 6%<br />
Accounts receivable from investment companies - 28%<br />
Other assets 2% 2%<br />
100% 100%<br />
The investment strategy employed by LUKOIL-GARANT includes an overall goal to attain a maximum investment return,<br />
while guaranteeing the principal amount invested. The strategy is to invest with a medium-term perspective while<br />
maintaining a level of liquidity through proper allocation of investment assets. Investment policies include rules and<br />
limitations to avoid concentrations of investments.<br />
The investment portfolio is primarily comprised of two types of investments: securities with fixed yield and equity<br />
securities. The securities with fixed yield include mainly high yield corporate bonds and promissory notes of banks with<br />
low and medium risk ratings. Maturities range from one to three years.<br />
The following table details the targeted investment mix for 2006 and the maximum limits on investment type.<br />
Type of investment<br />
2006 Target<br />
Allocation<br />
Maximum Allocation Allowed<br />
Russian corporate bonds 31% 50%<br />
Promissory notes of Russian issuers 5% 50%<br />
Equity securities of Russian issuers 28% 50%<br />
Russian municipal bonds 31% 50%<br />
Other, including bank deposits 5% 50%<br />
100%<br />
154
Components of net periodic benefit cost were as follows:<br />
Year ended<br />
December 31, <strong>2005</strong><br />
Year ended<br />
December 31, 2004<br />
Year ended<br />
December 31, 2003<br />
Service cost 9 7 5<br />
Interest cost 17 14 34<br />
Less expected return on plan assets (6) (5) (7)<br />
Amortization of prior service cost 5 5 19<br />
Actuarial gain (3) (5) (4)<br />
Curtailment gain - (8) (53)<br />
CONSOLIDATED FINANCIAL STATEMENTS<br />
Total net periodic benefit cost (income) 22 8 (6)<br />
Total employer contributions for 2006 are expected to be $18 million.<br />
The following benefit payments, which reflect expected future services, as appropriate, are expected to be paid:<br />
2006 2007 2008 2009 2010<br />
5-year period<br />
2006-2010<br />
5-year period<br />
2011-2015<br />
Pension benefits 23 9 12 12 13 69 54<br />
Other long-term<br />
employee benefits 15 9 10 11 11 56 62<br />
Total expected<br />
benefits to be paid 38 18 22 23 24 125 116<br />
NOTE 15. STOCKHOLDERS' EQUITY<br />
Common stock<br />
As of<br />
December 31, <strong>2005</strong><br />
(millions of shares)<br />
As of<br />
December 31, 2004<br />
(millions of shares)<br />
Authorized and issued common stock, par value of 0.025<br />
Russian rubles each 850 850<br />
Common stock held by subsidiaries, not considered as outstanding<br />
(2) (5)<br />
Treasury stock (22) (34)<br />
Outstanding common stock 826 811<br />
Dividends and dividend limitations<br />
Profits available for distribution to common stockholders in respect of any reporting period are determined by reference<br />
to the statutory financial statements of the Company prepared in accordance with the laws of the Russian Federation and<br />
denominated in Russian rubles. Under Russian Law, dividends are limited to the net profits of the reporting year as set<br />
out in the statutory financial statements of the Company. These laws and other legislative acts governing the rights of<br />
shareholders to receive dividends are subject to various interpretations.<br />
155
FINANCIAL ACCOUNTS<br />
The Company's net profits were 66,327 million Russian rubles, 78,028 million Russian rubles and 48,042 million Russian<br />
rubles, respectively for <strong>2005</strong>, 2004 and 2003, pursuant to the statutory financial statements, which at the US dollar<br />
exchange rates as of December 31, <strong>2005</strong>, 2004 and 2003 amounted to $2,304 million, $2,812 million and $1,631 million,<br />
respectively.<br />
At the annual stockholders' meeting on June 28, <strong>2005</strong>, dividends were declared for 2004 in the amount of 28.00 Russian<br />
rubles per common share, which at the date of the decision was equivalent to $0.98.<br />
At the annual stockholders' meeting on June 24, 2004, dividends were declared for 2003 in the amount of 24.00 Russian<br />
rubles per common share, which at the date of the meeting was equivalent to $0.83.<br />
At the annual stockholders' meeting on June 26, 2003, dividends were declared for 2002 in the amount of 19.50 Russian<br />
rubles per common share, which at the date of the decision was equivalent to $0.64.<br />
Earnings per share<br />
The calculation of diluted earnings per share for these years was as follows:<br />
Year ended<br />
December 31, <strong>2005</strong><br />
Year ended<br />
December 31, 2004<br />
Year ended<br />
December 31, 2003<br />
Income before cumulative effect of change<br />
in accounting principle 6,443 4,248 3,569<br />
Cumulative effect of change in accounting<br />
principle - - 132<br />
Net income 6,443 4,248 3,701<br />
Add back convertible debt interest<br />
(net of tax at effective rate)<br />
1% Convertible US dollar bonds,<br />
maturing 2003 - - 13<br />
3.5% Convertible US dollar bonds,<br />
maturing 2007 26 27 27<br />
Total diluted income before cumulative<br />
effect of change in accounting principle 6,469 4,275 3,609<br />
Total diluted net income 6,469 4,275 3,741<br />
Weighted average number of outstanding<br />
common shares (thousands of shares) 814,417 817,294 819,169<br />
Add back treasury shares held in respect of<br />
convertible debt (thousands of shares) 15,957 16,847 20,977<br />
Weighted average number of outstanding<br />
common shares, after dilution<br />
(thousands of shares) 830,374 834,141 840,146<br />
NOTE 16. FINANCIAL AND DERIVATIVE INSTRUMENTS<br />
Commodity derivative instruments<br />
The Group uses derivative instruments in its international petroleum products marketing and trading operations. The<br />
types of derivative instruments used include futures and swap contracts, used for hedging purposes, and purchase<br />
and sale contracts that qualify as derivative instruments. The Group maintains a system of controls over these activities<br />
that includes policies covering the authorization, reporting and monitoring of derivative activity. The Group recognized<br />
an expense from the use of derivative instruments of $171 million, $55 million and $37 million during <strong>2005</strong>, 2004<br />
and 2003, respectively. The expense is included in "Cost of purchased crude oil, petroleum and chemical products" in<br />
the consolidated statements of income. The fair value of derivative contracts outstanding and recorded on the consolidated<br />
balance sheets was a net liability of $26 million and a net asset of $28 million as of December 31, <strong>2005</strong> and<br />
2004, respectively.<br />
156
Fair value<br />
The fair values of cash and cash equivalents, current accounts and notes receivable, and liquid securities are approximately<br />
equal to their value as disclosed in the consolidated financial statements.<br />
The fair value of long-term receivables included in other non-current assets approximates the amounts disclosed in the<br />
consolidated financial statements as a result of discounting using estimated market interest rates for similar financing<br />
arrangements. The fair value of long-term debt differs from the amount disclosed in the consolidated financial statements.<br />
The estimated fair value of long-term debt as of December 31, <strong>2005</strong> and 2004 was $5,081 million and $3,124 million,<br />
respectively, as a result of discounting using estimated market interest rates for similar financing arrangements.<br />
These amounts include all future cash outflows associated with the long-term debt repayments, including the current<br />
portion, and interest.<br />
NOTE 17. BUSINESS COMBINATIONS<br />
During the period from November to December <strong>2005</strong>, a Group company acquired 51% of the share capital of<br />
OAO Primorieneftegaz for $261 million. OAO Primorieneftegaz is a Russian oil and gas exploration company operating in<br />
the European Russia.<br />
During the period from October 14 to December 5, <strong>2005</strong>, a Group company acquired 100% of the share capital of Nelson<br />
for $1,951 million. Nelson is an exploration and production company operating in western Kazakhstan. Nelson owns an<br />
effective 76% interest in the Karakuduk field, 50% interest in Alibekmola, Kozhasai, North Buzachi and Arman fields. In<br />
addition, Nelson holds an option to acquire a 25% interest in two exploration blocks in the Kazakhstan sector of the<br />
Caspian Sea – South Zhambai and South Zaburunye. The purpose of the acquisition was to increase the Group's<br />
presence in the Kazakhstan oil and gas sector and its international oil and gas reserves.<br />
Nelson's results of operations are included in the Group's consolidated statement of income from October 14, <strong>2005</strong>.<br />
The following table summarizes the estimated fair value of the assets acquired and liabilities assumed at the date of<br />
acquisition.<br />
CONSOLIDATED FINANCIAL STATEMENTS<br />
Current assets 170<br />
Property, plant and equipment 2,794<br />
Other non-current assets 55<br />
Total assets acquired 3,019<br />
Current liabilities (166)<br />
Non-current deferred tax liabilities (769)<br />
Long-term debt (87)<br />
Minority interest (31)<br />
Other non-current liabilities (15)<br />
Total liabilities assumed (1,068)<br />
Net assets acquired 1,951<br />
In November <strong>2005</strong>, a Group company acquired the remaining 50% of the share capital of ZAO SeverTEK for $318 million<br />
from Neste Oil Corporation (including $98 million repayment of ZAO SeverTEK debt). The acquisition increased the<br />
Group's ownership stake in ZAO SeverTEK to 100%. ZAO SeverTEK is an exploration and production company operating<br />
within the Komi Republic of the Russian Federation.<br />
In July <strong>2005</strong>, a Group company acquired 66.0% of the share capital of OOO Geoilbent for $180 million. OOO Geoilbent<br />
is an exploration and production company operating in the West Siberian region of the Russian Federation. All decisions<br />
over OOO Geoilbent's financing and operating activities require approval by at least a 66.7% majority of the voting rights.<br />
Because the minority shareholder of OOO Geoilbent holds substantive participating rights, the Group accounts for its<br />
investment in OOO Geoilbent using the equity method of accounting.<br />
In March <strong>2005</strong>, a Group company acquired a 100% interest in Oy Teboil Ab and Suomen Petrooli Oy for $160 million.<br />
Oy Teboil Ab and Suomen Petrooli Oy are marketing and distribution companies mainly engaged in operating a chain of<br />
retail petrol stations, wholesale of refined products and production and sale of lubricants in Finland.<br />
157
FINANCIAL ACCOUNTS<br />
In January <strong>2005</strong>, a Group company acquired an additional 22% interest in LUKOIL Neftochim Bourgas AD for $56 million<br />
(20.7% interest was acquired from a related party for $52 million). The acquisition increased the Group's ownership stake<br />
in LUKOIL Neftochim Bourgas AD to 93.2%. In August <strong>2005</strong>, a Group company acquired an additional 4% interest in<br />
LUKOIL Neftochim Bourgas AD for $10 million, thereby increasing the Group's ownership stake in LUKOIL Neftochim<br />
Bourgas AD to 97.2%.<br />
In December 2004, a Group company acquired the remaining 50% interest in LUKAgip N.V. ("LUKAgip") for $143 million<br />
from Eni Group (of which $111 million represents repayment of debt to the Eni Group). The acquisition increased the<br />
Group's ownership in LUKAgip to 100%. LUKAgip owns a 24% interest in the Meleiha Hydrocarbon License Concession<br />
Agreement located onshore in Egypt. It also owns a 10% interest in the Shakh Deniz Exploration, Development and<br />
Production Sharing Agreement, 8% of the midstream gas marketing entity, the Azerbaijan Gas Supply Company, and<br />
100% of LUKAgip Midstream B.V., which holds LUKAgip's 10% interest in the South Caucasus Pipeline Company.<br />
On January 26, 2004, a Group company entered into an agreement with ConocoPhillips to purchase 308 gas stations and<br />
contracts to supply petroleum products to an additional 471 gas stations in the Northeast of the United States of America<br />
for $270 million. The transaction was finalized in May 2004.<br />
Purchases of interests in OAO Primorieneftegaz, Nelson, ZAO SeverTEK, Oy Teboil Ab, Suomen Petrooli Oy and LUKOIL<br />
Neftochim Bourgas AD did not have a material impact on the Group's consolidated operations for the period ended<br />
December 31, <strong>2005</strong>. Therefore, no pro-forma income statement information has been provided in these consolidated<br />
financial statements.<br />
NOTE 18. CONSOLIDATION OF VARIABLE INTEREST ENTITY<br />
On June 30, <strong>2005</strong>, the Company completed the formation of a joint venture with ConocoPhillips within the framework of<br />
their broad-based strategic alliance. This joint venture was created by selling ConocoPhillips an interest in the Company's<br />
wholly owned subsidiary OOO Narianmarneftegaz ("NMNG") for $529 million. This joint venture is to develop oil reserves<br />
in the Timan-Pechora region of the Russian Federation. The Group and ConocoPhillips have equal voting rights over the<br />
joint venture's activity and effective ownership interests of 70% and 30%, respectively. As of June 30, <strong>2005</strong>, NMNG's<br />
total assets were approximately $1.6 billion.<br />
The Group has determined that NMNG is a variable interest entity as the Group's voting rights are not proportionate to<br />
its ownership rights and all of NMNG's activities are conducted on behalf of the Group and ConocoPhillips, its related<br />
party. The Group has also determined that it is the primary beneficiary and has consolidated NMNG.<br />
As a result of the transaction, the Group recognized a gain of $152 million, which is included in "Gain (loss) on disposals<br />
and impairments of assets" in the consolidated statement of income.<br />
NOTE 19. FINANCIAL GUARANTEES<br />
The Group has entered into various guarantee arrangements. These arrangements arose in transactions related to<br />
enhancing the credit standing of an affiliated company LUKARCO and borrowings of the Group's suppliers.<br />
The following table provides the undiscounted maximum amount of potential future payments for each major group of<br />
guarantees:<br />
As of<br />
December 31, <strong>2005</strong><br />
As of<br />
December 31, 2004<br />
Guarantees of equity investees' debt 454 629<br />
Guarantees of third parties' debt 19 13<br />
Total 473 642<br />
Guarantees on debt<br />
LUKARCO, an investee recorded under the equity method of accounting has a loan facility on which $709 million was<br />
drawn as of December 31, <strong>2005</strong>. Borrowings under this loan bear interest at LIBOR plus 2.5% and are partly payable by<br />
February 7, 2007 with the remaining outstanding balance repayable by May 1, 2012. To enhance the credit standing of<br />
LUKARCO, the Company guarantees 54% of the interest payment as well as the repayment of 54% of the loan at maturity.<br />
As of December 31, <strong>2005</strong>, the total amount of the Company's guarantee was $447 million, which includes $64 million<br />
related to accrued interest on the outstanding amount. Payments are due if the Company is notified that LUKARCO<br />
is not able to fulfill its obligations at maturity date. No collateral secures LUKARCO's obligation or the Company's guarantee.<br />
There are no material amounts being carried as liabilities for the Group's obligations under this guarantee.<br />
158
NOTE 20. COMMITMENTS AND CONTINGENCIES<br />
Capital expenditure, exploration and investment programs<br />
The Group owns and operates refineries in Bulgaria (LUKOIL Neftochim Bourgas AD) and Romania (Petrotel-LUKOIL).<br />
As a result of Bulgaria and Romania joining the European Union in 2007, LUKOIL Neftochim Bourgas AD and<br />
Petrotel-LUKOIL are required to upgrade their refining plants to comply with the requirements of European Union legislation in<br />
relation to the quality of produced petroleum products and environmental protection. These requirements are stricter than existing<br />
Bulgarian and Romanian legislation. The Group estimates the amount of future capital commitment required to upgrade<br />
LUKOIL Neftochim Bourgas AD and Petrotel-LUKOIL to be approximately $607 million and $60 million, respectively.<br />
Group companies have commitments under the terms of existing license agreements in the Russian Federation of<br />
$1,380 million over the next 5 years and of $115 million thereafter. Management believes that a significant portion of<br />
these commitments will be fulfilled by the services to be performed by Eurasia Drilling Company and ZAO Globalstroy-<br />
Engineering as discussed below.<br />
In connection with the sale of LUKOIL-Burenie (refer to Note 10 "Dispositions of subsidiaries and assets") the Group<br />
signed a five year contract for drilling services. Under the terms of the contract, drilling services of $378 million,<br />
$571 million, $661 million, and $666 million will be provided by LUKOIL-Burenie (now Eurasia Drilling Company) during<br />
2006, 2007, 2008, and 2009, respectively.<br />
The Company has signed a four-year agreement for the provision of construction, engineering and technical services with<br />
ZAO Globalstroy-Engineering. The volume of these services is based on the Group's capital construction program, which<br />
is re-evaluated on an annual basis. The Group estimates the amount of capital commitment under this agreement for<br />
2006 to be approximately $850 million.<br />
Group companies have commitments for capital expenditure contributions in the amount of $479 million related to<br />
various production sharing agreements over the next 32 years.<br />
Group companies have investment commitments relating to oil deposits in Iraq of $495 million to be spent within 3 years<br />
from when exploitation becomes possible. Due to significant changes in the political and economic situation in Iraq the<br />
future of this contract is not clear, however, the Group is actively pursuing its legal right to this contract in Iraq in alliance<br />
with ConocoPhillips.<br />
CONSOLIDATED FINANCIAL STATEMENTS<br />
Operating lease obligations<br />
A Group company has commitments of $1,140 million primarily for the lease of vessels and petroleum distribution outlets<br />
over the next 9 years. Commitments for minimum rentals under these leases as of December 31, <strong>2005</strong> are as follows:<br />
As of<br />
December 31, <strong>2005</strong><br />
2006 316<br />
2007 180<br />
2008 108<br />
2009 88<br />
2010 88<br />
beyond 360<br />
Insurance<br />
The insurance industry in the Russian Federation and certain other areas where the Group has operations is in the<br />
course of development. Management believes that the Group has adequate property damage coverage for its main<br />
production assets. In respect of third party liability for property and environmental damage arising from accidents on<br />
Group property or relating to Group operations, the Group has insurance coverage that is generally higher than insurance<br />
limits set by the local legal requirements. Management believes that the Group has adequate insurance coverage<br />
of the risks, which could have a material effect on the Group's operations and financial position. The Group has limited<br />
business interruption insurance coverage. Management does not believe that it is appropriate to have full insurance<br />
coverage against business interruption given the Group's geographical diversity and the limited impact it considers<br />
likely to occur from a single event.<br />
159
FINANCIAL ACCOUNTS<br />
Environmental liabilities<br />
Group companies and their predecessor entities have operated in the Russian Federation and other countries for many<br />
years and, within certain parts of the operations, environmental related problems have developed. Environmental regulations<br />
are currently under consideration in the Russian Federation and other areas where the Group has operations. Group<br />
companies routinely assess and evaluate their obligations in response to new and changing legislation.<br />
As liabilities in respect of the Group's environmental obligations are able to be determined, they are charged against<br />
income over the estimated remaining lives of the related assets or recognized immediately depending on their nature.<br />
The likelihood and amount of liabilities relating to environmental obligations under proposed or any future legislation<br />
cannot be reasonably estimated at present and could become material. Under existing legislation, however, management<br />
believes that there are no significant unrecorded liabilities or contingencies, which could have a materially adverse effect<br />
on the operating results or financial position of the Group.<br />
Social assets<br />
Certain Group companies contribute to Government sponsored programs, the maintenance of local infrastructure and the<br />
welfare of their employees within the Russian Federation and elsewhere. Such contributions include assistance with the<br />
construction, development and maintenance of housing, hospitals and transport services, recreation and other social<br />
needs. The funding of such assistance is periodically determined by management and is appropriately capitalized or<br />
expensed as incurred.<br />
Taxation environment<br />
The taxation systems in the Russian Federation and other emerging markets where Group companies operate are relatively<br />
new and are characterized by numerous taxes and frequently changing legislation, which is often unclear, contradictory,<br />
and subject to interpretation. Often, differing interpretations exist among different tax authorities within the same<br />
jurisdictions and among taxing authorities in different jurisdictions. Taxes are subject to review and investigation by a<br />
number of authorities, which are enabled by law to impose severe fines, penalties and interest charges. In the Russian<br />
Federation a tax year remains open for review by the tax authorities during the three subsequent calendar years; however,<br />
under certain circumstances a tax year may remain open longer. Recent events within the Russian Federation suggest<br />
that the tax authorities are taking a more assertive position in their interpretation and enforcement of tax legislation. Such<br />
factors may create taxation risks in the Russian Federation and other emerging markets where Group companies<br />
operate substantially more significant than those in other countries where taxation regimes have been subject to development<br />
and clarification over long periods.<br />
The regional organizational structure of the Russian Federation tax authorities and the regional judicial system can mean<br />
that taxation issues successfully defended in one region may be unsuccessful in another region. The tax authorities in<br />
each region may have a different interpretation of similar taxation issues. There is however some degree of direction provided<br />
from the central authority based in Moscow on particular taxation issues.<br />
The Group has implemented tax planning and management strategies based on existing legislation at the time of implementation.<br />
The Group is subject to tax authority audits on an ongoing basis, as is normal in the Russian environment and<br />
other republics of the former Soviet Union, and, at times, the authorities have attempted to impose additional significant<br />
taxes on the Group. Management believes that it has adequately met and provided for tax liabilities based on its interpretation<br />
of existing tax legislation. However, the relevant tax authorities may have differing interpretations and the effects on<br />
the financial statements, if the authorities were successful in enforcing their interpretations, could be significant.<br />
"Income tax expense" and "Taxes other than income taxes" in the consolidated statement of income include $163 million<br />
in relation to the results of tax audits of the Group companies for periods prior to the 2004 financial year.<br />
Litigation and claims<br />
On November 27, 2001, Archangel Diamond Corporation ("ADC"), a Canadian diamond development company, filed a<br />
lawsuit in the District Court of Denver, Colorado, against OAO "Arkhangelskgeoldobycha" ("AGD"), a Group company, and<br />
the Company (together the "Defendants"). ADC claims, among other things, that the Defendants interfered with the<br />
transfer of a diamond exploration license to Almazny Bereg, a joint venture between ADC and AGD. The total damages<br />
claimed by ADC are approximately $4.8 billion, including compensatory damages of $1.2 billion and punitive damages<br />
of $3.6 billion. On October 15, 2002, the District Court of Denver, Colorado dismissed ADC's action against the<br />
Defendants based on lack of personal jurisdiction. On November 22, 2002, the Denver District Court denied ADC's<br />
request for reconsideration of the Court's October 15th order dismissing the case. ADC subsequently filed an appeal<br />
on November 27, 2002 with the Court of Appeals in the State of Colorado. On March 25, 2004, the Court of Appeals<br />
upheld the October 15, 2002 decision of the District Court. On April 17, 2004, ADC filed a motion for rehearing that was<br />
denied on June 17, 2004. ADC then filed a petition for writ of certiorari with the Colorado Supreme Court on July 16,<br />
2004. On January 10, <strong>2005</strong>, the Colorado Supreme Court granted certiorari on a narrow issue: whether the Court of<br />
Appeals erred by concluding that a trial court may decide a motion to dismiss for lack of personal jurisdiction by weighing<br />
and resolving factual issues without an evidentiary hearing. The Colorado Supreme Court declined to review ADC's<br />
160
other requested issue concerning jurisdiction. On November 21, <strong>2005</strong>, the Colorado Supreme Court affirmed the lower<br />
courts' findings that no specific jurisdiction exists over the Defendants. By virtue of this finding, AGD (the holder of the<br />
diamond exploration license) was dismissed from the lawsuit. The Supreme Court found however, that the trial court<br />
erred by not holding an evidentiary hearing concerning the existence of general jurisdiction, which is whether the<br />
Company had systematic and continuous contacts in the State of Colorado at the time the lawsuit was filed. Therefore,<br />
the lawsuit was initially remanded to the trial court to hold an evidentiary hearing on the issue of general jurisdiction.<br />
However, in response to a petition for rehearing filed by the Company, the Supreme Court issued a modified opinion<br />
on December 19, <strong>2005</strong> remanding this case to the Court of Appeals to consider any remaining issues that were not<br />
addressed by the Court of Appeals' previous decision. On March 2, 2006, the Court of Appeals granted the Company's<br />
motion to permit supplemental briefing on the issue of forum non convenience. Briefs on this issue were filed by the<br />
Company and ADC on March 27, 2006. The Company has filed a motion requesting oral argument on forum non<br />
convenience; the Court of Appeals has not ruled on this request. No other timetable has been established for the<br />
proceedings in the Court of Appeals. Management does not believe that the ultimate resolution of this matter will have<br />
a material adverse effect on the Group's financial condition.<br />
On February 20, 2004, the Stockholm District Court overturned the decision of the Arbitral Tribunal of the Arbitration<br />
Institute of the Stockholm Chamber of Commerce made on June 25, 2001 dismissing ADC's action against AGD based<br />
on lack of jurisdiction. ADC's lawsuit against AGD was initially filed with the Arbitral Tribunal of the Arbitration Institute<br />
of the Stockholm Chamber of Commerce claiming alleged non-performance under an agreement between the parties<br />
and its obligation to transfer the diamond exploration license to Almazny Bereg. This lawsuit claimed compensation of<br />
damages amounting to $492 million. In March 2004, AGD filed an appeal against the Stockholm District Court decision<br />
with the Swedish Court of Appeals. On November 15, <strong>2005</strong>, the Swedish Court of Appeals denied AGD's appeal and<br />
affirmed the Stockholm District Court decision. On December 13, <strong>2005</strong>, AGD filed an appeal against the Swedish Court<br />
of Appeals decision with the Swedish Supreme Court. The decision of the Swedish Supreme Court is expected to be<br />
issued during 2006. Management does not believe that the ultimate resolution of this matter will have a material adverse<br />
effect on the Group's financial condition.<br />
The Group is involved in various other claims and legal proceedings arising in the normal course of business. While these<br />
claims may seek substantial damages against the Group and are subject to uncertainty inherent in any litigation, management<br />
does not believe that the ultimate resolution of such matters will have a material adverse impact on the Group's<br />
operating results or financial condition.<br />
CONSOLIDATED FINANCIAL STATEMENTS<br />
NOTE 21. RELATED PARTY TRANSACTIONS<br />
In the rapidly developing business environment in the Russian Federation, companies and individuals have frequently<br />
used nominees and other forms of intermediary companies in transactions. The senior management of the<br />
Company considers that the Group has appropriate procedures in place to identify and properly disclose transactions<br />
with related parties in this environment and has disclosed all of the relationships identified which it deemed to be<br />
significant. Related party sales and purchases of oil and oil products were primarily to and from affiliated companies<br />
and the Company's shareholder ConocoPhillips. Purchases of construction services were primarily from affiliated<br />
companies.<br />
Below are related party transactions not disclosed elsewhere in the financial statements. Refer also to Notes 3, 10, 11,<br />
12, 14, 17, 18, 19 and 22 for other transactions with related parties.<br />
Sales of oil and oil products to related parties were $605 million, $153 million and $124 million for the years ended<br />
December 31, <strong>2005</strong>, 2004 and 2003, respectively.<br />
Other sales to related parties were $58 million, $63 million and $76 million for the years ended December 31, <strong>2005</strong>, 2004<br />
and 2003, respectively.<br />
Purchases of oil and oil products from related parties were $2,248 million, $770 million and $270 million for the years<br />
ended December 31, <strong>2005</strong>, 2004 and 2003, respectively.<br />
Purchases of construction services from related parties were $378 million, $648 million and $451 million for the years<br />
ended December 31, <strong>2005</strong>, 2004 and 2003, respectively.<br />
Other purchases from related parties were $54 million, $71 million and $99 million for the years ended December 31,<br />
<strong>2005</strong>, 2004 and 2003, respectively.<br />
Purchases of insurance services from related parties, whose management and directors include members of the Group's<br />
management, were $133 million, $138 million and $200 million during the years ended December 31, <strong>2005</strong>, 2004 and<br />
2003, respectively.<br />
Amounts receivable from related parties, including loans and advances, were $160 million and $225 million as of<br />
December 31, <strong>2005</strong> and 2004, respectively. Amounts payable to related parties were $127 million and $150 million as of<br />
December 31, <strong>2005</strong> and 2004, respectively.<br />
161
FINANCIAL ACCOUNTS<br />
NOTE 22. COMPENSATION PLAN<br />
During 2003, the Company introduced a compensation plan available to certain members of management, which<br />
provides compensation based upon share appreciation rights on the Company's common stock. The number of shares,<br />
or rights, allocated to the plan is approximately 11 million shares. These rights vest in December 2006. The Group has<br />
accrued a liability of $283 million, included in "Other current liabilities", and $68 million, included in "Other long-term<br />
liabilities", as of December 31, <strong>2005</strong> and 2004, respectively and recorded $263 million and $65 million of compensation<br />
expense during the year ended December 31, <strong>2005</strong> and 2004, respectively. The Group also recorded compensation of<br />
$26 million during the year ended December 31, 2003 in relation to this and a previous plan that expired in 2003.<br />
NOTE 23. SEGMENT INFORMATION<br />
Presented below is information about the Group's operating and geographical segments for the years ended December<br />
31, <strong>2005</strong>, 2004 and 2003 in accordance with SFAS No. 131, "Disclosures about Segments of an Enterprise and Related<br />
Information."<br />
The Group has four operating segments – exploration and production; refining, marketing and distribution; chemicals and<br />
other business segments. These segments have been determined based on the nature of their operations. Management<br />
on a regular basis assesses the performance of these operating segments. The exploration and production segment<br />
explores for, develops and produces primarily crude oil. The refining, marketing and distribution segment processes crude<br />
oil into refined products and purchases, sells and transports crude oil and refined petroleum products. The chemicals segment<br />
refines and sells chemical products. Activities of the other business operating segment include the development<br />
of businesses beyond the Group's traditional operations.<br />
Geographical segments have been determined based on the area of operations and include three segments. They are<br />
Western Siberia, European Russia and International.<br />
Operating segments<br />
<strong>2005</strong><br />
Exploration<br />
and<br />
production<br />
Refining,<br />
marketing and<br />
distribution<br />
Chemicals Other Elimination Consolidated<br />
Sales<br />
Third parties 1,047 53,064 1,628 35 - 55,774<br />
Inter-segment 14,821 1,041 22 138 (16,022) -<br />
Total sales 15,868 54,105 1,650 173 (16,022) 55,774<br />
Operating expenses and<br />
total cost of purchases 2,602 34,652 1,314 126 (15,809) 22,885<br />
Depreciation, depletion<br />
and amortization 824 464 15 12 - 1,315<br />
Interest expense 73 335 2 50 (185) 275<br />
Income tax expense 1,111 1,317 35 4 - 2,467<br />
Net income 3,362 3,059 122 52 (152) 6,443<br />
Total assets 25,480 23,682 586 5,130 (14,533) 40,345<br />
Capital expenditures 2,918 1,129 77 53 - 4,177<br />
162
2004<br />
Sales<br />
Exploration<br />
and<br />
production<br />
Refining,<br />
marketing<br />
and distribution<br />
Chemicals Other Elimination Consolidated<br />
Third parties 1,614 30,807 1,384 40 - 33,845<br />
Inter-segment 8,379 822 13 103 (9,317) -<br />
Total sales 9,993 31,629 1,397 143 (9,317) 33,845<br />
Operating expenses and<br />
total cost of purchases 2,610 18,469 1,119 89 (9,283) 13,004<br />
Depreciation, depletion<br />
and amortization 676 377 8 14 - 1,075<br />
Interest expense 76 272 2 93 (143) 300<br />
CONSOLIDATED FINANCIAL STATEMENTS<br />
Income tax expense 568 1,159 20 13 - 1,760<br />
Net income 1,221 2,908 175 117 (173) 4,248<br />
Total assets 17,827 17,029 462 3,143 (8,700) 29,761<br />
Capital expenditures 2,289 1,070 71 17 - 3,447<br />
2003<br />
Exploration<br />
and<br />
production<br />
Refining,<br />
marketing<br />
and distribution<br />
Chemicals Other Elimination Consolidated<br />
Sales<br />
Third parties 1,580 19,542 963 33 - 22,118<br />
Inter-segment 5,702 285 8 46 (6,041) -<br />
Total sales 7,282 19,827 971 79 (6,041) 22,118<br />
Operating expenses and<br />
total cost of purchases 2,349 11,323 808 25 (6,050) 8,455<br />
Depreciation, depletion<br />
and amortization 606 304 4 6 - 920<br />
Interest expense 66 199 3 84 (79) 273<br />
Income tax expense 381 605 11 10 - 1,007<br />
Net income 1,995 1,573 72 99 (38) 3,701<br />
Total assets 15,851 13,479 282 3,789 (6,827) 26,574<br />
Capital expenditures 1,784 1,175 39 20 - 3,018<br />
163
FINANCIAL ACCOUNTS<br />
Geographical segments<br />
<strong>2005</strong> 2004 2003<br />
Sales of crude oil within Russia 120 181 374<br />
Export of crude oil and sales of crude oil by foreign subsidiaries 16,367 10,940 6,844<br />
Sales of petroleum products within Russia 6,725 4,665 3,450<br />
Export of petroleum products and sales of petroleum products<br />
by foreign subsidiaries 29,216 15,317 9,480<br />
Sales of chemicals within Russia 469 332 251<br />
Export of chemicals and sales of chemicals by foreign subsidiaries 1,134 1,021 671<br />
Other sales within Russia 821 713 568<br />
Other export sales and other sales of foreign subsidiaries 922 676 480<br />
Total sales 55,774 33,845 22,118<br />
<strong>2005</strong><br />
Western<br />
Siberia<br />
European<br />
Russia<br />
International Elimination Consolidated<br />
Sales<br />
Third parties 250 8,656 46,868 - 55,774<br />
Inter-segment 8,947 21,098 31 (30,076) -<br />
Total sales 9,197 29,754 46,899 (30,076) 55,774<br />
Operating expenses and total cost<br />
of purchases 1,372 10,829 40,590 (29,906) 22,885<br />
Depletion, depreciation<br />
and amortization 389 618 308<br />
-<br />
1,315<br />
Interest expense 17 160 133 (35) 275<br />
Income taxes 539 1,716 212 - 2,467<br />
Net income 2,116 4,015 925 (613) 6,443<br />
Total assets 9,301 21,207 14,361 (4,524) 40,345<br />
Capital expenditures 1,100 2,146 931 - 4,177<br />
164
2004<br />
Sales<br />
Western<br />
Siberia<br />
European<br />
Russia<br />
International Elimination Consolidated<br />
Third parties 698 6,739 26,408 - 33,845<br />
Inter-segment 4,780 12,081 20 (16,881) -<br />
Total sales 5,478 18,820 26,428 (16,881) 33,845<br />
Operating expenses and total cost<br />
of purchases 1,457 6,334 22,045 (16,832) 13,004<br />
Depletion, depreciation<br />
and amortization 366 533 176 - 1,075<br />
CONSOLIDATED FINANCIAL STATEMENTS<br />
Interest expense 33 234 92 (59) 300<br />
Income taxes 236 1,351 173 - 1,760<br />
Net income 607 3,295 682 (336) 4,248<br />
Total assets 5,625 16,796 10,579 (3,239) 29,761<br />
Capital expenditures 1,082 1,767 598 - 3,447<br />
2003<br />
Western<br />
Siberia<br />
European<br />
Russia<br />
International Elimination Consolidated<br />
Sales<br />
Third parties 512 5,346 16,260 - 22,118<br />
Inter-segment 3,212 7,572 22 (10,806) -<br />
Total sales 3,724 12,918 16,282 (10,806) 22,118<br />
Operating expenses and total cost<br />
of purchases 1,023 4,836 13,414 (10,818) 8,455<br />
Depletion, depreciation<br />
and amortization 314 476 130 - 920<br />
Interest expense 13 233 70 (43) 273<br />
Income taxes 172 773 62 - 1,007<br />
Net income 584 1,761 1,376 (20) 3,701<br />
Total assets 6,721 15,912 7,247 (3,306) 26,574<br />
Capital expenditures 543 1,953 522 - 3,018<br />
165
FINANCIAL ACCOUNTS<br />
OAO LUKOIL<br />
Supplementary Information on Oil and Gas Exploration and Production Activities (Unaudited)<br />
(Millions of US dollars, except as indicated)<br />
This section provides unaudited supplemental information on oil and gas exploration and production activities in accordance<br />
with SFAS No. 69, "Disclosures About Oil and Gas Producing Activities" in six separate tables:<br />
I. Capitalized costs relating to oil and gas producing activities<br />
II. Costs incurred in oil and gas property acquisition, exploration, and development activities<br />
III. Results of operations for oil and gas producing activities<br />
IV. Reserve quantity information<br />
V. Standardized measure of discounted future net cash flows<br />
VI. Principal sources of changes in the standardized measure of discounted future net cash flows<br />
Amounts shown for equity companies represent the Group's share in its exploration and production affiliates, which are<br />
accounted for using the equity method of accounting.<br />
I. Capitalized costs relating to oil and gas producing activities<br />
As of December 31, <strong>2005</strong> International Russia<br />
Total<br />
consolidated<br />
companies<br />
Group's share<br />
in equity<br />
companies<br />
Total<br />
Unproved oil and gas properties 196 531 727 17 744<br />
Proved oil and gas properties 4,331 26,785 31,116 782 31,898<br />
Accumulated depreciation, depletion,<br />
and amortization (377) (12,672) (13,049) (173) (13,222)<br />
Capitalized cost related to asset<br />
retirement obligation - 166 166 4 170<br />
Accumulated depreciation of capitalized<br />
cost related to asset retirement obligation - (19) (19) - (19)<br />
Net capitalized costs 4 ,150 14,791 18,941 630 19,571<br />
As of December 31, 2004 International Russia<br />
Total<br />
consolidated<br />
companies<br />
Group's share<br />
in equity<br />
companies<br />
Total<br />
Unproved oil and gas properties 202 666 868 23 891<br />
Proved oil and gas properties 1,256 23,922 25,178 735 25,913<br />
Accumulated depreciation, depletion,<br />
and amortization (154) (12,154) (12,308) (174) (12,482)<br />
Capitalized cost related to asset<br />
retirement obligation 1 70 71 1 72<br />
Accumulated depreciation of capitalized<br />
cost related to asset retirement obligation - (7) (7) - (7)<br />
Net capitalized costs 1,305 12,497 13,802 585 14,387<br />
166
As of December 31, 2003 International Russia<br />
Total<br />
consolidated<br />
companies<br />
Group's share<br />
in equity<br />
companies<br />
Unproved oil and gas properties 127 508 635 23 658<br />
Proved oil and gas properties 906 22,730 23,636 680 24,316<br />
Accumulated depreciation, depletion,<br />
and amortization (71) (12,071) (12,142) (103) (12,245)<br />
Capitalized cost related to asset<br />
retirement obligation 2 36 38 1 39<br />
Accumulated depreciation of capitalized<br />
cost related to asset retirement obligation - (5) (5) - (5)<br />
Total<br />
CONSOLIDATED FINANCIAL STATEMENTS<br />
Net capitalized costs 964 11,198 12,162 601 12,763<br />
II. Costs incurred in oil and gas property acquisition, exploration, and development activities<br />
Year ended December 31, <strong>2005</strong> International Russia<br />
Total<br />
consolidated<br />
companies<br />
Group's share<br />
in equity<br />
companies<br />
Acquisition of properties – proved 1,726 183 1,909 80 1,989<br />
Acquisition of properties – unproved 690 370 1,060 100 1,160<br />
Exploration costs 171 252 423 3 426<br />
Development costs 260 2,235 2,495 124 2,619<br />
Total costs incurred 2,847 3,040 5,887 307 6,194<br />
Total<br />
Year ended December 31, 2004 International Russia<br />
Total<br />
consolidated<br />
companies<br />
Group's share<br />
in equity<br />
companies<br />
Acquisition of properties – proved 224 16 240 - 240<br />
Acquisition of properties – unproved 22 49 71 - 71<br />
Exploration costs 81 225 306 3 309<br />
Development costs 108 1,875 1,983 117 2,100<br />
Total costs incurred 435 2,165 2,600 120 2,720<br />
Total<br />
Year ended December 31, 2003 International Russia<br />
Total<br />
consolidated<br />
companies<br />
Group's share<br />
in equity<br />
companies<br />
Acquisition of properties – proved - 485 485 2 487<br />
Acquisition of properties – unproved 2 311 313 1 314<br />
Exploration costs 121 135 256 3 259<br />
Development costs 128 1,400 1,528 249 1,777<br />
Total costs incurred 251 2,331 2,582 255 2,837<br />
Total<br />
$21 million relating to the cumulative effect of the adoption of SFAS No.143 is excluded from costs incurred in 2003.<br />
167
FINANCIAL ACCOUNTS<br />
III. Results of operations for oil and gas producing activities<br />
The Group's results of operations for oil and gas producing activities are presented below. In accordance with SFAS<br />
No. 69, sales and transfers to Group companies are based on market prices. Income taxes are based on statutory rates.<br />
The results of operations exclude corporate overhead and interest costs.<br />
Year ended December 31, <strong>2005</strong> International Russia<br />
Total<br />
consolidated<br />
companies<br />
Group's share<br />
in equity<br />
companies<br />
Total<br />
Revenue<br />
Sales 620 12,327 12,947 720 13,667<br />
Transfers - 8,072 8,072 268 8,340<br />
Total revenues 620 20,399 21,019 988 22,007<br />
Production costs (excluding production<br />
taxes) (93) (1,672) (1,765) (137) (1,902)<br />
Exploration expense (192) (125) (317) (1) (318)<br />
Depreciation, depletion, and amortization (106) (718) (824) (60) (884)<br />
Accretion expense - (30) (30) - (30)<br />
Taxes other than income taxes (6) (11,160) (11,166) (285) (11,451)<br />
Related income taxes (160) (1,548) (1,708) (181) (1,889)<br />
Total results of operations<br />
for producing activities 63 5,146 5,209 324 5,533<br />
Year ended December 31, 2004 International Russia<br />
Total<br />
consolidated<br />
companies<br />
Group's share<br />
in equity<br />
companies<br />
Total<br />
Revenue<br />
Sales 243 8,841 9,084 754 9,838<br />
Transfers - 4,456 4,456 47 4,503<br />
Total revenues 243 13,297 13,540 801 14,341<br />
Production costs (excluding production<br />
taxes) (54) (1,509) (1,563) (62) (1,625)<br />
Exploration expense (40) (131) (171) (5) (176)<br />
Depreciation, depletion, and amortization (28) (648) (676) (39) (715)<br />
Accretion expense - (8) (8) - (8)<br />
Taxes other than income taxes (2) (5,544) (5,546) (172) (5,718)<br />
Related income taxes (3) (1,310) (1,313) (315) (1,628)<br />
Total results of operations<br />
for producing activities 116 4,147 4,263 208 4,471<br />
168
Year ended December 31, 2003 International Russia<br />
Revenue<br />
Total<br />
consolidated<br />
companies<br />
Group's share<br />
in equity<br />
companies<br />
Sales 102 5,606 5,708 339 6,047<br />
Transfers 3 2,638 2,641 28 2,669<br />
Total revenues 105 8,244 8,349 367 8,716<br />
Production costs (excluding production<br />
taxes) (26) (1,432) (1,458)<br />
Total<br />
(69) (1,527)<br />
Exploration expense (15) (121) (136) (4) (140)<br />
CONSOLIDATED FINANCIAL STATEMENTS<br />
Depreciation, depletion, and amortization (16) (590) (606) (31) (637)<br />
Accretion expense - (11) (11) - (11)<br />
Taxes other than income taxes - (3,230) (3,230) (69) (3,299)<br />
Related income taxes (8) (686) (694) (53) (747)<br />
Total results of operations<br />
for producing activities 40 2,174 2,214 141 2,355<br />
IV. Reserve quantity information<br />
Proved reserves are the estimated quantities of oil and gas reserves which geological and engineering data demonstrate<br />
will be recoverable with reasonable certainty in future years from known reservoirs under existing economic and operating<br />
conditions. Proved reserves do not include additional quantities of oil and gas reserves that may result from<br />
extensions of currently proved areas or from applying secondary or tertiary recovery techniques not yet tested and determined<br />
to be economic.<br />
Proved developed reserves are the quantities of reserves expected to be recovered through existing wells with existing<br />
equipment and operating methods.<br />
Due to the inherent uncertainties and the necessarily limited nature of reservoir data, estimates of reserves are subject<br />
to change as additional information becomes available.<br />
Management has included within proved reserves quantities which the Group expects to produce after the expiry dates<br />
of its current production licenses. These licenses expire between 2011 and 2026, with the most significant expiring<br />
between 2011 and 2014. Management believes the licenses will be extended to produce subsequent to their current<br />
expiry dates. The Group is in the process of extending all of its production licenses in the Russian Federation. The Group<br />
has already extended a portion of these licenses and expects to extend the remaining licenses for indefinite periods. To<br />
date there have been no unsuccessful license renewal applications.<br />
169
FINANCIAL ACCOUNTS<br />
Estimated net proved oil and gas reserves and changes thereto for the years <strong>2005</strong>, 2004 and 2003 are shown in the<br />
tables set out below.<br />
Millions of barrels<br />
Crude oil<br />
Consolidated subsidiaries<br />
International Russia Total<br />
Group's share<br />
in equity<br />
companies<br />
January 1, 2003 327 14,386 14,713 545 15,258<br />
Total<br />
Revisions of previous estimates 15 493 508 97 605<br />
Purchase of hydrocarbons in place* - 571 571 (206) 365<br />
Extensions and discoveries - 420 420 - 420<br />
Production (8) (552) (560) (32) (592)<br />
Sales of reserves (79) - (79) - (79)<br />
December 31, 2003 255 15,318 15,573 404 15,977<br />
Revisions of previous estimates 8 (63) (55) 65 10<br />
Purchase of hydrocarbons in place* 12 22 34 (1) 33<br />
Extensions and discoveries - 606 606 18 624<br />
Production (11) (596) (607) (28) (635)<br />
Sales of reserves - (35) (35) (2) (37)<br />
December 31, 2004 264 15,252 15,516 456 15,972<br />
Revisions of previous estimates (43) 29 (14) (6) (20)<br />
Purchase of hydrocarbons in place* 174 266 440 (86) 354<br />
Extensions and discoveries 28 472 500 6 506<br />
Production (15) (619) (634) (30) (664)<br />
Sales of reserves - (34) (34) - (34)<br />
December 31, <strong>2005</strong> 408 15,366 15,774 340 16,114<br />
Proved developed reserves<br />
December 31, 2003 143 9,792 9,935 272 10,207<br />
December 31, 2004 124 10,205 10,329 322 10,651<br />
December 31, <strong>2005</strong> 255 10,070 10,325 258 10,583<br />
* Purchase of hydrocarbons in place for equity companies includes transfers of reserves to the consolidated group<br />
upon those equity companies becoming subject to consolidation.<br />
The minority interest share included in the above total proved reserves was 580 million barrels, 259 million barrels and<br />
256 million barrels as of December 31, <strong>2005</strong>, 2004 and 2003, respectively. The minority interest share included in the<br />
above proved developed reserves was 172 million barrels, 125 million barrels and 133 million barrels as of December 31,<br />
<strong>2005</strong>, 2004 and 2003, respectively. Substantially all minority interests relate to the reserves in the Russian Federation.<br />
170
Billions of cubic feet<br />
Natural gas<br />
Consolidated subsidiaries<br />
International Russia Total<br />
Group's share<br />
in equity<br />
companies<br />
January 1, 2003 1,581 22,362 23,943 221 24,164<br />
Revisions of previous estimates 602 (269) 333 13 346<br />
Purchase of hydrocarbons in place* - 98 98 (59) 39<br />
Extensions and discoveries - 57 57 - 57<br />
Production (28) (96) (124) (9) (133)<br />
December 31, 2003 2,155 22,152 24,307 166 24,473<br />
Total<br />
CONSOLIDATED FINANCIAL STATEMENTS<br />
Revisions of previous estimates (268) (754) (1,022) 55 (967)<br />
Purchase of hydrocarbons in place 1,174 2 1,176 - 1,176<br />
Extensions and discoveries - 93 93 2 95<br />
Production (32) (133) (165) (9) (174)<br />
Sales of reserves - (4) (4) (1) (5)<br />
December 31, 2004 3,029 21,356 24,385 213 24,598<br />
Revisions of previous estimates 402 (520) (118) (4) (122)<br />
Purchase of hydrocarbons in place* - 8 8 (6) 2<br />
Extensions and discoveries 273 742 1 015 5 1 020<br />
Production (35) (155) (190) (10) (200)<br />
Sales of reserves - - - - -<br />
December 31, <strong>2005</strong> 3,669 21,431 25,100 198 25,298<br />
Proved developed reserves:<br />
December 31, 2003 1,070 1,722 2,792 122 2,914<br />
December 31, 2004 1,363 3,420 4,783 175 4,958<br />
December 31, <strong>2005</strong> 1,102 4,834 5,936 153 6,089<br />
* Purchase of hydrocarbons in place for equity companies includes transfers of reserves to the consolidated group<br />
upon those equity companies becoming subject to consolidation.<br />
The minority interest share included in the above total proved reserves was 23 billion cubic feet, 20 billion cubic feet and<br />
21 billion cubic feet as of December 31, <strong>2005</strong>, 2004 and 2003, respectively. The minority interest share included in the<br />
above proved developed reserves was 15 billion cubic feet, 15 billion cubic feet and 16 billion cubic feet as of December<br />
31, <strong>2005</strong>, 2004 and 2003, respectively. Substantially all minority interests relate to the reserves in the Russian Federation.<br />
V. Standardized measure of discounted future net cash flows<br />
The standardized measure of discounted future net cash flows, related to the above oil and gas reserves, is calculated<br />
in accordance with the requirements of SFAS No. 69. Estimated future cash inflows from production are computed by<br />
applying year-end prices for oil and gas to year-end quantities of estimated net proved reserves. Adjustment in this<br />
calculation for future price changes is limited to those required by contractual arrangements in existence at the end of<br />
each reporting year. Future development and production costs are those estimated future expenditures necessary to<br />
171
FINANCIAL ACCOUNTS<br />
develop and produce year-end estimated proved reserves based on year-end cost indices, assuming continuation of<br />
year-end economic conditions. Estimated future income taxes are calculated by applying appropriate year-end statutory<br />
tax rates. These rates reflect allowable deductions and tax credits and are applied to estimated future pre-tax net cash<br />
flows, less the tax bases of related assets. Discounted future net cash flows have been calculated using a ten percent<br />
discount factor. Discounting requires a year-by-year estimate of when future expenditures will be incurred and when<br />
reserves will be produced.<br />
The information provided in the tables set out below does not represent management's estimate of the Group's expected<br />
future cash flows or of the value of the Group's proved oil and gas reserves. Estimates of proved reserve quantities<br />
are imprecise and change over time as new information becomes available. Moreover, probable and possible reserves,<br />
which may become proved in the future, are excluded from the calculations. The arbitrary valuation prescribed under<br />
SFAS No. 69 requires assumptions as to the timing and amount of future development and production costs. The<br />
calculations should not be relied upon as an indication of the Group's future cash flows or of the value of its oil and gas<br />
reserves.<br />
International<br />
Russia<br />
Total<br />
consolidated<br />
companies<br />
Group's share<br />
in equity<br />
companies<br />
Total<br />
As of December 31, <strong>2005</strong><br />
Future cash inflows 21,028 375,279 396,307 12,290 408,597<br />
Future production and development costs (9,471) (200,288) (209,759) (4,513) (214,272)<br />
Future income tax expenses (3,563) (40,135) (43,698) (2,220) (45,918)<br />
Future net cash flows 7,994 134,856 142,850 5,557 148,407<br />
Discount for estimated timing of cash<br />
flows (10% p.a.) (4,140) (86,622) (90,762) (2,898) (93,660)<br />
Discounted future net cash flows 3,854 48,234 52,088 2,659 54,747<br />
Minority share in discounted future net<br />
cash flows - 1,730 1,730 - 1,730<br />
Included as a part of the $214 billion of future production and development costs are $5.6 billion of future dismantlement,<br />
abandonment and rehabilitation costs.<br />
International<br />
Russia<br />
Total<br />
consolidated<br />
companies<br />
Group's share<br />
in equity<br />
companies<br />
Total<br />
As of December 31, 2004<br />
Future cash inflows 8,290 290,189 298,479 9,630 308,109<br />
Future production and development costs (4,507) (162,246) (166,753) (4,434) (171,187)<br />
Future income tax expenses (537) (29,268) (29,805) (1,276) (31,081)<br />
Future net cash flows 3,246 98,675 101,921 3,920 105,841<br />
Discount for estimated timing of cash<br />
flows (10% p.a.) (1,919) (64,896) (66,815) (1,980) (68,795)<br />
Discounted future net cash flows 1,327 33,779 35,106 1,940 37,046<br />
Minority share in discounted future net<br />
cash flows - 531 531 - 531<br />
Included as a part of the $171 billion of future production and development costs are $4.4 billion of future dismantlement,<br />
abandonment and rehabilitation costs.<br />
172
As of December 31, 2003<br />
International<br />
Russia<br />
Total<br />
consolidated<br />
companies<br />
Group's share<br />
in equity<br />
companies<br />
Future cash inflows 6,376 261,575 267,951 6,445 274,396<br />
Future production and development costs (3,476) (149,526) (153,002) (3,117) (156,119)<br />
Future income tax expenses (586) (26,071) (26,657) (824) (27,481)<br />
Future net cash flows 2,314 85,978 88,292 2,504 90,796<br />
Discount for estimated timing of cash<br />
flows (10% p.a.) (1,392) (55,642) (57,034) (1,389) (58,423)<br />
Total<br />
CONSOLIDATED FINANCIAL STATEMENTS<br />
Discounted future net cash flows 922 30,336 31,258 1,115 32,373<br />
Minority share in discounted future net<br />
cash flows - 537 537 - 537<br />
Included as a part of the $156 billion of future production and development costs are $3.6 billion of future dismantlement,<br />
abandonment and rehabilitation costs.<br />
VI. Principal sources of changes in the standardized measure of discounted future net cash flows<br />
Consolidated companies <strong>2005</strong> 2004 2003<br />
Discounted present value as at January 1 35,106 31,258 22,082<br />
Net changes due to purchases and sales of minerals in place 1,761 31 16<br />
Sales and transfers of oil and gas produced, net of production costs (7,771) (6,260) (3,525)<br />
Net changes in prices and production costs estimates 18,786 5,881 8,978<br />
Extensions, discoveries, and improved recovery, less related costs 2,619 1,548 1,049<br />
Development costs incurred during the period 2,495 1,983 1,528<br />
Revisions of previous quantity estimates (320) (416) 1,163<br />
Net change in income taxes (5,346) (1,084) (2,867)<br />
Other changes 149 8 (115)<br />
Accretion of discount 4,609 2,157 2,949<br />
Discounted present value at December 31 52,088 35,106 31,258<br />
173
FINANCIAL ACCOUNTS<br />
Group's share in equity companies <strong>2005</strong> 2004 2003<br />
Discounted present value as at January 1 1,940 1,115 1,365<br />
Net changes due to purchases and sales of minerals in place (473) (20) (457)<br />
Sales and transfers of oil and gas produced, net of production costs (565) (562) (225)<br />
Net changes in prices and production costs estimates 1,934 787 158<br />
Extensions, discoveries, and improved recovery, less related costs 62 64 -<br />
Development costs incurred during the period 124 117 127<br />
Revisions of previous quantity estimates (82) 388 218<br />
Net change in income taxes (432) (224) (121)<br />
Other changes (88) 143 (67)<br />
Accretion of discount 239 132 117<br />
Discounted present value at December 31 2,659 1,940 1,115<br />
Total <strong>2005</strong> 2004 2003<br />
Discounted present value as at January 1 37,046 32,373 23,447<br />
Net changes due to purchases and sales of minerals in place 1,288 11 (441)<br />
Sales and transfers of oil and gas produced, net of production costs (8,336) (6,822) (3,750)<br />
Net changes in prices and production costs estimates 20,720 6,668 9,136<br />
Extensions, discoveries, and improved recovery, less related costs 2,681 1,612 1,049<br />
Development costs incurred during the period 2,619 2,100 1,655<br />
Revisions of previous quantity estimates (402) (28) 1,381<br />
Net change in income taxes (5,778) (1,308) (2,988)<br />
Other changes 61 151 (182)<br />
Accretion of discount 4,848 2,289 3,066<br />
Discounted present value at December 31 54,747 37,046 32,373<br />
174
TAXATION OF DIVIDENDS AND CAPITAL GAINS<br />
The following discussion is a summary of certain tax consequences under the laws of the Russian Federation and the<br />
United Kingdom for holders of our ordinary shares, including those ordinary shares that trade in the form of depositary<br />
shares, or DSs, whether in the form of American DSs or global DSs. The summary is general in nature and is based on<br />
the laws of the Russian Federation and the United Kingdom in effect as of the date of this annual report and is subject<br />
to any change in law that may take effect after such date. It does not purport to be a complete analysis of all tax considerations<br />
relating to DSs or ordinary shares, whether in those countries or elsewhere. You should consult with your tax<br />
advisors with respect to the precise Russian and UK tax consequences of acquiring, owning and disposing of our<br />
ordinary shares or DSs. The applicability of any double tax treaty relief will depend on the particular circumstances and<br />
facts relating to each relevant holder. In this regard, however, it is noted that there may be practical difficulties involved<br />
in claiming double tax treaty relief.<br />
Under no circumstances should you view this summary as tax advice.<br />
CONSOLIDATED FINANCIAL STATEMENTS<br />
RUSSIAN TAX CONSIDERATIONS<br />
This summary does not seek to address the applicability of any double tax treaty relief. With the enactment of the Profits<br />
Tax Chapter of the Russian Tax Code which became effective 1 January 2002 the advance treaty clearance procedure<br />
has been eliminated. However, this does not eliminate a risk of the tax authorities disputing the relief from withholding<br />
tax when they carry out a tax audit and requiring the tax agent to make payment of tax, penalties and interest.<br />
Non-resident holder<br />
For the purposes of this summary, a "non-resident holder" in relation to an individual means a physical person, physically<br />
present in the Russian Federation for less than 183 days in a given calendar year that holds and disposes of DSs or<br />
ordinary shares.<br />
For the purposes of this summary, a "non-resident holder" in relation to a legal entity is a legal person or organisation, in<br />
each case not organised under Russian law, that holds and disposes of DSs or ordinary shares otherwise than through a<br />
permanent establishment in Russia. Current Russian tax legislation does not provide for definition of residency, applicable<br />
to legal entities. In practice, it is possible to use the definition above as term, describing residency of legal entities in Russia.<br />
The Russian tax rules applicable to securities, and in particular to those held by non-resident holders, are characterised<br />
by significant uncertainties and by an absence of interpretative guidance. Russian tax law and procedures are not well<br />
developed and rules are sometimes interpreted differently by different tax inspectorates and inspectors. In addition both<br />
the substantive provisions of Russian tax law and the interpretation and application of those provisions by the Russian tax<br />
authorities may be subject to more rapid and unpredictable change than in a jurisdiction with more developed capital markets.<br />
The relevant chapters of Part Two of the Tax Code that set out the regulatory framework for the taxation of the<br />
income of individuals and the profits of Russian and foreign legal entities do not regulate all the issues arising in connection<br />
with the purchase, ownership and disposition of shares and DSs by non-resident holders. In particular, the Russian<br />
tax authorities have not provided profound guidance regarding the treatment of the share deposit arrangements of the<br />
type relating to DSs.<br />
Taxation of Dividends<br />
Dividends paid to a non-resident holder generally are subject to Russian withholding tax, which will be withheld by us<br />
acting as a tax agent. The applicable tax rate on dividends will depend on whether the dividend recipient is a legal<br />
entity or an individual. Dividends paid to a non-resident holder that is a legal entity generally will be subject to Russian<br />
withholding tax at a rate of 15%. Dividends paid to non-resident individuals are subject to Russian withholding tax at a<br />
rate of 30%, according to the Tax code of the RF. Russia has current double tax treaties (DTTs) with quite a wide range<br />
of countries, where the respective rates for the taxation of dividends are lower. For instance, according to DTT between<br />
Russia and the UK, the relief tax rate for non-resident individuals is 10%.<br />
Russian tax reporting obligations of a non-resident individual<br />
If income received by a non-resident-holder (who is an individual) is treated as taxable in Russia but has not been withheld<br />
for any reason (e.g. paid by foreign company) such an individual is technically liable to declare his or her income to<br />
the Russian tax authorities and pay the tax.<br />
Withholding tax may be reduced under the terms of a double tax treaty between the Russian Federation and the country<br />
of residence of the non-resident holder. For example, the Convention Between the Government of the Russian Federation<br />
175
FINANCIAL ACCOUNTS<br />
and the Government of the United Kingdom and Northern Ireland on the Avoidance of Double Taxation and the Prevention<br />
of Fiscal Evasion with Respect to Taxes on Income and Capital Gains of 15 February 1994, or the UK-Russia Tax Treaty,<br />
provides for a 10% withholding rate on dividends paid to UK holders who are beneficial owners of the dividends.<br />
However, treaty relief may not be available to non-resident holders of DSs because of the absence of clear interpretative<br />
guidance on the beneficial ownership concept in Russia and the fact that the depositary (and not the holders of the DSs)<br />
is the legal holder of the shares under Russian law. In the absence of distinct guidance from the Russian tax authorities<br />
on the application of relevant double tax treaties, we likely will not be able to apply the reduced rates and will have to withhold<br />
tax at applicable domestic rates on dividends payable to a non-resident holder. See "-UK Tax Treaty Relief Procedures."<br />
Taxation of Capital Gains<br />
A non-resident holder generally should not be subject to any Russian income or withholding taxes in connection with the<br />
sale, exchange or other disposition of DSs outside of Russia provided there is no income form a source within Russia.<br />
The Tax Code provides that capital gains realised by non-resident legal entities from the sale of shares or derivative instruments<br />
(where the underlying assets are in the form of shares of Russian companies) that are circulated on foreign<br />
exchanges legally, will not be recognised as income from Russian sources and, therefore, shall be not subject to Russian<br />
withholding taxes.<br />
A non-resident legal entity will be subject to taxes on capital gains only in connection with the sale to a Russian resident<br />
of shares of a Russian company that has more than 50%of its assets in the form of immovable property in Russia. The<br />
non-resident holder may deduct the original purchase price from the proceeds of the sale if he provides documentary support<br />
of the original purchase price to the Russian purchaser, acting as tax agent. In such event the net proceeds of the sale<br />
are subject to a withholding tax at the rate of 24%. Without documentary support, the non-resident entity is not entitled<br />
to deduct the original purchase price and the gross proceeds of the sale are subject to a 20%rate. Please note that since<br />
capital gains may be calculated in roubles the taxable base could be affected by changes in the rouble exchange rates.<br />
Please note that the favourable tax treatment in respect of capital gains realised by non-resident legal entities shall be<br />
applicable only to a non-resident entity without a permanent establishment in the Russian Federation. Should a non-resident<br />
entity establish or create a permanent establishment in Russia, capital gains from the disposition of Russian securities<br />
attributable to such permanent establishment shall be subject to a tax at the rate of 24 %. The acquisition by a nonresident<br />
entity of shares or other property in the Russian Federation does not in itself mean that the non-resident entity<br />
has a permanent establishment in the Russian Federation.<br />
A non-resident individual will generally be subject to withholding tax at the rate of 30% on the gross proceeds from a<br />
disposal of the shares or DSs, less any available cost deduction, where the proceeds of such disposal are received from<br />
a source within Russia, subject to any available double tax treaty relief. For such purposes income is received from "a<br />
source within Russia "if the shares or DSs are sold in the territory of the Russian Federation.<br />
However, there is no definition of "sale in the territory of the Russian Federation "in relation to transactions involving securities.<br />
There is a risk that any sale of shares (as opposed to depositary shares) in a Russian company may be considered<br />
a sale in the territory of the Russian Federation. Proceeds from the sale of shares in a Russian stock exchange (for<br />
listed stock) and sale of shares under a purchase agreement on the territory of Russia are generally considered as a<br />
Russian source income. Sale by a non-resident individual to a foreign company or to the other non-resident individual are<br />
not subject to withholding tax in Russia since there is no tax agent to withhold the tax (according to the definition of the<br />
tax agent in the Tax code of RF). A sale of DSs may also be considered a sale in the territory of the Russian Federation<br />
if the purchaser is a Russian resident. Please note that capital gains are calculated in roubles using the respective<br />
exchange rates on the date of sale and the date of purchase and, thus, the proceeds of the sale subject to taxation would<br />
be affected by changes in rouble exchange rates.<br />
A non-resident holder may be able to avoid Russian withholding tax on the disposition of shares under the terms of a<br />
double tax treaty between the Russian Federation and the country of residence of the non-resident holder. For example,<br />
the UK-Russia Tax Treaty provides for an exemption from withholding tax on capital gains received by UK holders unless<br />
the shares which: (a) derive all or substantially all of their value directly or indirectly from immovable property in Russia;<br />
and (b) are not quoted on an approved stock exchange.<br />
Resident Holders<br />
A holder of DSs or shares who is a physical or legal person resident in Russia for tax purposes is subject to all applicable<br />
Russian taxes. Tax rate on dividends, paid to the resident holders (individuals) is 9%. The tax rate for PEs of FLEs is<br />
15%. In the both cases tax must be withheld by Russian organisation as an agent.<br />
UK Tax Treaty Relief Procedures<br />
The Profits Tax Chapter of the Russian Tax Code, which became effective on 1 January 2002, eliminates the requirement<br />
that a non-resident corporate holder should obtain tax treaty clearance from Russian tax authorities prior to receiving any<br />
income derived from the shares (i.e., from the payment of dividends or the sale of such shares). However, Russian tax<br />
authorities, in connection with a tax audit, may still dispute the fact that the non-resident is eligible to benefit from the<br />
176
double tax treaty and require the tax agent (i.e., the company paying dividends or the Russian purchaser of the shares)<br />
to withhold and pay tax, In practice, the most likely negative outcome for non-withholding of a tax are penalty, amounting<br />
to 20% of non-withheld tax and late payment interest.<br />
Otherwise a non-resident corporate holder seeking to obtain relief from Russian withholding tax under a tax treaty must<br />
provide a confirmation of its tax residence that complies with the applicable double tax treaty as well as the other<br />
documentation related to receiving such income in advance of receiving income. UK holders may obtain the confirmation<br />
by writing to their local UK tax inspector.<br />
In accordance with the Tax Code a non-resident holder who is an individual must present to the tax authorities a document<br />
on his or her tax residency and a document justifying the income received and the tax paid offshore, confirmed by<br />
the foreign tax authorities. Formally such requirement means that an individual cannot rely on the tax treaty until he or<br />
she pays the tax in the residence jurisdiction.<br />
If a non-resident does not obtain advance tax-treaty clearance and tax is withheld by a Russian resident on capital gains<br />
or other amounts, the non-resident holder may apply for a refund within three years from the end of the tax period in<br />
which the tax was withheld when the recipient is a company or within the one-year period from the end of the tax<br />
period in which the tax was withheld when the recipient is an individual. The legal entities are not entitled to grant refund<br />
to an individual.<br />
To process a claim for a refund for legal entities, the Russian tax authorities require (i) a confirmation of the residence of<br />
a non-resident at the time the income was paid, (ii) an application for refund of the tax withheld in a format provided by<br />
the Russian tax authorities and (iii) copies of the relevant contracts and payment documents confirming the payment of<br />
the tax withheld to the appropriate Russian authorities (Form 1012DT (2002) is applicable for legal entities only and is<br />
designed to combine (i) and (ii) for foreign corporate).<br />
For individual a refund is granted only upon the presentation of the a) an application for refund in any understandable by<br />
the tax authorities format; b) statement of all annual income of the individual (Form NDFL-2); c) a confirmation of residence.<br />
The refund of the tax withheld should be granted within one month of the filing of the application for the refund and the<br />
relevant documents have been filed with the Russian tax authorities. However, procedures for processing such claims<br />
have not been clearly established and there is significant uncertainty regarding the availability and timing of such refunds.<br />
The Russian tax authorities may require a Russian translation of some documents as well as to apply other requirements to<br />
the format of documents. Providing necessary documentation does not eliminate a risk of the tax authorities disputing the<br />
relief from withholding tax and requiring additional documentation in the form determinated by the particular inspection.<br />
CONSOLIDATED FINANCIAL STATEMENTS<br />
UNITED KINGDOM TAX CONSIDERATIONS<br />
The comments below are of a general nature based on current UK law and practice. They do not necessarily apply where<br />
the income is deemed for tax purposes to be the income of persons other than persons who are the absolute beneficial<br />
owners of DSs or ordinary shares. In particular these comments do not apply to the following:<br />
investors who do not hold their DSs or ordinary shares as capital assets;<br />
investors that own (or are deemed to own) 10% or more of our voting rights; or<br />
special classes of investors such as dealers.<br />
Withholding tax on dividends<br />
Dividend payments in respect of DSs or ordinary shares issued by a company organised under the laws of the Russian<br />
Federation should not be subject to UK withholding tax. As discussed in "-Russian tax considerations -Taxation of<br />
Dividends," such dividends will be subject to Russian withholding taxes.<br />
Taxation of Dividends<br />
A UK holder of interests in DSs or ordinary shares that receives a dividend on the DSs or ordinary shares may be<br />
subject to UK income tax or corporation tax, as the case may be, on the gross amount of any dividend paid before the<br />
deduction of any Russian withholding taxes, subject to the availability of any credit for Russian tax withheld. An individual<br />
holder of interests in DSs or ordinary shares who is resident and domiciled in the United Kingdom will generally be<br />
subject to UK income tax on the dividend paid on the DSs or ordinary shares. An individual holder of interests in DSs or<br />
ordinary shares who is resident but not domiciled in the United Kingdom (or is resident, but not ordinarily resident, and<br />
domiciled in the United Kingdom, and either a Commonwealth citizen (this includes a British citizen) or a citizen of the<br />
Republic of Ireland) will generally be subject to UK income tax on the dividend paid on the DSs or ordinary shares to the<br />
extent that the dividend is remitted to the United Kingdom. A dividend is remitted to the United Kingdom if it is paid to<br />
the United Kingdom or transmitted or brought to the United Kingdom in any way.<br />
177
FINANCIAL ACCOUNTS<br />
A corporate holder of interests in DSs or ordinary shares that is resident in the United Kingdom will generally be subject<br />
to UK corporation tax on the dividend paid on the DSs or ordinary shares. A corporate holder of interests in DSs or<br />
ordinary shares that is not resident in the United Kingdom will generally not be subject to UK corporation tax on any<br />
dividend paid on the DSs or ordinary shares unless the DSs or ordinary shares are attributable to a trade carried on by<br />
the holder in the United Kingdom through a branch or agency.<br />
Taxation of Disposals<br />
The disposal by a UK holder of interests in DSs or ordinary shares may give rise to a chargeable gain or allowable loss<br />
for the purposes of UK taxation of chargeable gains. An individual holder of interests in DSs or ordinary shares who is<br />
resident or ordinarily resident and domiciled in the United Kingdom will generally be liable for UK capital gains tax on<br />
chargeable gains made on the disposal of an interest in DSs or ordinary shares. An individual holder of interests in DSs<br />
or ordinary shares who is resident or ordinarily resident, but not domiciled, in the United Kingdom will be liable for UK<br />
capital gains tax to the extent that the proceeds received on the disposal of an interest in DSs or ordinary shares (or part<br />
thereof) are remitted or deemed to be remitted to the United Kingdom; losses arising on such disposals cannot be remitted<br />
to the UK. Dealings in the DSs or ordinary shares on the London Stock Exchange may give rise to remitted gains that<br />
would, therefore, give rise to a UK capital gains tax liability. It should be noted that special rules may apply where an<br />
individual has acquired his or her shares in connection with their employment such that any gain or part thereof is<br />
subject to income tax rather than capital gains tax.<br />
In qualifying circumstances (including a qualifying time period), relief may be available to UK resident individual holders,<br />
to reduce the amount of a gain on a disposal of the ordinary shares or DSs, under "taper relief" rules for assets acquired<br />
after March 1998 (indexation may be available if the assets were acquired prior to this time).<br />
Where a UK holder of interests in DSs or ordinary shares has acquired the interests or ordinary shares on a number of<br />
occasions there are specific matching rules which determine, for tax purposes, which interests or ordinary shares are<br />
being disposed of first.<br />
A corporate holder of interests in DSs or ordinary shares that is resident in the United Kingdom will generally be subject<br />
to UK corporation tax on any chargeable gain arising from a disposal of DSs or ordinary shares. A corporate holder of interests<br />
in DSs or ordinary shares that is not resident in the United Kingdom will be subject to UK corporation tax on any<br />
chargeable gain arising from their disposal where the DSs or ordinary shares in question are attributable to a trade<br />
carried on by the holder in the United Kingdom through a branch or agency. An indexation allowance based on the Retail<br />
Price Index may be available to reduce the gain.<br />
In qualifying circumstances (including a qualifying time period), an exemption may be available to UK resident corporate<br />
holders, on a disposal of ordinary shares or DSs, such that any gain/loss will not be taxable/relievable.<br />
Effect of withholding taxes<br />
As discussed in "Taxation - Russian tax considerations - Taxation of Dividends" and "-Taxation of Capital Gains" above,<br />
dividend payments in respect of ordinary shares will be, and certain capital gains may be, subject to Russian withholding<br />
taxes. A UK resident investor should generally be entitled to a credit for Russian tax (if any) properly withheld from such<br />
payments against such investor's liability to income tax or corporation tax on such amounts, subject to UK tax rules for<br />
calculation of such a credit.<br />
Stamp duty<br />
Payment of UK stamp duty will not normally be required in connection with a transfer of interests in DSs or ordinary<br />
shares, provided that the instrument of transfer is executed outside the UK and the transfer does not otherwise relate<br />
to "some matter or thing done or to be done in the UK". No UK stamp duty reserve tax will be payable in respect of an<br />
agreement to transfer interests in DSs or ordinary shares provided that they are not registered in a register kept in the<br />
UK by or on behalf of the body corporate by which they are issued.<br />
178
FORWARD-LOOKING STATEMENTS<br />
Certain statements in this document are not historical facts and are "forward-looking." We may from time to time make<br />
written or oral forward-looking statements in reports to shareholders and in other communications. Examples of such<br />
forward-looking statements include, but are not limited to:<br />
statements of our plans, objectives or goals, including those related to products or services;<br />
statements of future economic performance; and<br />
statements of assumptions underlying such statements.<br />
Forward looking statements that may be made by us from time to time (but that are not included in this document) may<br />
also include projections or expectations of revenues, income (or loss), earnings (or loss) per share, dividends, capital<br />
structure or other financial items or ratios. Words such as "believes," "anticipates," "expects," "estimates," "intends" and<br />
"plans" and similar expressions are intended to identify forward-looking statements but are not the exclusive means of<br />
identifying such statements. By their very nature, forward-looking statements involve inherent risks and uncertainties,<br />
both general and specific, and risks exist that the predictions, forecasts, projections and other forward-looking statements<br />
will not be achieved. You should be aware that a number of important factors could cause actual results to differ<br />
materially from the plans, objectives, expectations, estimates and intentions expressed in such forward-looking<br />
statements.<br />
These factors include:<br />
CONSOLIDATED FINANCIAL STATEMENTS<br />
inflation, interest rate and exchange rate fluctuations;<br />
the price of oil;<br />
the effects of, and changes in, Russian government policy;<br />
the effects of competition in the geographic and business areas in which we conduct operations;<br />
the effects of changes in laws, regulations, taxation or accounting standards or practices;<br />
our ability to increase market share for our products and control expenses;<br />
acquisitions or divestitures;<br />
technological changes; and<br />
our success at managing the risks of the aforementioned factors.<br />
This list of important factors is not exhaustive. When relying on forward-looking statements, you should carefully consider<br />
the foregoing factors and other uncertainties and events, especially in light of the political, economic, social and legal<br />
environment in which we operate. Such forward-looking statements speak only as of the date on which they are made,<br />
and, subject to any continuing obligations under the Listing Rules of the U.K. Listing Authority, we do not undertake any<br />
obligation to update or revise any of them, whether as a result of new information, future events or otherwise. We do<br />
not make any representation, warranty or prediction that the results anticipated by such forward-looking statements will<br />
be achieved, and such forward-looking statements represent, in each case, only one of many possible scenarios and<br />
should not be viewed as the most likely or standard scenario.<br />
179
<strong>ANNUAL</strong> <strong>REPORT</strong>, <strong>2005</strong><br />
REFERENCE INFORMATION<br />
The most complete and up-to-date information about LUKOIL can always be found on the Company's<br />
website: www.lukoil.ru (Russian) or www.lukoil.com (English).<br />
By visiting the site you can familiarize yourself with trends and results of LUKOIL's business, obtain<br />
accurate, up-to-date information about events concerning the Company and the whole spectrum of<br />
LUKOIL activities, as well as finding out about the Company's social and environmental policies.<br />
The Investor Centre section of the site presents the company's financial and industrial results,<br />
dividend history, share prices, presentations for investors, and Company reports.<br />
Legal Address and Central Office<br />
11, Sretensky Boulevard, Moscow, Russia 101000<br />
Central Information Service<br />
Tel: +7 (495) 627-44-44, 628-98-41<br />
Fax: +7 (495) 925-70-16<br />
Shareholder Relations Department<br />
Tel: +7 (495) 627-48-84, 973-73-46<br />
Fax: +7 (495) 627-41-91<br />
E-mail: shareholder@lukoil.com<br />
Investor Relations Department<br />
Tel: + 7 (495) 627-16-96<br />
Fax: + 7 (495) 981-72-88<br />
E-mail: ir@lukoil.com<br />
Press Service<br />
Tel: +7 (495) 627-16-77<br />
Fax: +7 (495) 627-16-53<br />
E-mail: pr@lukoil.com<br />
LUKOIL Stock Consulting Center<br />
3 (Building 1), Pokrovsky Boulevard, Moscow,<br />
Russia 101000<br />
Tel: + 7 (495) 627-41-91, 627-43-80<br />
Fax: + 7 (495) 627-41-91<br />
NIKOIL Registrar Company<br />
28, 3rd Ulitsa Yamskovo Polya, Moscow,<br />
Russia 125124<br />
Tel/fax: + 7 (495) 755-90-77<br />
LUKOIL <strong>REPORT</strong>S<br />
Electronic versions of the following reports are available at the Investor Centre section of the company<br />
web site (www.lukoil.com/ir)<br />
1. Report on Company Business.<br />
2. Consolidated Financial Accounts.<br />
3. Quarterly Consolidated Financial Accounts.<br />
4. Management's Discussion and Analysis of Financial Condition and Results of Operations<br />
5. Analyst DataBook.<br />
CONCEPTS AND TERMS USED IN THIS <strong>REPORT</strong><br />
Mentions in this Annual Report of "LUKOIL", "LUKOIL Group", "the Group", "LUKOIL", "the Company",<br />
"we" and "our" are equivalent and refer to LUKOIL Group of companies, to LUKOIL and/or its subsidiary<br />
enterprises, depending upon the context, in which the terms are used.<br />
The average rouble/dollar exchange rate for <strong>2005</strong> (28.29 roubles/dollar) is used in conversion of<br />
rouble figures for expression in dollars, unless otherwise indicated.<br />
"Regions" with a capital "R" refers to administrative divisions of the Russian Federation, "regions" with<br />
a small "r" refers to general geographical divisions.<br />
"Reference fuel" is a rough measure to enable comparisons between different types of fuel, based on their<br />
energy content. 1 tonne of reference fuel = one tonne of crude oil = 1,000 cubic meters of natural gas.<br />
ABBREVIATIONS<br />
Boe – barrels of oil equivalent<br />
(1 boe = 6,000 cubic feet of gas)<br />
ppm – parts per million<br />
km – kilometer<br />
mcm – million cubic meters<br />
bcm – billion cubic meters<br />
mcf – million cubic feet<br />
bcf – billion cubic feet<br />
180