Untitled
Untitled
Untitled

You also want an ePaper? Increase the reach of your titles
YUMPU automatically turns print PDFs into web optimized ePapers that Google loves.
Annual Report<br />
2011
Letter to Shareholders 4<br />
LUKOIL in the World 8<br />
Main Operating and Financial Indicators 10<br />
Events in 2011 11<br />
1. Oil & Gas Exploration and Production 16<br />
Licensing 21<br />
Oil and Gas Reserves 22<br />
Geological Exploration 25<br />
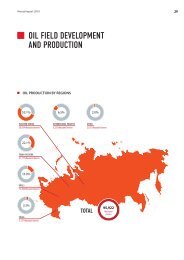
Oil Field Development and Production 33<br />
Stabilizing Production in Western Siberia. The Urals Experience 38<br />
Gas Field Development and Gas Production 48<br />
2. Oil Refining, Gas Processing and Petrochemicals 52<br />
Oil Refining 55<br />
Production of Lubricants 59<br />
Gas Processing 62<br />
Petrochemicals 64<br />
3. Power Generation 66<br />
4. Sales and Marketing 72<br />
Crude Oil Sales 73<br />
Gas Sales 75<br />
Gas Production and Supply Structure 76<br />
Petroleum Product Marketing 77<br />
Trade Balance of LUKOIL Subsidiaries (2011) 82<br />
2
Annual report 2011<br />
5. Technology and Innovation 84<br />
Exploration & Production Technologies 86<br />
Refining Technologies 90<br />
Information Technologies 91<br />
6. Social Responsibility 92<br />
Environment Protection 93<br />
Health and Safety 96<br />
Personnel and Social Programs 97<br />
Sponsorship and Charity 100<br />
7. Corporate Governance and Securities 110<br />
Corporate Governance 111<br />
Board of Directors and Management Committee 112<br />
Committees of the Board of Directors 121<br />
Management Committee of LUKOIL 123<br />
Changes in Group Structure 133<br />
Financial Management 133<br />
Internal Control and Audit 134<br />
Information Disclosure 136<br />
Company Securities 137<br />
Dividends 140<br />
Consolidated Financial Statements 141<br />
Management’s Discussion and Analysis of Financial Condition and Results of Operations 189<br />
Reference Information 230<br />
3
Letter to Shareholders<br />
Dear Shareholders,<br />
In 2011 LUKOIL crossed the threshold into its third<br />
decade of operations, and in September our Company<br />
celebrated 1,500 million tonnes of oil produced since<br />
the Company’s foundation 20 years ago. For us this<br />
is not mere statistics. It stands for an outstanding<br />
labour of generations of oil workers.<br />
In 2011 we managed to reach record levels of a few<br />
financial indicators. Group’s net income reached<br />
$10,357 million, net income per share grew by 21.4%<br />
to $13.3. Free cash flow reached a record level of<br />
$7,240 million in the reporting year. Return on capital<br />
employed amounted to 14%. Company’s net debt<br />
decreased by 28% or by $2.5 billion. LUKOIL enjoys<br />
the highest level of financial stability among Russian<br />
peers.<br />
Growth of shareholders income is a key priority for<br />
us. Dividend payouts for 2010 were 13% higher than<br />
for 2009 and the Board of Directors has recommended<br />
the Annual General Meeting of Shareholders to<br />
approve dividends for 2011 at a level of 75 rubles per<br />
share, offering yield of 4.2%.<br />
Last year was one of reassessment of the road travelled<br />
by our Company and choice of directions for<br />
the future. Many of our fields are at late stages of<br />
development, and this was reflected by a decline<br />
in our overall output of hydrocarbons by 4.4% in 2011,<br />
the first such decline in the last 10 years.<br />
We have responded by developing a new Strategic<br />
Program for 2012-2021, which makes sustainable<br />
production growth into our key priority. Our<br />
hydrocarbon production growth rate should be<br />
no less than 3.5% per annum in the next 10 years.<br />
Most of the growth will come from promising new<br />
projects in Iraq, Central Asia, the Caspian and Yamal-<br />
Nenets Autonomous District. But we will also achieve<br />
growth of production in other, established regions<br />
through substantial increase in the amount of reserves<br />
that are brought into development.<br />
The main goal of the new Program is to increase<br />
income to shareholders. The next decade will see<br />
a major redistribution of the value created by<br />
LUKOIL in favour of its shareholders, increasing the<br />
income which the Company provides to them by<br />
several times.<br />
In order to attain the targets, which the Program<br />
sets, we need to make fundamental improvements<br />
to the efficiency of our business. This is not just<br />
a matter of addressing external factors, such as<br />
ageing of fields, shortage of large-scale oil and<br />
gas deposits and legal barriers to acquisition of new<br />
licenses. These are all elements of extensive growth,<br />
i.e. of business expansion. Certainly, we will do everything<br />
we can in this direction, acquiring and entering<br />
4
Annual report 2011<br />
Valery Grayfer<br />
Chairman of the Board of Directors<br />
of LUKOIL<br />
Vagit Alekperov<br />
President of LUKOIL<br />
new projects, and working with the Government to<br />
lift restrictions on development of large fields, including<br />
offshore fields. But the resources for such<br />
development are ultimately just as exhaustible<br />
as natural resources themselves.<br />
We have reached a turning point, at which our<br />
Company must take the path of intensive growth.<br />
In the first place this implies greater use of new<br />
technologies. Throughout its history LUKOIL has<br />
always invested large amounts in the development<br />
of its technology base and has achieved notable<br />
successes in this direction.<br />
The high standard of Company technologies enables<br />
us to work in the severest of climates beyond the<br />
Arctic circle and at huge sea and ocean depths. We<br />
have carried out offshore projects independently in<br />
the Baltic, the Barents Sea, the Caspian, Ghana, and<br />
Côte d’Ivoire. At present limitations imposed by law<br />
make it impossible for LUKOIL to apply its unique<br />
capabilities – its technological and financial potential<br />
– inside Russia. But we are optimistic that LUKOIL,<br />
as a Russian national private company, will obtain<br />
equal rights with Government-owned companies<br />
in development of the country’s oil and gas resources,<br />
including those located offshore.<br />
However, intensive development is not only a matter<br />
of technology applications. Continued improvements<br />
are also needed in business process<br />
management, work with sub-contractors and<br />
suppliers, energy efficiency, more sparing use<br />
of expendable materials, and lowering of production<br />
and non-production expenses.<br />
The largest part of investment spending associated<br />
with the new Program will be carried out in the next<br />
three to five years. This spending is essential in order<br />
to bring new and promising Company projects to<br />
the development stage. Such projects will be<br />
brought into production in Iraq (West Qurna-2),<br />
the Caspian (the V. Filanovksy field), Western Siberia<br />
(the Pyakyakhinskoye field), Uzbekistan (the Kandym<br />
group of fields) and in other regions. This will create<br />
a basis for sustainable growth of production in the<br />
coming decade.<br />
In the Exploration & Production segment LUKOIL<br />
made substantial progress in 2011 with preparation<br />
for development launches at a number of new<br />
fields, and a total of 170 million boe of contingent<br />
resources were transformed into proved reserves<br />
as a result. Replacement of production by new<br />
proved reserves was more than 100% in 2011. LUKOIL<br />
remains among the Russian and international industry<br />
leaders by volume of proved hydrocarbon<br />
reserves.<br />
Production of hydrocarbons in 2011 was 781 million<br />
boe, which is 4.4% less than in 2010. However,<br />
Company production levels should stabilize in 2012,<br />
5
including production levels in our main operating<br />
region of Western Siberia, and growth of hydrocarbon<br />
production is expected to resume beyond 2013.<br />
LUKOIL already has everything in place to ensure<br />
that this will happen, including a number of large<br />
and promising projects, unique experience of working<br />
in varied climate zones, and accurate geological<br />
and hydrodynamic models of practically all of our<br />
fields.<br />
LUKOIL and Bashneft Oil Company created a joint<br />
venture during the reporting year for development<br />
of the R. Trebs and A. Titov fields in Timan-Pechora.<br />
The fields fit well into the infrastructure, which<br />
LUKOIL has already created in that region. This<br />
synergy will give our partners and us the opportunity<br />
to develop these major fields in the most economically<br />
efficient way possible.<br />
LUKOIL is continuing rapid development of its Refining<br />
& Marketing business segment, with a focus<br />
on growth of operating efficiency, greater refining<br />
depth and high levels of conversion. Crude oil refining<br />
volumes at Company refineries in 2011 were 1,073<br />
barrels per day. The volume was 3.1% less than in<br />
2010 due to scheduled shut-down of the Odessa<br />
Refinery and reduced loading of Company refineries in<br />
Bulgaria and Romania as part of a plan to minimize<br />
operating losses.<br />
There was a huge increase in consumption of<br />
gasoline in Russia during 2011 as a result of growth<br />
in car purchases. The Russian Government took<br />
various measures to address this situation, including<br />
introduction of the ‘60–66’ system, which unifies<br />
export duties for light and dark oil products at 66%<br />
of the duty level for crude oil while keeping a higher<br />
rate of 90% for exports of gasoline. The new system<br />
encourages deeper refining of crude oil, which we<br />
have been working to achieve for a number of years<br />
and will continue to work towards in the future.<br />
The Company is planning to reduce output of dark<br />
petroleum products at its Russian refineries by<br />
2.5 times in the next decade. Implementation of<br />
modernization projects should boost output of<br />
automotive gasoline at LUKOIL’s Russian refineries by<br />
almost 1.5 times in the period to 2021 and refining<br />
depth at Russian facilities will approach 95%.<br />
Work began in 2011 on construction of the first<br />
section of a gas-processing plant, which will be part<br />
of the new gas-chemical complex to be built at the<br />
site of LUKOIL’s chemical subsidiary, Stavrolen.<br />
The complex will have an important role in achieving<br />
the task of maximum utilization of associated oil gas,<br />
as well as creating thousands of jobs and supporting<br />
growth of the entire economy in the surrounding<br />
region.<br />
Much was also done during the reporting year in<br />
LUKOIL’s Power Generating business sector. New<br />
generating capacities were brought into operation<br />
using high-tech equipment. The Group also began<br />
implementation of projects in the renewable energy<br />
sector. LUKOIL’s plans in this sector include construction<br />
and operation of solar and wind generating<br />
stations in Bulgaria, Romania and Uzbekistan. In<br />
Bulgaria LUKOIL has already begun construction of<br />
its first large photovoltaic (solar energy) station with<br />
1.25 megawatt capacity and with scheduled annual<br />
output of 1,500 megawatt-hours. A joint venture<br />
has also been set up with the company ERG for<br />
construction of wind farms in European countries<br />
where incentives for their construction have been<br />
established by law. If Russia passes a law to encourage<br />
development of renewable sources of energy, we<br />
are ready to implement similar projects in our own<br />
country.<br />
As always, personal, environmental, industrial<br />
and social security remains high in the Company’s<br />
list of priorities, and this is reflected in the Strategy,<br />
which has been prepared for the coming decade.<br />
Planned measures include R&D work in the sphere<br />
of industrial safety and employee health, as well as<br />
training, instruction and raising the qualifications<br />
of LUKOIL employees. Improvements will be achieved<br />
through application of the latest information<br />
technologies and creation of a system for compulsory<br />
personnel training. LUKOIL strives to raise the<br />
living standards of its workers year by year, fully<br />
understanding that people are our most valuable<br />
asset and the key to our success. In 2011 LUKOIL<br />
was the winner of the ‘Best Corporate Project’<br />
nomination in the second national project competition,<br />
‘Healthy Russia’. The Competition was founded<br />
by the Russian Ministry of Health and Social<br />
6
Annual report 2011<br />
Development as part of a Government program for<br />
promotion of healthy lifestyles among the Russian<br />
general public.<br />
For our Company the coming decade will be one of<br />
daily invention and application of original, groundbreaking<br />
solutions in all business segments, as well<br />
as optimization of costs, new approaches to work<br />
with investors and shareholders, and fruitful<br />
cooperation with legislators in Russia and other<br />
countries where we do business. We ask you, our<br />
shareholders, to give your backing and support<br />
to LUKOIL as it scales new heights!<br />
Chairman of the Board of Directors of LUKOIL<br />
Valery Grayfer<br />
President of LUKOIL<br />
Vagit Alekperov<br />
Dividend yield, %<br />
Dividend per share, rubles<br />
Basic earnings per share, $<br />
Payout ratio, %<br />
7
LUKOIL in the World<br />
LUKOIL is a major international vertically-integrated oil<br />
and gas company, accounting for 2.1% of global output<br />
of crude oil.<br />
The strong position, which the Company enjoys today,<br />
is the fruit of 20 years work to expand the reserve base,<br />
increasing business scale by seeking out and executing<br />
strategic transactions.<br />
Geological Exploration,<br />
Preparation for Production<br />
Production of Oil, Gas &<br />
Gas Condensate<br />
Oil Refining and Gas<br />
Processing<br />
Petrochemicals<br />
Power Generation<br />
Marketing<br />
8
Annual report 2011<br />
9
Main Operating and Financial Indicators<br />
Main financial and market indicators 2011 2010 Change, %<br />
Sales, $ million 133,650 104,956 27.3<br />
EBITDA, $ million 18,606 16,049 15.9<br />
Net income, $ million 10,357 9,006 15.0<br />
Basic EPS, $ 13.3 10.95 21.4<br />
ROACE, % 14.0 14.0 –<br />
Capital expenditures, $ million 8,492 6,844 24.1<br />
Investments (acquisition of subsidiaries) 1 , $ million 2,860 932 206.9<br />
Share price (MICEX, end of year), rubles 1,701.0 1,742.0 (2.4)<br />
Dividend per share, rubles 75 59 27.1<br />
Main operating indicators<br />
3P oil reserves, million barrels 23,602 22,573 4.6<br />
3P gas reserves, billion cubic feet 36,125 37,821 (4.5)<br />
3P hydrocarbon reserves, million boe 29,623 28,877 2.6<br />
Crude oil production, million barrels 671.4 708.1 (5.2)<br />
Production of marketable natural gas, million cubic meters 12,761 12,770 (0.1)<br />
Production of marketable associated gas, million cubic meters 5,860 5,784 (1.3)<br />
Production of marketable hydrocarbons, thousand boe per day 2,140 2,239 (4.4)<br />
Throughputs at own refineries and at ISAB and TRN, million<br />
tonnes 64.9 66.2 (2.0)<br />
Gas processing, million cubic meters 3,189 3,178 0.3<br />
Production of petrochemicals, million tonnes 1.466 1.036 41.5<br />
Crude oil exports, million tonnes 34.70 40.59 (14.5)<br />
Petroleum product exports, million tonnes 24.00 25.82 (6.9)<br />
Crude oil sales, million tonnes 48.26 51.38 (6.1)<br />
Wholesale sales of petroleum products, million tonnes 87.34 91.02 (4.0)<br />
Retail sales of petroleum products, million tonnes 15.25 14.34 6.3<br />
Number of filling stations (owned, leased and franchises) 5,994 6,508 (7.9)<br />
Average number of employees, thousand 120.3 130.0 (7.5)<br />
Hydrocarbon reserves and production data include Group share in equity affiliates.<br />
1<br />
Including prepayments due to acquisition of subsidiaries and non-cash transactions.<br />
10
Annual report 2011<br />
Events in 2011<br />
FEBRUARY<br />
in the defence sector and other sectors. The parties<br />
also plan to work together to enhance level of<br />
LUKOIL technology base by applying new designs<br />
and products of Russian Technologies State<br />
Corporation, including applications for field<br />
construction and generation of electricity using<br />
associated gas.<br />
A consortium of LUKOIL and the US company Vanco<br />
signs a concession agreement with Romania’s<br />
National Agency for Mineral Resources for<br />
exploration and production at two blocks in the<br />
Black Sea: Est Rapsodia and Trident. The LUKOIL<br />
share in the project is 80% and the remaining<br />
20% is held by Vanco. The consortium won the rights<br />
at a tendering competition in summer 2010. The<br />
blocks are located at sea depths between 90 and<br />
1,000 m. Total area of the blocks is 2,000 km².<br />
LUKOIL and Russian Technologies State<br />
Corporation sign a cooperation agreement<br />
by which LUKOIL will provide fuel resources to<br />
companies and divisions of Russian Technologies<br />
ConocoPhillips completes its withdrawal from<br />
share capital of LUKOIL, selling its remaining shares<br />
in the open market. ConocoPhillips decided at the<br />
end of 2008 to sell its stake in LUKOIL in order to raise<br />
cash to cover debts and for repurchase of its own<br />
shares. In August 2010 LUKOIL bought about 8% of<br />
11
its own shares from ConocoPhillips as part of a<br />
program for raising investment attractiveness and<br />
market capitalization, spending $3.44 billion for the<br />
purpose. ConocoPhillips acquired 7.6% of LUKOIL<br />
shares in 2004 as part of the last stage of Company<br />
privatization. In 2006 ConocoPhillips increased its<br />
stake in LUKOIL share capital to a level of 20%.<br />
march<br />
LUKOIL reaches a long-term agreement with<br />
the petrochemical holding SIBUR on deliveries<br />
of associated gas. Under the terms of the agreement,<br />
LUKOIL will deliver associated gas from the<br />
Company’s fields in Western Siberia to Nyagangazpererabotka,<br />
a processing enterprise owned by<br />
SIBUR. The purpose of the agreement is to achieve<br />
95% use of associated gas extracted by LUKOIL<br />
companies.<br />
LUKOIL approves its Energy Saving Program for the<br />
period 2011–2013. Key commitments of the Program<br />
include use of energy-efficient methods of enhanced<br />
oil recovery and measures to modernize pumping<br />
equipment, including large-scale use of inverterfed<br />
motors for centrifugal and submersible pumps,<br />
as well as reconstruction of pumps used for maintenance<br />
of strata pressure. The Program also includes<br />
plans for implementation of new energy-efficient<br />
technologies and equipment, as well as power<br />
supply production facilities based on cogeneration<br />
units and other energy-saving technologies.<br />
Savings of fuel and energy resources with value of<br />
$350 million should be achieved in three years for<br />
investments of $200 million.<br />
LUKOIL and Gazprom sign an agreement on<br />
deliveries of gas from LUKOIL fields in the<br />
Bolshekhetskaya Depression (Yamal-Nenets Autonomous<br />
District) and the Northern Caspian. Under<br />
the terms of the agreement LUKOIL will supply<br />
natural gas from fields in the Bolshekhetskaya<br />
Depression to Gazprom’s gas transport system in the<br />
period from 2012 to 2016, using the Yamburgskaya<br />
compression station as an access point. Delivery<br />
volumes may vary depending on commissioning<br />
of fields in the Bolshekhetskaya Depression and on<br />
available capacity in the Gazprom transport system.<br />
According to the signed document, Gazprom will<br />
do all in its power to accept gas from fields in the<br />
Northern Caspian after those fields are brought into<br />
operation by LUKOIL and will supply matching volumes<br />
of gas to LUKOIL enterprises under substitution<br />
agreements. Cooperation between LUKOIL and<br />
Gazprom is based on the general agreement on strategic<br />
partnership in 2005–2014, which was signed<br />
by the two companies in March 2005.<br />
april<br />
LUKOIL completes acquisition of 11% in a joint<br />
venture for management of the ISAB oil refining<br />
complex, located in the town of Priolo (Sicily, Italy),<br />
from the company ERG. The transaction increases<br />
LUKOIL’s stake in the JV from 49% to 60%. Price of<br />
the acquisition was $342 million. The ERG board of<br />
directors decided to sell 11% of the JV to LUKOIL in<br />
January 2011 in partial exercise of a sell option held<br />
by ERG in accordance with the agreement on JV<br />
creation in 2008.<br />
A company within LUKOIL Group buys a 50%<br />
interest in the production sharing agreement for<br />
the Vietnam offshore block, Hanoi Trough-02, from<br />
the privately owned oil company Quad Energy S.A.<br />
The НТ-02 block is located on the shelf of the South<br />
China Sea. Geological exploration work has been<br />
underway at the block since 2007 and has discovered<br />
a number of prospects.<br />
12
Annual report 2011<br />
LUKOIL becomes the first oil company in the world<br />
to use aluminium casing and pump-compression<br />
pipes in well construction at a field with high sulphur<br />
and CO 2<br />
gas presence. The technical solution was<br />
applied at the Bayandyskoye field in the Komi Republic,<br />
which has high level of these corrosive substances.<br />
A company in LUKOIL Group signs an agreement<br />
with the Italian company ERG Renew for creation of<br />
a parity-owned JV to work in the renewable energy<br />
sphere. Activities by the JV will focus initially on<br />
Bulgaria and Romania, and will then expand to Ukraine<br />
and Russia.<br />
june<br />
LUKOIL enters the Italian fuel retail market where<br />
it completed rebranding of 19 filling stations under<br />
sub-franchising agreements. In accordance with the<br />
agreements, LUKOIL will supply fuel and lubricants<br />
to the stations, including products made at LUKOIL<br />
facilities. The sub-franchising agreements are for<br />
five years with an option to automatically extend for<br />
a further three years.<br />
LUKOIL holds its Annual General Meeting of<br />
Shareholders. The Meeting approved the Annual<br />
Report for 2010 and accounts for the financial year.<br />
Shareholders approved payment of dividends from<br />
Company profit in 2010 in the amount of 59 rubles<br />
per ordinary share ($1.94 at the exchange rate on<br />
December 31, 2010).<br />
may<br />
july<br />
LUKOIL produces a first batch of Euro-5 automotive<br />
gasoline. This has become possible by commissioning<br />
of a hydrofluoric alkylation unit as part of catalytic<br />
cracking complex at the Nizhny Novgorod Refinery.<br />
Euro-5 gasoline ensures so-called ‘clean exhaust’,<br />
reducing emission of sulphur oxides and the products<br />
of incomplete combustion of aromatics (including<br />
the particularly cancerogenic and mutagenic<br />
benzopyrene).<br />
LUKOIL reaches an agreement for purchase of<br />
a 49% interest in an exploration and development<br />
contract at the offshore deepwater block<br />
SL-5-11 in the territorial waters of Republic of<br />
Sierra Leone from the company Oranto Petroleum.<br />
The obligatory geological exploration program<br />
under the contract implies drilling of one prospecting<br />
well before 2013. Block SL-5-11 has an area of 4,000 km²<br />
and is located on the Atlantic shelf in the territorial<br />
13
waters of Sierra Leone. Water depth at the block<br />
varies from 100 to 3,300 m. 2D and 3D seismic works<br />
have already been carried out and have found<br />
a number of prospective structures with substantial<br />
amounts of crude oil, based on preliminary<br />
estimates.<br />
august<br />
A LUKOIL Group company signs a contract with<br />
Baker Hughes for production drilling and well<br />
launch at the Mishrif formation, part of the West<br />
Qurna-2 field in Iraq. The contract terms are for drilling<br />
and launch of 23 slanted production wells, which<br />
will ensure that commercial production of oil can<br />
begin at West-Qurna-2 as scheduled in conditions<br />
of the service contract for development of the field.<br />
The contract with Baker Hughes is on a turnkey<br />
basis, by which the contractor provides a full range<br />
of drilling and well-launch services and also supplies<br />
the equipment and materials needed for well<br />
construction.<br />
october<br />
LUKOIL begins construction of the first stage of<br />
a gas-processing plant, which will be the core facility<br />
of a gas-chemical complex to be built at the site of<br />
the Company subsidiary, Stavrolen. The principal input<br />
for the gas-chemical complex will be associated<br />
oil gas from fields, which are being developed by<br />
LUKOIL in the Russian sector of the Caspian Sea.<br />
november<br />
14
Annual report 2011<br />
LUKOIL takes 5 th place among energy companies<br />
in Europe, the Middle East and Africa and 10 th<br />
place among global oil and gas leaders in the<br />
Platts Top 250 Global Energy Company Rankings<br />
for 2011. Companies were appraised by four main<br />
criteria: asset size, revenue, level of profit and return<br />
on capital. LUKOIL’s positions in the ranking in 2011<br />
were unchanged from 2010.<br />
december<br />
LUKOIL launches pilot operations at a photovoltaic<br />
generating facility in Bulgaria. The facility is located<br />
close to the city of Burgas on a site of more than<br />
2.5 hectares and has installed capacity of 1.25<br />
megawatts. The produced electricity will be sold<br />
in the open market at a preferential tariff. Pollutant<br />
and greenhouse gas emissions from the photovoltaic<br />
facility are 1,600 tonnes per year less than<br />
from a traditional heat power station with the same<br />
capacity.<br />
A LUKOIL company together with American Vanco<br />
and the Côte d’Ivoire state company PETROCI<br />
Holding made a discovery at the CI-401 block off<br />
the coast of Côte d’Ivoire. The Independance-1X<br />
exploration well, which has been drilled at block<br />
CI-401, reached the target depth and discovered<br />
high-quality sandstones containing light oil and<br />
gas condensate. Independance-1X was drilled at sea<br />
depth of 1,689 m at a distance of 93 km to the southeast<br />
of Abidjan. Independance-1X is the second<br />
exploration well drilled at Block CI-401, which covers<br />
an area of 619 km² with sea depths between 950<br />
and 2,100 m.<br />
A LUKOIL company begins supplies of electric<br />
power in Bulgaria at preferential tariff. Setting of<br />
the tariff became possible after transfer of a LUKOIL<br />
power station in Bulgaria to cogeneration of heat<br />
and electricity (cogeneration is encouraged by<br />
Bulgarian law). The tariff set for electricity from<br />
LUKOIL’s generating facility is twice higher than<br />
the average market level. The new arrangement<br />
is an important breakthrough in LUKOIL’s efforts<br />
to win market share for its power generating business<br />
in foreign countries that offers incentives for<br />
use of efficient electricity and heat generating<br />
technologies.<br />
LUKOIL and Bashneft Oil Company sign an<br />
agreement for acquisition by LUKOIL of a 25.1%<br />
stake in Bashneft-Polyus LLC, which owns licenses<br />
for mineral resources use including the Roman<br />
Trebs and Anatoly Titov oil fields. A joint venture<br />
agreement was also signed. The acquisition was<br />
for a sum of $153 million. The license area has<br />
140.1 million tonnes of recoverable oil reserves in<br />
industrial categories (С1+С2), as recorded in the<br />
Russian State Register of Reserves.<br />
15
1<br />
Oil & Gas Exploration<br />
and Production<br />
16
Annual report 2011<br />
2012–2021 Strategy Program stipulates:<br />
At least 3.5% average annual growth<br />
of hydrocarbon production<br />
Stabilization of production in Western<br />
Siberia<br />
Increase of the oil recovery factor in Russia<br />
More than 80% of all investments to be spent<br />
on Exploration and Production<br />
Substantial increase of international projects<br />
share in total Group production<br />
Substantial increase of gas share in total<br />
Group hydrocarbon production<br />
E&P segment indicators<br />
Indicator, $ million 2011 2010 Change, %<br />
Revenue 44,858 36,523 28.2<br />
EBITDA 12,125 10,848 11.8<br />
Net income 6,665 6,139 8.6<br />
Capital expenditures 6,629 4,908 35.1<br />
The Exploration and Production segment is the main<br />
creator of value for the Company, generating more<br />
than 64% of net income.<br />
The main achievement in 2011 was stabilization<br />
of crude oil production in Western Siberia. Output<br />
in the region ceased to decline at the end of the first<br />
half of the year and remained steady throughout the<br />
second half.<br />
Another important event was the start of development<br />
work at the R. Trebs and A. Titov oil fields in a<br />
joint project with OJSC Bashneft Oil Company. The<br />
2,151 km² license area is located in Nenets Autonomous<br />
District and has recoverable oil reserves of<br />
140.1 million tonnes in industrial categories (С1+С2)<br />
recorded in the Government reserve register. All<br />
crude oil exports from the fields will be carried out<br />
by LUKOIL. Associated gas from the Trebs and Titov<br />
17
fields can be sent to the energy center at the Yuzhno-<br />
Khylchuyuskoye field, where it will be turned into<br />
electricity to power field facilities at Trebs and Titov.<br />
Main achievements in the Company’s foreign projects<br />
during 2011 were associated with development of<br />
the West Qurna-2 field in Iraq. Several tendering competitions<br />
were held, the contract area was demined,<br />
and work started on construction of Pilot Camp (the<br />
shift camp for West Qurna-2). West Qurna-2 is one<br />
of the largest undeveloped fields in the world.<br />
Another important step forward in LUKOIL’s foreign<br />
business in 2011 was the start of early-gas production<br />
at the Dzharkuduk-Yangi Kyzylcha field as part of<br />
the Gissar project in Uzbekistan. Additional exploration<br />
(seismic and exploration drilling) led to increase<br />
of reserves, discovery of several prospective structures,<br />
the discovery of two new fields (South-East<br />
Kyzylbairak and Shamoltegmas), preparation of two<br />
structures for drilling, and confirmation of sizeable<br />
industrial gas reserves at a previously little studied<br />
sector of the large-scale Adamtash field.<br />
Price and tax environment<br />
Crude oil market<br />
Prices for crude oil were event-driven through most<br />
of 2011. The main factors with impact on oil prices<br />
were political instability in the Middle East, and debt<br />
problems in the USA and the eurozone. The wave of<br />
revolutions in Middle East countries, and particularly<br />
in Libya, during the first quarter of 2011 had major impact<br />
on world oil prices. The Brent price reached its<br />
highest point of the year ($126.7 per barrel) in April,<br />
after increasing by 35% from the start of January.<br />
However, the Middle East events were already priced<br />
in by crude oil markets at the start of the second quarter<br />
and further events in that region had almost no<br />
impact on global supply volumes.<br />
Reduction of supply in the first quarter gave way to<br />
demand-side issues as the main driver for oil price<br />
levels in the rest of the year. Debt problems in the<br />
eurozone, which had already been apparent in previous<br />
years, came to a head in the second quarter of<br />
2011. Countries with particularly severe debt problems<br />
were forced to consider budget cuts, which had<br />
negative impact on expectations for levels of crude oil<br />
demand on international markets. A similar situation<br />
came to pass in August in the USA, where record debt<br />
levels led to lowering of the country’s credit rating<br />
and fears of a second wave of the international financial<br />
crisis. These problems caused a sustained negative<br />
trend in world oil prices and by the end of the year<br />
the Brent price had fallen 16% from the April peak.<br />
However, the price at the end of 2011 was 14% higher<br />
than a year earlier ($106.5 compared with $93.7 per<br />
barrel) and the average price in 2011 was $111.3 per<br />
barrel or 40% more than in 2010.<br />
The Company’s main operating areas, accounting for<br />
about 93% of oil production, are the Russian oil and<br />
gas provinces of Western Siberia, Southern and Central<br />
Russia, and Timan-Pechora. Prices for Russian Urals<br />
export blend therefore had direct impact on financial<br />
results. The Urals price rose by 39.4% compared<br />
with 2010 and averaged $109.09 during the reporting<br />
year. The average discount of Urals to Brent in 2011 was<br />
$2.2 per barrel compared with $1.2 in 2010.<br />
For an objective assessment of the Company’s operating<br />
environment in 2011, it is important to take<br />
account of the tax burden on Russian oil exporters<br />
and changes in the burden compared with 2010. The<br />
main forms of taxation for oil companies in Russia<br />
including LUKOIL are mineral extraction tax (MET),<br />
excises and export duties. Applicable tax rates for oil<br />
companies in Russia are tied to world prices for crude<br />
oil and follow changes in world prices.<br />
Growth of oil prices in 2011 caused the average<br />
MET rate (in dollar terms) to grow by 49.7% in comparison<br />
with 2010 to a level of $20.69 per barrel.<br />
The Company pays export duty on crude oil exports<br />
from Russia which is calculated by using a progressive<br />
scale based on the Urals crude price. Crude oil export<br />
duty rose by 49.6% in 2011 and the average duty<br />
rate during the year was $55.8 per barrel. The Urals<br />
crude price net of tax for a Russian exporter (the international<br />
market price less export duty and MET) was<br />
$32.6 per barrel in 2011. The share of MET and export<br />
duty in the average annual price of crude oil was 70.1%.<br />
18
Annual report 2011<br />
Taxes in projects that are governed by production<br />
sharing agreements continue to be paid in accordance<br />
with the terms of those agreements.<br />
Revenue structure of a Russian crude oil exporter,<br />
$ per barrel<br />
Most of LUKOIL’s gas production is in Russia and<br />
most of the Company’s marketable gas output is sold<br />
to Gazprom and to other Russian consumers.<br />
The greater part of LUKOIL’s Russian gas output is sold<br />
at the well and then transported through the Unified<br />
Gas Supply System, which is owned by Gazprom.<br />
LUKOIL cannot export gas, due to Gazprom’s ownership<br />
of the Supply System and its monopoly on<br />
exports. The Company pays gas MET on its production<br />
of gas in Russia, and the rate of this tax increased<br />
by 61% during 2011 to a level of 237 rubles per thousand<br />
cubic meters.<br />
Production of marketable gas in international projects<br />
was 4.8 billion cubic meters, of which more<br />
than 54% was produced at the Khauzak-Shady field<br />
in Uzbekistan. Gas from Khauzak-Shady is sold at an<br />
official price, fixed by agreements between Russia<br />
and Uzbekistan. A royalty is paid on production at a<br />
rate of 30% as part of the production sharing agreement<br />
(PSA). LUKOIL has a seven-year holiday from<br />
income tax, beginning from the start of production,<br />
at the end of which income tax will also be payable at<br />
the rate fixed in the PSA. The Uzbek Government share<br />
in profit production varies depending on the project’s<br />
internal rate of return for LUKOIL Group.<br />
Gas market<br />
There was no clear trend in spot prices for gas in<br />
Europe during 2011. Prices saw volatility in the second<br />
half of the year as a result of abnormal weather, which<br />
affected levels of consumption in Europe. Gas prices<br />
fell by about 15% at various trading floors in Europe<br />
during 2011. However the average annual price in<br />
2011 on various European markets was 30–50% higher<br />
than in 2010.<br />
The opposite situation was observed in the USA,<br />
where prices for gas fell for most of the year. Supply<br />
in the USA continues to outrun demand due to excess<br />
production of shale gas, and the excess supply<br />
continued to have impact on gas prices in 2011, causing<br />
declines to a 10-year minimum. US spot prices fell<br />
by almost 30% in 2011, and the average annual price<br />
was 9% lower than in 2010.<br />
Natural gas produced as part of the Karachaganak<br />
project in Kazakhstan is supplied to the Orenburg<br />
Gas-processing Plant. Taxation in this project is specified<br />
by terms of the PSA<br />
Gas produced at the Shakh-Deniz field is supplied to<br />
the domestic market in Azerbaijan and also via the<br />
Southern Caucasus pipeline to Georgia and Turkey,<br />
where it is sold at market prices. Under terms of<br />
the PSA in Azerbaijan, LUKOIL is exempt from payment<br />
of taxes in cash on production and export of gas.<br />
The only significant tax paid by the Company is<br />
income tax at a fixed rate (the tax is withheld as a<br />
share of production).<br />
Inflation and exchange rates<br />
LUKOIL Group produces most of its hydrocarbons<br />
inside Russia, so the largest part of Company costs<br />
is in rubles, while a significant share of revenues is<br />
expressed in US dollars or is tied to dollar oil prices<br />
19
to a significant extent. So ruble inflation and fluctuation<br />
of the exchange rate can have substantial<br />
impact on Company results. Purchasing power of the<br />
US dollar in Russia, calculated from the $/ruble exchange<br />
rate and the Russian inflation rate, declined<br />
by 12% in 2011 compared with 2010.<br />
This development was one of the main causes of<br />
growth in unit lifting costs in Russia last year: unit costs<br />
rose from $4.11 to $4.7 per boe, or by 14.4%. Average<br />
unit lifting costs for the Group increased by 14.3%<br />
from $4.12 to $4.71 per boe in 2011. Capital expenditures<br />
in the Exploration and Production segment rose<br />
by 35.1% to $6.6 billion.<br />
Acquisition of assets<br />
LUKOIL bought a 50% interest in a production sharing<br />
agreement at the offshore block, Hanoi Trough-02,<br />
in Vietnam from the privately owned oil company<br />
Quad Energy S.A. The НТ-02 block is located on the<br />
shelf of the South China Sea. Geological exploration<br />
work has been underway at the block since 2007 and<br />
a number of prospects have been discovered.<br />
The Company reached an agreement for purchase<br />
of a 49% interest in an exploration and development<br />
contract at the offshore deepwater block SL-5-11<br />
in the territorial waters of the Republic of Sierra Leone<br />
from the company Oranto Petroleum. The obligatory<br />
geological exploration program under the contract<br />
implies drilling of one prospecting well before 2013.<br />
Block SL-5-11 has area of 4,000 km² and is located<br />
on the Atlantic shelf in the territorial waters of Sierra<br />
Leone. Sea depth at the block varies between 100<br />
and 3,300 m. 2D and 3D seismic works have already<br />
been carried out and have found a number of<br />
prospective structures with substantial crude oil<br />
resources, based on preliminary estimates.<br />
LUKOIL and Bashneft Oil Company signed an<br />
agreement for acquisition by LUKOIL of a 25.1%<br />
stake in Bashneft-Polyus, which owns licenses for<br />
mineral resources use including the Roman Trebs and<br />
Anatoly Titov oil fields. A joint-venture agreement<br />
was also signed. The acquisition was for a sum of<br />
$153 million. Bashneft-Polyus also signed an agreement<br />
to acquire 29 prospecting and exploration<br />
wells at the above-mentioned fields from LUKOIL for<br />
$60 million. Bashneft and LUKOIL thus finalized the<br />
creation of a joint venture for development of the<br />
Trebs and Titov oil fields and advanced to the active<br />
stage of project implementation. The 2,151 km²<br />
license area is located in Nenets Autonomous District<br />
and has 140.1 million tonnes of recoverable oil reserves<br />
in industrial categories (С1+С2), as recorded in<br />
the Russian State Reserve Register.<br />
20
Annual report 2011<br />
Licensing<br />
The Group continued its work in 2011 to obtain new<br />
licenses for mineral use and to optimize its existing<br />
license portfolio in order to raise overall quality of<br />
the reserve base. LUKOIL obtained amendments<br />
and additions to conditions of its mineral use rights,<br />
extending the period of validity of its rights in some<br />
cases, as well as clarifying commitments of the<br />
Group companies to achieve specific output levels in<br />
accordance with project documentation.<br />
LUKOIL Group companies had 426 licenses<br />
on their balance sheets as of January 1,<br />
2012, of which 338 were for exploration &<br />
production of hydrocarbons, 22 were for<br />
geological study, including prospecting<br />
and evaluation of mineral fields, and 66<br />
were for geological study, exploration<br />
& production of raw hydrocarbons.<br />
The Company obtained 11 new licenses for use of<br />
mineral resources in 2011, of which five give rights<br />
for geological study, exploration & production of<br />
raw hydrocarbons, five are licenses for geological<br />
study of mineral areas in response to application<br />
by the mineral resources user, and one license is<br />
for geological study of a mineral area based on<br />
a Government contract.<br />
LUKOIL surrendered six licenses for use of mineral<br />
resources during 2011, of which two were surrendered<br />
due to ending of the permitted period for<br />
geological study, and four were surrendered when<br />
it was found that development of the relevant areas<br />
would be economically inefficient.<br />
The Company obtained reissue of 91 licenses for<br />
mineral use during the reporting period in connection<br />
with further restructuring of its oil production subsidiaries.<br />
Work continued in 2011 on amendments and additions<br />
to current license agreements concerning terms<br />
of mineral resource use at LUKOIL’s license areas.<br />
A total of 34 amendments/additions were obtained,<br />
including 19 additions to licenses extending the<br />
period of their validity (13 of these licenses are for<br />
production and six are for study of mineral resources).<br />
During 2011 the Company took part in six auctions<br />
for mineral use rights, and won four of the auctions.<br />
Two auctions were declared invalid because only one<br />
bid was received, and the Company has submitted<br />
applications to obtain licenses for geological study<br />
of the relevant mineral fields in return for a direct<br />
payment by the mineral user. The licenses will be<br />
obtained in 2012.<br />
21
Oil & Gas Reserves<br />
3P Oil & Gas Reserves of LUKOIL Group by Regions in 2011<br />
22
Annual report 2011<br />
Reserve replacement is fundamental to long-term,<br />
sustainable development of the Company. LUKOIL<br />
Group carries out extensive geological exploration<br />
work in Russia and abroad in order to increase<br />
its reserves, and constantly monitors new projects<br />
and assets, which could represent acquisition<br />
targets.<br />
According to data audited by Miller<br />
and Lents (USA), the Company’s 3P reserves<br />
of hydrocarbons as of January 1, 2012 were<br />
29.623 billion barrels of oil equivalent<br />
(boe), consisting of 23.602 billion barrels<br />
of oil and 36.125 trillion cubic feet of gas.<br />
The audit was carried out to the standards of the<br />
US Securities and Exchange Commission (SEC).<br />
The Company decided in 2009 to adopt SEC standards<br />
for measurement of reserves in order to ensure<br />
greater transparency and comparability of Group<br />
reserve figures with those of competitors.<br />
In accordance with SEC requirements, proved reserves<br />
that are not in development can only be recognized<br />
if there is an approved development plan. The plan<br />
must call for reserve development to begin within<br />
five years, unless specific circumstances justify a<br />
longer period before the start of development. Audit<br />
was carried out as prescribed by SEC standards up to<br />
attainment of profit production thresholds.<br />
LUKOIL also completed an appraisal of contingent<br />
resources under PRMS. As of December 31, 2011 the<br />
Company had 3C contingent resources of 10.3 billion<br />
boe. The Company’s 25.1% interest in Bashneft-<br />
Polyus was included in this figure for the first time<br />
(the LLC is a joint venture between LUKOIL and Bashneft<br />
Oil Company for development of the R. Trebs<br />
and A. Titov fields).<br />
It is expected that prospective volumes of oil and<br />
gas, which are classified as contingent, will be transferred<br />
to reserves as the time for their development<br />
approaches, as the Company’s associated gas utilization<br />
program moves forward, and as new technologies<br />
make production of hard-to-recover reserves<br />
commercially viable.<br />
The greater part of the Company’s proved reserves<br />
of oil are in Western Siberia, the Timan-Pechora oil<br />
and gas province and the Urals region. The main part<br />
of proved gas reserves are in the Bolshekhetskaya<br />
Depression (Western Siberia), Uzbekistan and the<br />
Caspian region. 60% of Company proved reserves<br />
are in development (65% of oil reserves and 41%<br />
of gas reserves). This reserve structure reflects large<br />
potential of the Company to increase production in<br />
the medium term, particularly production of gas.<br />
Most of the Company’s proved hydrocarbon reserves<br />
are conventional. Only about 4.3% of total proved<br />
hydrocarbon reserves (3.8% of 3P reserves) consist<br />
of high-viscosity oil and 4.7% (6.0% of 3P reserves)<br />
are at offshore fields. This reserve structure enables<br />
the Company to control development costs in an<br />
efficient manner and to bring new fields into production<br />
rapidly.<br />
Replacement of production by proved reserves<br />
exceeded 100% in 2011. Growth of proved hydrocarbon<br />
reserves in 2011 as a result of geological exploration<br />
work, production drilling and acquisitions was<br />
619 million boe, of which growth due to geological<br />
exploration work and production drilling was<br />
612 million boe, and 7 million boe were added as a<br />
result of acquisitions. So organic growth of reserves<br />
compensated 76.3% of hydrocarbon production<br />
(77.5% for oil and 70.4% for gas). Organic growth<br />
of proved oil reserves in Russia was 516 million barrels<br />
(99% of the total growth) and 4 million barrels in<br />
the international projects (1% of the total growth).<br />
Organic growth of proved gas reserves in Russia was<br />
310 billion cubic feet (56% of the total gas growth)<br />
and 240 billion cubic feet in the international projects<br />
(44% of the total gas growth).<br />
Proved reserves increased by 197 million boe due<br />
to revision of previous estimates.<br />
There was substantial progress during 2011 in preparation<br />
for launch and development of a number<br />
of Company fields, enabling reclassification of 170 million<br />
boe of contingent resources as proved reserves.<br />
However, faster decline of production at the Yuzhno-<br />
Khylchuyuskoye field compared with earlier forecasts<br />
led to reduction of proved reserves by 147 million boe.<br />
23
LUKOIL remains among Russian and<br />
international leaders by volumes of<br />
proved hydrocarbon reserves. The Group’s<br />
ratio of proved hydrocarbon reserves<br />
to production is 22 years (20 years for oil<br />
and 30 years for gas).<br />
3P crude oil reserves, billion boe<br />
3P hydrocarbon reserves and contingent<br />
resources, billion boe<br />
3P gas reserves, trillion cubic feet<br />
Oil & gas reserves of LUKOIL Group<br />
January 1, 2012 Oil Gas Hydrocarbons 1<br />
million barrels billion cubic feet million boe<br />
Proved reserves 13,403 23,196 17,269<br />
including:<br />
Developed 8,772 9,478 10,352<br />
Undeveloped 4,631 13,718 6,917<br />
Probable reserves 6,669 10,476 8,415<br />
Possible reserves 3,530 2,453 3,939<br />
Total 3P reserves 23,602 36,125 29,623<br />
1<br />
Conversion ratio from cubic feet to barrels: 1 barrel = 6,000 cubic feet.<br />
24
Annual report 2011<br />
Geological Exploration<br />
Main Geological Exploration Regions of LUKOIL Group<br />
25
Exploration drilling by regions (2011)<br />
Main prospecting projects 2011, carried out in<br />
fulfilment of earlier established tasks, were as<br />
follows:<br />
• Further exploration work at the Tsentralno-<br />
Astrakhanskoye gas and condensate field<br />
• Continuation of prospecting and exploration<br />
work in the offshore Caspian to assess oil and gas<br />
prospects in Neocomian sediments<br />
• Continuation of prospecting work to study<br />
geological structure and oil and gas potential<br />
at the Denisovskaya Depression in the Komi<br />
Republic<br />
• Prospecting work for study of oil and gas<br />
prospects on the West African deep-water shelf<br />
and in the Aral region<br />
Geological exploration work by companies of<br />
LUKOIL Group in 12 countries around the world is<br />
focused on replacement of production with new<br />
commercial reserves of hydrocarbons, and preparation<br />
of reserves for rapid launch and expansion of<br />
production in promising regions, both in Russia and<br />
abroad. The Company uses the latest technologies<br />
in order to maximize efficiency of its geological<br />
exploration work.<br />
The largest part of geological exploration work<br />
to discover oil and gas was in districts of Western<br />
Siberia, the Timan-Pechora oil and gas province, Perm<br />
Territory, the Volga, Astrakhan Regions, the offshore<br />
Caspian and as part of foreign projects.<br />
Geological exploration work in other regions was<br />
focused on preparation and reconnaissance of<br />
prospective new geological targets and additional<br />
exploration at fields, which were discovered earlier.<br />
The Company carried out a substantial amount of<br />
2D seismic work in 2011 to locate and detail geological<br />
3D seismic, km 2<br />
2D seismic, km<br />
26
Annual report 2011<br />
structures and to prepare for drilling of prospecting<br />
and exploration wells, shooting a total of 6,061 km<br />
of 2D profiles. Volumes of 3D seismic were 4,312 km 2 .<br />
Quality of our seismic work and speed of processing<br />
and interpretation have improved in recent years,<br />
particularly due to application of new computer<br />
technologies. High standards of the Group’s seismic<br />
work are demonstrated by success rates of about<br />
70% in prospecting and exploration drilling.<br />
LUKOIL completed 246.5 km of electrical exploration<br />
in 2011. Vertical seismic profiling, which enables<br />
detailing of geological structure around an existing<br />
well, was carried out at 15 wells. Total exploration<br />
drilling in 2011 amounted to 159,000 m, and efficiency<br />
was at a high level of 1,076 tonnes of conditional fuel<br />
per meter. A total of 48 prospecting and exploration<br />
wells were completed in 2011, of which 33 were<br />
productive.<br />
Group companies discovered 6 fields in 2011<br />
(Vostochno-Lambeishorskoye in the Komi Republic,<br />
Nikulinskoye in Perm Territory, Yuzhno-Eityanskoye<br />
in Western Siberia, Yuzhno-Stanovoye and Yurevskoye<br />
in Volgograd Region, and Independance in<br />
Côte d’Ivoire), as well as 20 new deposits at fields that<br />
are already in development.<br />
Increase of proved reserves under SEC classification<br />
through geological exploration and additional information<br />
obtained in the course of production drilling<br />
amounted to 612 million boe. Organic growth of proved<br />
oil reserves was 516 million barrels (99% of the<br />
total growth) and 4 million barrels at the international<br />
projects (1%). Gas reserve growth in Russia amounted<br />
to 310 billion cubic feet (56% of the total gas growth)<br />
and 240 billion cubic feet in the international projects<br />
(44%). Spending by LUKOIL Group on geological<br />
exploration work in 2011 was $873 million including<br />
share in equity affiliates.<br />
Russia<br />
Total 121,000 meters of exploration drilling was carried<br />
out in Russia during 2011, 2D seismic exploration<br />
was 5,463 km and 3D seismic was 4,309 km 2 . Spending<br />
on geological exploration in Russia was $366 million.<br />
Western Siberia<br />
Khanty-Mansiysk Autonomous<br />
District (Yugra)<br />
The Khanty-Mansiysk Autonomous District (Yugra)<br />
is the main oil production base of LUKOIL Group.<br />
The chief aim of geological exploration work there<br />
is replacement of reserves in order to maintain the<br />
Group’s current production levels in the region.<br />
Although reserves in the region have been extensively<br />
explored, geological exploration work there is<br />
particularly efficient and productive.<br />
Exploration drilling in the District totalled 42,700<br />
meters in 2011 and 14 wells were completed, of which<br />
12 were productive. The success rate of exploration<br />
drilling was 86%. The Company shot 907 km<br />
Electric exploration, km<br />
Spending on geological exploration, $ million<br />
27
of 2D seismic and 1,936 km 2 of 3D seismic in the<br />
course of the year. Most of the work was in peripheral<br />
areas of large fields, and was aimed at detailing oil<br />
and gas contours and identifying oil saturation in<br />
strata prior to production drilling.<br />
LUKOIL identified 8 new deposits at previously<br />
discovered fields in the region during 2011. Largest<br />
growth of oil reserves was at the Kogalimskoye field<br />
(+1.8 million tonnes) and Nong-Eganskoye field<br />
(+1.4 million tonnes), thanks to 3D work and exploration<br />
drilling. Proved hydrocarbon reserves of the<br />
Company in the Khanty-Mansiysk Autonomous<br />
District to SEC standards were 7.3 billion boe<br />
(3P reserves were 13.6 billion boe). Significant oil inflows<br />
were obtained at a number of fields.<br />
A prospecting well at the Svobodnoye field obtained<br />
oil inflows of 857 barrels per day from the Vasyugan<br />
suite at a dynamic level of 1,846 m. Testing of an<br />
exploration well at the Tevlinsko-Russkinskoye field<br />
gave free flow of oil of 392 barrels per day from Jurassic<br />
sediments using a 6-mm choke.<br />
An exploration well was drilled at the Vostochno-<br />
Perevalnoye field, located on the territory of the<br />
Nadezhdinsky license area, and oil inflow of 400 barrels<br />
per day was obtained from achimian sediments.<br />
The well has been brought into production.<br />
A new oil field was discovered in 2011 by drilling of<br />
a prospecting well at the Yuzhno-Eityanskoye<br />
elevation. Cased-hole testing of the T1 Tyumen suite<br />
gave an oil inflow of 138 barrels per day.<br />
Yamal-Nenets Autonomous<br />
District<br />
LUKOIL is developing gas reserves at the<br />
Bolshekhetskaya Depression in the Yamal-Nenets<br />
Autonomous District as part of its program for<br />
accelerated growth of gas production. The Company<br />
is also working at the Severo-Gubkinskoye,<br />
Prisklonovoye, and Yuzhno-Tarasovskoye oil and gas<br />
condensate fields, as well as the Urabor-Yakhinsky<br />
and Vansko-Namyssky areas.<br />
Industrial inflows of gas and condensate have been<br />
obtained from testing of wells №304 and 2022 at the<br />
Pyakyakhinskoye field.<br />
Testing of well №304 discovered 5 new gas condensate<br />
deposits at the Pyakyakhinskoye field. The strongest<br />
flow of separation gas was at a level of 123,000<br />
cubic meters per day, with 124 barrels of stable condensate<br />
per day using a 12-mm choke.<br />
Testing of well №2022 at the Pyakyakhinskoye field<br />
gave a free flow of gas condensate. In the course of<br />
studies a flow of separation gas at a rate of 169,800<br />
cubic meters per day was obtained using a 10.2-mm<br />
choke. Flow of stable condensate was 122 barrels<br />
per day.<br />
Timan-Pechora<br />
Timan-Pechora (the Nenets Autonomous District<br />
and Komi Republic) is a promising region for oil<br />
production by the Company. The region is little<br />
Exploration drilling, thousand meters<br />
Hydrocarbon reserve extensions and discoveries,<br />
million boe<br />
28
Annual report 2011<br />
studied, with high potential for new discoveries,<br />
and the Company carried out extensive geological<br />
exploration work there during 2011. Volumes of 2D<br />
and 3D seismic work during 2011, for clarification<br />
of geological models, were 627 km and 1,108 km 2 ,<br />
respectively, and exploration drilling was 20,900 m.<br />
Prospecting and exploration drilling in Komi Republic<br />
amounted to 17,000 m in 2011 and 3 wells were<br />
completed, all of which gave production. The drilling<br />
success rate was 100%.<br />
The Vostochno-Lambeishorskoye field was discovered<br />
in the Komi Republic. Two wells that were drilled<br />
at the field confirmed the presence of industrial oil<br />
deposits in riphean limestones from the zadonsk era.<br />
Open-hole testing gave an inflow of pure light crude<br />
oil at a rate of 6,300 barrels per day. Recoverable<br />
С1+С2 reserves discovered at the field in the reporting<br />
year were 21.9 million tonnes, 3P reserves were<br />
53 million barrels.<br />
In the Nenets Autonomous District testing of an<br />
exploration well was completed at the Oshskoye field<br />
and free flowing oil was obtained at a rate of 1,057<br />
barrels per day.<br />
Geological exploration work and additional<br />
information obtained in the course of production<br />
drilling added 96 million barrels of proved reserves to<br />
international standards in Timan-Pechora during 2011.<br />
Urals<br />
The Urals is a traditional production region for the<br />
Company, and reserves in the region have been<br />
extensively explored. LUKOIL carried out 590 km of<br />
2D seismic and 341 km of 3D work in the region for<br />
geological purposes during 2011. Exploration drilling<br />
totalled 14,700 m. Exploration drilling to discover<br />
new fields and increase reserves was carried out<br />
mainly in the vicinity of sites with established<br />
commercial oil presence.<br />
In Perm Territory construction of 5 wells was<br />
completed and all of them were productive. The<br />
success rate in exploration drilling was 100%. At the<br />
Yenapayevskaya and Zabrodovskaya areas two wells<br />
were completed and testing was begun. In tests<br />
all of the wells gave flows from productive strata at<br />
daily rates between 22 and 435 barrels. One new field<br />
was discovered in 2011 – the Nikulinskoye field, –<br />
where testing gave maximum oil flow of 400 barrels<br />
per day.<br />
Volga (onshore)<br />
The Volga is another traditional hydrocarbon<br />
production region for LUKOIL and its geology has<br />
been extensively studied. Exploration drilling in 2011<br />
was 17,700 m. 2D seismic during 2011 amounted to<br />
1,634 km, and 3D was 225 km².<br />
Drilling work was continued in Volgograd Region<br />
during 2011 at Avilovskaya well №10 and drilling of<br />
exploration well Avilovskaya №8 was begun. Well<br />
№44 at the Vysotskoye field was completed and<br />
cased-hole testing of Tula sediments gave inflows of<br />
gas at a maximum daily rate of 290,000 cubic meters.<br />
Construction of Levoberezhnaya well №6 was also<br />
completed and sampling of a Sennovian horizon gave<br />
sustained free flow of water-free oil and gas at a rate<br />
of 349 barrels per day, while testing of a Khovanian<br />
horizon gave an inflow of oil at a rate of 604 barrels<br />
per day. As a result the Yurievskoye field with С1+С2<br />
reserves of 1 million tonnes was discovered.<br />
Additional studies at the reopened Nizhnekorobkovskiye<br />
wells №23 and №27, which were drilled at the<br />
start of the 2000s at the Yuzhno-Stanovaya structure,<br />
led to discovery of the Yuzhno-Stanovoye field with<br />
С1+С2 recoverable reserves of 632,000 tonnes. Testing<br />
of Bobrikov and Yevlanovo-Livensk sediments<br />
gave pure oil inflows at rates of up to 250 barrels<br />
per day.<br />
Construction work on Tsentralno-Astrakhanskaya well<br />
№3 continued at the Tsentralno-Astrakhanskoye<br />
field. Bottom-hole depth at the end of 2011 was<br />
4,007 m. The well has been cased and is due to be<br />
developed in 2012. 3D seismic work at the field<br />
continued in 2011 when total 355 km 2 was carried out.<br />
In Tatarstan oil inflow at a rate of 201 barrels per day<br />
was obtained from a well at the Olginskoye field,<br />
which is part of the Agryzsky license area. At the<br />
29
Ozerny license area in-hole testing of the Bobrikov<br />
horizon gave a viscous oil inflow of 57 barrels per day.<br />
Northern Caspian<br />
gave daily gas inflows of 400,000 cubic meters per<br />
day and 618 barrels per day of condensate. Testing of<br />
stratum I gave a gas flow of 1,094,000 cubic meters<br />
per day and 209 barrels of condensate per day.<br />
The increase of C1 gas reserves at the Sarmatskoye<br />
gas field was 55.6 billion cubic meters.<br />
Kaliningrad Region<br />
LUKOIL companies carried out geological exploration<br />
work in 2011 in Kaliningrad Region, both onshore<br />
and offshore (in the Baltic Sea). Total 3,300 m of drilling<br />
was carried out. Specialists also completed 442 km<br />
of 2D seismic work at all license areas in preparation<br />
for deep drilling.<br />
Drilling of a prospecting well at the D-41 structure<br />
was suspended at bottom-hole depth of 1,350 m<br />
pending alterations to the project plan in order to<br />
reduce risks associated with large step-out in directional<br />
drilling.<br />
The Northern Caspian is one of the key regions for<br />
increase of oil and gas production by LUKOIL in<br />
the medium term and the Company attaches great<br />
importance to development of resource potential in<br />
the region.<br />
In the offshore Caspian two wells were completed<br />
and both were productive, so the success rate in<br />
prospecting and exploration drilling was 100%.<br />
Rakushechnaya well №8 was completed with bottomhole<br />
at a depth of 1,650 m and industrial oil inflow<br />
was obtained from testing of the oil-saturated part<br />
of a Neocomian reservoir with maximum daily inflow<br />
rate of 2,969 barrels per day. An Aptian oil deposit<br />
was tested and hydrofracturing of strata was used to<br />
enhance flow rates for the first time in offshore work.<br />
Maximum daily flow rate before hydrofracturing<br />
was 28 barrels per day, and the rate increased to 282<br />
barrels per day after the operation. Well №2 at the<br />
Sarmatskaya structure was completed with bottomhole<br />
at 3,330 m. Drilling results confirmed productivity<br />
and discovered expansion of the gas contour.<br />
The production string was tested in three productive<br />
strata of the Titon tier. Joint testing of strata II and III<br />
International projects<br />
LUKOIL’s strategic development program implies<br />
intensive development of international operations in<br />
the Exploration and Production segment. The main<br />
task of geological exploration by the Company outside<br />
Russia is to prepare the resource base for<br />
rapid launch of production. Exploration drilling in<br />
international projects with LUKOIL participation was<br />
37,855 meters in 2011. 2D seismic work in international<br />
projects in 2011 totalled 598 km and 3D work was<br />
3.98 km 2 . Spending on geological exploration outside<br />
Russia was $507 million. LUKOIL was involved in<br />
geological exploration drilling in 11 countries outside<br />
Russia by the end of 2011: Kazakhstan, Saudi Arabia,<br />
Egypt, Uzbekistan, Romania, Vietnam, Colombia,<br />
Venezuela, Côte d’Ivoire, Ghana and Sierra Leone.<br />
A total of 11 wells were completed during 2011 as part<br />
of these projects, of which three were productive.<br />
Drilling of a third exploration well was finished in 2011<br />
at the Kungrad block (part of the Shege structure) in<br />
Uzbekistan. Well studies in open borehole using an<br />
30
Annual report 2011<br />
MDT device obtained inflows of gas. Testing of well<br />
Shege-3 is scheduled for completion in 2012, after<br />
which a decision will be made on further work.<br />
wells, preparation of a drilling pad and approach<br />
roads, and the start of drilling work on a prospecting<br />
well and the first production wells.<br />
Drilling of wells Kuvachi-7 and Parsankul-9 was<br />
completed during 2011 at the Kandym block. Testing<br />
of Kuvachi-7 gave industrial inflows of gas and<br />
condensate at a daily rate of 165,000 cubic meters.<br />
Testing of Parsankul-9 will be carried out in 2012.<br />
Drilling of well Parsankul-10 has begun. A project for<br />
2D and 3D seismic work has been prepared and a subcontractor<br />
is being selected to carry it out.<br />
In the South-West Gissar project in Uzbekistan<br />
drilling and testing of well Shamoltegmas-4 was<br />
completed during 2011. A total 598 km of 2D work has<br />
been carried out ahead of schedule. Gas inflows of up<br />
to 198,000 m 3 per day were obtained. Drilling work on<br />
prospecting well Shurdarye-2 began in December 2011<br />
and will be completed in 2012, when well Navruz-1<br />
will also be drilled. 3D seismic work will start in 2012<br />
and recommendations will be prepared for appraisal<br />
drilling at the Shurdarye and Navruz structures.<br />
Drilling of well Shagala-1 enabled complete evaluation<br />
of the eastern part of Aral prospects as part of<br />
the Aral project in the Uzbek sector of the Aral Sea.<br />
Testing gave no inflow of hydrocarbons. A program<br />
of further work was approved in August 2011, which<br />
includes the drilling of prospecting and appraisal<br />
wells. The first stage of the exploration period came<br />
to an end in April 2011 (the minimum work program<br />
has been carried in full and to schedule). Preparations<br />
are being made for drilling in 2012 of an appraisal<br />
well at the West Aral field and of a prospecting well<br />
at the Umid structure. Passports have been prepared<br />
for the Umid and Ak-Tepe structures. In 2011 LUKOIL<br />
increased its share in the project to 26.6%.<br />
3D seismic field work and interpretation of results<br />
began in 2011 as part of the West Qurna-2 project<br />
in Iraq (contracted work volumes are 540 km 2 ).<br />
A number of studies have been carried out as well<br />
as work for creation of a petrophysical field model.<br />
WQ-11 was reopened and inflow of oil at a daily rate<br />
of 6,686 barrels was obtained. Scheduled tasks for<br />
2012 include further reopening of wells, completion<br />
of 3D seismic work, logging of previously drilled<br />
On the Western Africa shelf (projects in Côte d’Ivoire<br />
and Republic of Ghana) 5 exploration wells were<br />
drilled including 1 productive (Independance-1X) and<br />
1 with non-industrial inflow (Buffalo-1X, CI-205 block).<br />
Independance-1X well that was drilled at CI-401 block<br />
is 4,100 meters deep, while sea depth is 1,700 meters<br />
The well established excellent sandstone reservoirs<br />
was established in Turonian sediments (3,799 – 3,815<br />
meters). Proved net pay is 53 meters. Detection<br />
of oil deposits in Turonian sediments represents<br />
a pioneering discovery.<br />
The exploration work plan for the Riyadh (Block A)<br />
project in Saudi Arabia implied drilling of five<br />
prospecting wells at the Tukhman and Mushaib fields<br />
and more than 1,500 km 2 of 3D seismic work. Studies<br />
were carried out in 2011 on economically viable<br />
technologies for extraction of difficult gas reserves<br />
in reservoirs with low permeability at the Tukhman<br />
field. Joint proposals with Saudi Aramco are being<br />
prepared for negotiations with the Saudi Arabian<br />
Government concerning changes in contract terms<br />
in order to continue economically viable work on the<br />
project. A decision on further work is expected during<br />
2012.<br />
Processing and interpretation of 3D seismic data<br />
from 2010 and previous years was completed as part<br />
of the WEEM Extension project in Egypt. The resource<br />
31
ase was clarified and passports were prepared<br />
for sidetrack drilling at wells WEEM-A2-ST2 and<br />
WEEME-А3. A tendering process was carried out, but<br />
drilling work had to be postponed until 2012 due to<br />
a lack of drilling capacities in 2011.<br />
In February 2011 LUKOIL, Vanco International and the<br />
Romanian National Agency for Mineral Resources<br />
signed concession agreements for exploration and<br />
production at two blocks in the Romanian sector of<br />
the Black Sea: Est Rapsodia and Trident. The blocks<br />
are located at sea depths between 100 and 1,200<br />
meters, and each block covers an area of 1,000 km².<br />
The agreements came into force in November 2011.<br />
The minimum program in the obligatory first stage of<br />
work at each block includes conduct of 1,000 km 2 of<br />
3D seismic exploration, AVO-analysis, basin modelling<br />
and drilling of one well. Regional 2D seismic data from<br />
previous years totalling 13,000 km were acquired<br />
in 2011, as well as materials from six offshore wells in<br />
Romania and Ukraine, nine geological reports and<br />
a seismic-study data base for the north-western part<br />
of the Black Sea. It is planned to carry out 2,000 km 2 of<br />
3D seismic exploration work in 2012.<br />
In April 2011 the Group acquired a 50% interest in<br />
the production sharing agreement for the Vietnam<br />
offshore block, Hanoi Trough-02 (HT-02), from Quad<br />
Energy S.A. The НТ-02 block covers an area of 1,185<br />
km 2 and is located onshore and in coastal waters of<br />
the South China Sea, about 50 km away from the port<br />
of Haiphong and 1,500 km away from developed fields<br />
on the ocean shelf of South Vietnam. Water depth<br />
is up to 23 meters. Analysis of data from the block<br />
and from adjacent areas will be carried out in 2012,<br />
and recommendations will be prepared for further<br />
geological exploration. Depending on results, 3D or<br />
2D seismic work may be carried out as well as drilling<br />
of a third well.<br />
In July 2011 LUKOIL acquired a 49% interest in an<br />
exploration and development contract at the offshore<br />
deepwater Block SL-5-11 in territorial waters of the<br />
Republic of Sierra Leone from the company Oranto<br />
Petroleum. Block SL-5-11 covers an area of 4,022 km²<br />
and is located on the continental slope of the Atlantic<br />
Ocean at sea depths between 100 and 3,300 m. 2D<br />
and 3D seismic studies were already carried out before<br />
acquisition on an area of 1,500 km 2 and a number of<br />
prospective structures were found, including the Leon<br />
and Savanna structures. The Block is part of the Sierra<br />
Leone – Liberia geological basin, where a number of<br />
large oil fields have been discovered in recent years.<br />
2D electric exploration work is planned in 2012, as<br />
well as reprocessing of 3D seismic materials and<br />
preparations for prospecting drilling.<br />
The Group has decided to abandon two projects in<br />
Kazakhstan: the Tyub-Karagan project (the second<br />
well Tyub-Karagan №2 was drilled in 2011 and did not<br />
discover industrial hydrocarbons deposits) and the<br />
Zhambai-Zaburunye (due to impossibility of finding<br />
a drilling sub-contractor capable of providing wellconstruction<br />
services in present conditions).<br />
32
Annual report 2011<br />
Oil Field Development and Production<br />
LUKOIL oil production by regions in 2011<br />
33
Crude oil production by LUKOIL Group in 2011<br />
(including the share of production by equity<br />
affiliates) was 90,917 million tonnes (1,840 million<br />
barrels per day).<br />
Lower oil output in 2011 reflects decline of production<br />
at fields in Western Siberia, where the Company<br />
produces 54% of its crude oil. The decline was due<br />
primarily to objective changes in the structure of<br />
recoverable reserves. However, improvement to<br />
systems for maintaining strata pressure, use of<br />
the latest enhanced recovery technologies and<br />
horizontal drilling enabled LUKOIL to stabilize<br />
output levels in Western Siberia from the middle<br />
of the year (see ‘Stabilization of production in<br />
Western Siberia’).<br />
Production levels were also negatively affected by<br />
results in Timan-Pechora where rates of output at<br />
wells declined due to high-water cut and shrinkage<br />
of recoverable reserves. Parameters of the geological<br />
model for the Yuzhno-Khylchuyuskoye field were<br />
revised in the reporting year, and this was reflected<br />
in the Group’s operating and financial results.<br />
Further measures have been designed and approved<br />
for stabilization of output levels at the Yuzhno-<br />
Khylchuyuskoye field and they will be implemented<br />
in 2012. They include drilling of side-tracks and use of<br />
12 dual-injection systems.<br />
LUKOIL subsidiaries and equity affiliates produced<br />
hydrocarbons at 358 fields in Russia and at 34 fields<br />
in 4 foreign countries during 2011. Production of<br />
hydrocarbons was begun at three new fields in<br />
the Russian Federation and at one field in Uzbekistan.<br />
Production levels at 18 Group fields rose by more<br />
than 50,000 tonnes in comparison with 2010.<br />
The largest increases (more than 200,000 tonnes)<br />
were achieved at 4 fields, which together gave overall<br />
annual increment of oil output by 1 million tonnes.<br />
The Company had 30,840 oil production wells as<br />
of January 1, 2012, of which 26,970 were actually<br />
in use, and the number of injection wells was 10,960,<br />
of which 8,750 were under pressure. The number<br />
of oil production wells was 1.6% higher in 2011 than<br />
in 2010, and the number of injection wells increased<br />
by 6.0%, raising the efficiency of production. The share<br />
of idle wells was almost unchanged from the end of<br />
2010 at 12.5% of the total number. Average daily oil<br />
output at wells in projects with Group participation<br />
was 13.8 tonnes.<br />
Volumes of production drilling were 2,953,000 m,<br />
which is 8% more than in 2010. The number of new<br />
production wells brought into operation was 1,006,<br />
of which 235 were horizontal. The Company plans<br />
to increase the number of horizontal wells in the<br />
medium term due to their high efficiency. Average<br />
daily flow from new wells in projects, in which the<br />
Group is a participant, was 32.4 tonnes, including<br />
49.8 tonnes from horizontal wells.<br />
The share of horizontal wells in the total number of<br />
new wells brought into operation in Russia increased<br />
from 11.5% in 2010 to 24.9% in 2011.<br />
A program of industrial testing enabled<br />
a technology breakthrough in 2011, which<br />
raises the forecast for viable development<br />
of new reserves in 2012–2021 by 3.6 billion<br />
barrels of oil thanks to increase of oil<br />
recovery rates at fields in Russia.<br />
LUKOIL made particularly rapid advances during<br />
2011 in drilling of horizontal wells that uses multizonal<br />
hydrofracturing of strata. A total of 96 wells<br />
with multi-zonal hydrofracturing were brought<br />
into operation in 2011 and gave 637,000 tonnes<br />
of oil production. Average daily oil flow from the<br />
wells was 56.3 tonnes. Application of this technique<br />
at the Urevskoye and Tevlinsko-Russkinskoye fields<br />
led to significant adjustment of field development<br />
plans, increasing the target recovery factor and<br />
thereby raising rates of return on these investment<br />
projects. In another technology advance LUKOIL used<br />
an expanded logging-while-drilling (LWD) complex<br />
for construction of horizontal wells on an industrial<br />
scale, enabling real-time drilling of horizontal boreholes<br />
in productive strata, which ensures maximum<br />
contact with the reservoir.<br />
Drilling of horizontal wells in the<br />
depression at wells in Western Siberia<br />
gave an increase of oil flow rates by 2–4<br />
times compared with previously drilled<br />
34
Annual report 2011<br />
wells using clay-polymer solutions, while<br />
reducing unit costs by 30%.<br />
LUKOIL achieved some increase in the efficiency<br />
of sidetracks during the reporting year and drilling<br />
of sidetracks was increased. Consistently high<br />
efficiency was achieved by the use of scientifically<br />
prepared mini-projects with hydrodynamic modelling,<br />
as well as by more accurate forecasting of<br />
geological structure and the structure of reserves<br />
at areas where sidetracks were drilled. Sidetrack<br />
drilling is carried out mainly at wells, which have<br />
been taken out of operation, in order to extract residual<br />
oil reserves. Sidetracks were drilled at 241 wells<br />
in 2011 and gave average daily flow of 20.4 tonnes.<br />
Efficiency of hydrofracturing operations at Company<br />
wells in 2011 was comparable with the result in 2010.<br />
The level of oil flow increase from hydrofracturing<br />
was maintained thanks to efforts to improve work<br />
planning, selection of wells using full-time hydrodynamic<br />
models, and tighter control over the quality<br />
of materials and reagents used by service companies.<br />
A total of 4,894 operations were carried out on<br />
productive strata in 2011 using physical, chemical,<br />
hydrodynamic and heat techniques. 1 Additional<br />
oil output in Russia thanks to application of such<br />
enhanced oil recovery techniques was 22.3 million<br />
tonnes, or 26% of total oil production by the Group in<br />
Russia.<br />
1<br />
See ‘Exploration and Production Technologies’<br />
35
Russia<br />
Oil production by LUKOIL in Russia during 2011 was<br />
84.966 million tonnes, of which 84.609 million tonnes<br />
were produced by Group subsidiaries.<br />
Subsidiaries and equity affiliates of LUKOIL produced<br />
hydrocarbons at 358 fields in Russia in 2011.<br />
Production drilling in Russia grew by 9.1% to 2,493,000<br />
m. The Group owned 28,930 production wells at the<br />
end of 2011, of which 25,240 were actually in use.<br />
Western Siberia<br />
Fields in Western Siberia accounted for 54% of<br />
LUKOIL’s oil production during the reporting year.<br />
Production in the region was somewhat lower than<br />
in 2010 at 49.1 million tonnes. Use of enhanced oil<br />
recovery methods and drilling of horizontal wells<br />
enabled LUKOIL to stabilize production rates in the<br />
region from the middle of 2011. The Company will<br />
continue to focus on stabilization of production<br />
levels in main operating areas, stepping up capital<br />
expenditures for development of new technologies<br />
and improvement of field efficiency.<br />
Despite long periods of exploitation, some of the<br />
Company’s fields in Western Siberia are still achieving<br />
production increases. In particular, the Vostochno-<br />
Perevalnoye and Urevskoye fields showed strong oil<br />
production growth once again in 2011.<br />
Oil production at the Vostochno-Perevalnoye field,<br />
commissioned in 2007, grew by 40% compared with<br />
2010 to a level of 0.9 million tonnes. The growth<br />
was achieved by launch of new wells (39 wells with<br />
average daily oil flow rates of 36.6 tonnes) as well as<br />
operations at wells that were completed in the previous<br />
year (29 wells were brought into production<br />
in 2010 and gave average oil flow of 37 tonnes per<br />
day). The Company’s development program calls for<br />
launch of 46 new wells in 2012–2013, of which four<br />
36
Annual report 2011<br />
will be horizontal. Water and gas treatment of strata is<br />
being used in test mode in order to raise the oil recovery<br />
at the Vostochno-Perevalnoye field. Peak production<br />
should be attained in 2013.<br />
Oil production at the Urevskoye field, which was<br />
brought into production in 1978, rose by 8.1% to<br />
3.1 million tonnes in 2011. The increase was achieved<br />
thanks to production drilling: 90 new wells were<br />
launched with average daily output of 38 tonnes,<br />
including 35 horizontal wells with daily flow of<br />
61 tonnes. A total of 11 sidetracks were drilled at the<br />
field in 2011 in order to maintain output levels at<br />
wells, and they gave average daily flow increases of<br />
19.6 tonnes, producing 22,300 tonnes of additional<br />
oil in total. Work continued on a system for maintaining<br />
strata pressure, and 75 new injection wells were<br />
put under pressure in the reporting year.<br />
The future drilling schedule for the Urevskoye field<br />
as of January 1, 2012, included 802 wells, of which 493<br />
for production and 309 for injection. The Company’s<br />
development program foresees completion of 117<br />
new wells at the field in the period from 2012 to 2017.<br />
37
Stabilizing Production in Western Siberia.<br />
The Urals Experience<br />
Western Siberia is one of LUKOIL’s key production<br />
regions. Crude oil production there in 2011 was 49.1<br />
million tonnes or 54% of the total for the Group.<br />
However, most fields in the region have been in<br />
development for many years and their reserves are<br />
highly depleted. Output by LUKOIL in Western Siberia<br />
peaked in 2007 at a level of 59.9 million tonnes.<br />
Average annual decline of Group output in the region<br />
during 2008–2010 was 5.3%. In 2011 we succeeded<br />
in reducing the rate of production decline: levels<br />
of output were stable in the second half of the year.<br />
This result was achieved through implementation of<br />
several carefully planned measures:<br />
Western Siberia: crude oil production, thousand tonnes per day<br />
Major reinforcement of the system for maintenance of strata pressure. Average 450 injection wells have<br />
been brought into service each year, so that, while the number of production wells grew only insignificantly<br />
(by 4%) over five years, the number of injection wells rose by 20%. The ratio of production wells to injection<br />
wells was reduced, and this enabled lowering of production losses and optimization of reserve development<br />
reduced, and this enabled lowering of production losses and optimization of reserve development.<br />
38
Annual report 2011<br />
Western Siberia: production wells to injection wells<br />
Injection well launches in Western Siberia<br />
39
The quantity of horizontal drilling work in Western Siberia was greatly increased in 2011, when 153 highly<br />
efficient horizontal wells were commissioned in comparison with 59 in 2010. We also carried out 96 multizonal<br />
hydrofracturing operations on strata horizontal drilling during 2011. Average daily flow rates from the new wells<br />
were over 56 tonnes.<br />
Western Siberia: launches and production from horizontal wells<br />
The number of low-cost well improvement operations (reperforation, perforation of different intervals,<br />
optimization of well operating regimes) increased in 2011 compared with 2010.<br />
Western Siberia: EOR operations<br />
40
Annual report 2011<br />
Western Siberia: well optimization<br />
Use of new drilling technologies in 2011 gave an increase of crude oil output from new wells, despite a decline<br />
in the number of new wells.<br />
.<br />
Western Siberia: drilling and well launches<br />
Western Siberia: production from new wells<br />
41
LUKOIL Group plans to maintain its focus on stable levels of production in Western Siberia, increasing investments<br />
to create and apply the latest technologies, and to improve efficiency in exploration and development<br />
of fields. The Company’s Strategic Development Program for 2012–2021 foresees a continuation of stable output<br />
levels in Western Siberia in coming years, and growth of production from 2016 thanks to the launching<br />
of new fields.<br />
Urals experience<br />
LUKOIL has achieved steady growth of production over a number of years in the Urals, which is another<br />
traditional production region for the Company. Crude oil output in the Urals in 2011 was 12.9 million tonnes,<br />
representing 14.2% of total output by the Group.<br />
The Company brought 51 new fields into production in the Urals between 1995 and 2011, and a total of 133 fields<br />
were in operation as of January 1, 2012. There has been a steady increase of output levels from 9.3 million tonnes<br />
in 1995 to 12.9 million tonnes in 2011. These results were achieved thanks to:<br />
• Annual launch of 2–3 new fields on average<br />
• Increase of the share of crude oil produced at new fields, which were brought into production<br />
during the period (nearly 2 million tonnes in 2011)<br />
• Implementation of efficient work on wells and formations (production drilling, drilling of sidetracks,<br />
hydrofracturing) as part of integrated programs for enhanced oil recovery, with coordination<br />
of decision-making for smaller and larger well groups<br />
This enabled major increases of crude oil output at a number of large fields in the region (Unvinskoye, Sibirskoye,<br />
Gagarinskoye, Kurbatovskoye, Garyushkinskoye).<br />
Crude oil production and commissioning of new fields in the Urals<br />
42
Annual report 2011<br />
Timan-Pechora<br />
The Timan-Pechora oil province provided 19.3% of<br />
Company production in 2011. Output by LUKOIL<br />
in the province declined by 17.1% to 17.5 million<br />
tonnes, due to lower production levels at the Yuzhno-<br />
Khylchuyuskoye field, but Timan-Pechora still has<br />
great potential. In 2011 LUKOIL and Bashneft Oil<br />
Company set up a joint venture for development<br />
of the R. Trebs and A. Titov oil fields, which are located<br />
in the province. Timan-Pechora also has the largest<br />
share of LUKOIL’s heavy oil reserves, which are located<br />
at the Yaregskoye and Usinskoye fields.<br />
The Yaregskoye field has proved reserves of<br />
318 million barrels of high-viscosity oil under SEC<br />
classification (3P reserves are 540 million barrels).<br />
Production at the field mainly uses a shaft technique.<br />
Work began in test mode during 2011 to<br />
improve heat treatment applications by use of a<br />
new drilling rig which enables wells to be drilled to a<br />
length of 800 m (2.5 times longer than traditional<br />
wells). Use of the new drilling rig, together with use<br />
of boring combines, will substantially reduce spending<br />
on preparation for development of slanted blocks<br />
and will raise productivity.<br />
Five pairs of production and injection wells were<br />
drilled at the Lyaelskaya area of the Yaregskoye field<br />
in 2011 with horizontal completions and borehole<br />
length up to 1,100 m. The purpose of this test work<br />
is to obtain know-how in use of horizontal boreholes<br />
for injection and production purposes. The technology<br />
is similar to Steam Assisted Gravity Drainage<br />
(SAGD), which is being applied in production from<br />
oil sands in Canada, and the tests have confirmed its<br />
efficiency.<br />
The Permian-Carbonaceous deposit at the Usinskoye<br />
field was brought into operation in 1977 and<br />
proved reserves in the deposit to SEC standards as of<br />
January 1, 2012 were 430 million barrels (3P reserves<br />
of the field were 680 million barrels). The deposit<br />
is characterized by highly varied structure of its<br />
carbonate reservoir, which contains high-viscosity<br />
oil, and thermal methods are being used to assist<br />
production. Most of the reserves at the deposit are<br />
being extracted by natural means. Extensive steam<br />
injection is being carried out at steam-heat impact<br />
zones in order to increase the recovery factor as<br />
well as steam-cycle treatment at various wells located<br />
over the entire extent of the deposit (combined<br />
with injection of chemical reagents in some cases).<br />
Additional oil production since thermal methods<br />
began to be used at the deposit is in excess of<br />
6.1 million tonnes.<br />
Extensive thermal treatment of strata via a system<br />
of horizontal wells is being used at a sector of the<br />
deposit for the first time. In 2012 LUKOIL plans tests<br />
at the deposit using perpendicular gravitational<br />
drainage of strata.<br />
Highest production growth rates in Timan-Pechora in<br />
2011 were achieved at the Yuzhno-Yuryakhinskoye<br />
field, where the increase in output compared with<br />
2010 was 214,400 tonnes (+233%). The production<br />
increase reflects well completions: six new wells<br />
were brought into production and gave average daily<br />
oil flows of 204.3 tonnes.<br />
Five new wells are scheduled to enter production<br />
at the Yuzhno-Yuryakhinskoye field in 2012.<br />
The Company’s development program for Exploration<br />
and Production business segment foresees<br />
rapid development of the field and further increase<br />
of oil production rates there.<br />
Urals<br />
Production of oil by LUKOIL in the Urals region<br />
increased to 12.9 million tonnes in 2011, or by<br />
3.5%, thanks to use of new technologies, such<br />
as sidetracks, radial drilling and acid hydrofracturing.<br />
The Urals accounted for 14.2% of total<br />
production by the Company during 2011, compared<br />
with a figure of 13.0% in 2010.<br />
Production of oil at the Unvinskoye field, which<br />
has top priority for the Company in the region, grew<br />
by 9.8% in 2011 to 1.7 million tonnes, thanks mainly<br />
to extensive use of modern enhanced recovery<br />
technologies as well as production drilling. A total<br />
of 10 sidetracks were drilled, giving average daily oil<br />
43
Production drilling by regions (2011)<br />
The Unvinskoye field is one of the Company’s biggest<br />
investment projects in Perm Region by size<br />
of initial reserves. The field has been almost completely<br />
drilled over and only fringe zones of deposits<br />
remain to be drilled.<br />
Volga<br />
Crude oil production by LUKOIL in the Volga region<br />
increased by 9.2% in 2011 compared with 2010 to<br />
3.4 million tonnes.<br />
Growth of production in the region was driven mainly<br />
by development of the Yury Korchagin field, which<br />
was launched in 2010 and was the first launch in<br />
a series of new Company fields in the offshore<br />
Caspian, which will be the main source of oil production<br />
growth for LUKOIL in the medium term.<br />
flow of 22 tonnes, and 17 operations for hydrofracturing<br />
of strata gave average daily production increments<br />
of 14.3 tonnes.<br />
Radial drilling was used at six wells and gave<br />
average increments of 9.9 tonnes per day.<br />
Five new wells were completed and gave average<br />
oil flows of 33 tonnes per day, including one<br />
horizontal well with average daily flow of 60.5 tonnes.<br />
These actions raised overall oil flow rates at all<br />
operating production wells to a level of 17 tonnes per<br />
day, compared with 15 tonnes in 2010.<br />
Total output from the Yury Korchagin field increased<br />
in 2011 to a level of 338,100 tonnes thanks to further<br />
drilling work, which enabled completion of three<br />
new wells. The total length of horizontal sections<br />
at wells rose above 1,000 m in the reporting year.<br />
Average daily oil flow from new wells was 432 tonnes<br />
and total production from new wells during the<br />
reporting year was 215,400 tonnes.<br />
The circulation system for drilling fluid was modernized<br />
as part of technical re-equipment of the Yury<br />
Korchagin offshore platform. This has enabled<br />
operations using drilling fluid with an invert base,<br />
so that extra-long horizontal boreholes can now be<br />
drilled to lengths in excess of 5 km.<br />
Oil field launches, fields<br />
Oil production drilling, thousand m<br />
44
Annual report 2011<br />
Plans for 2012 include drilling and launch of one gassuppression<br />
well and four production wells, with<br />
horizontal section length of up to 4,000 m. The project<br />
development plans call for drilling of 33 production<br />
wells in the period up to 2017. Peak oil production<br />
should be in excess of 2.4 million tonnes and peak<br />
gas production will be more than 1 billion cubic<br />
meters.<br />
International projects<br />
LUKOIL’s share of production in international<br />
projects was 5.951 million tonnes in 2011, which<br />
is 4.4% less than in 2010. The decrease was mainly<br />
due to the Kumkol and KarakudukMunai projects<br />
in Kazakhstan, South-West Gissar in Uzbekistan,<br />
Meleiha in Egypt and Shakh-Deniz in Azerbaijan.<br />
Production drilling in the Company’s international<br />
projects increased by 3.0% in 2011 compared with<br />
2010 to 459,800 meters. The number of oil production<br />
wells rose by 9.6% to 1,905, of which 1,728 were<br />
actually in use. A total of 267 new production wells<br />
were commissioned as part of international projects,<br />
in which the Company is a participant.<br />
The Group share of production in the Tengiz project<br />
in Kazakhstan was nearly unchanged at 1.292 million<br />
tonnes. An utilization rate of 99.2% was achieved<br />
for associated gas at Tengiz in the reporting year.<br />
A total of 25 well interventions were carried out in<br />
2011 and gave 1.5 million tonnes of additional output,<br />
which enabled existing plant capacities for preparation<br />
of oil and gas to be fully loaded. Pre-FEED work<br />
was completed in the project for optimization of the<br />
second-generation plant, which will make facilities<br />
more dependable and raise daily capacity to 41,800<br />
tonnes, and also in the project for management<br />
of well-head pressure, which will extend the period<br />
of full load of existing oil and gas preparation facilities<br />
through construction of a system for pressure<br />
increase (a pumping station).<br />
The Group’s share of crude oil and gas condensate<br />
production in the Karachaganak project in Kazakhstan<br />
was 1.5 million tonnes in 2011, almost unchanged<br />
from the previous year. Drilling of three new horizontal<br />
wells was completed during the year as part<br />
of the field investment program and one of the new<br />
wells was brought into production. A fourth stabilization<br />
and purification line was brought into operation<br />
at the Karachaganak Processing Complex. Stabilization<br />
capacity at the end of 2011 was 27,400 tonnes<br />
of stable condensate and oil per day, and a record<br />
level of gas injection to strata (25.4 million cubic<br />
meters per day) was achieved.<br />
There was a decline of output in the Kumkol project<br />
in Kazakhstan by nearly 15% to 1.25 million tonnes<br />
(the Group share) as the field is in a late stage of production.<br />
A total of 66 new production wells were<br />
brought into operation and gave average daily flows<br />
of 22.9 tonnes. Work was carried out to improve<br />
the system for utilization of associated gas, and<br />
proprietary rights to the technology scheme used<br />
in development of the Vostochny Kumkol field were<br />
obtained.<br />
Oil production well launches, wells<br />
Oil production wells, thousand wells<br />
45
Share of the Group in production from the Karakuduk-<br />
Munai project in Kazakhstan was 696,000 thousand<br />
tonnes in 2010, down by 3% from the previous year<br />
due to natural ageing of the fields. Two new wells<br />
were brought into operation during 2011 and gave<br />
average daily flow of 26.9 tonnes. Seven sidetracks<br />
were drilled during the year.<br />
Rapid development of the North Buzachi field in<br />
Kazakhstan was continued in 2011 and the LUKOIL<br />
share in output was almost unchanged at 493,000<br />
tonnes. A total of 153 new production wells (including<br />
50 horizontal wells) were brought into<br />
operation and the average daily flow rate per well<br />
was 10.3 tonnes. Five pumping stations were<br />
completed and launched during the year. Three horizontal<br />
wells and eight horizontal sidetracks were<br />
drilled. Work on the program for utilization of associated<br />
gas is continuing.<br />
Production as part of the Arman project in Kazakhstan<br />
was 19,100 tonnes in 2011, which is 9.1% less<br />
than in 2010. One well was completed for gas production<br />
in 2011 in order to supply fuel for power generation<br />
at the field, overcoming electricity shortages.<br />
Oil production grew by 16.9% at the Alibekmola<br />
and Kozhasai fields (Kazakhoil Aktobe project in<br />
Kazakhstan) to reach 285,200 tonnes in 2011. A total<br />
of 20 new wells were commissioned and their<br />
average flow rate was 52.9 tonnes. The oil preparation<br />
and pumping unit at the Alibekmola field was<br />
upgraded during the year and a workover of the<br />
oil production zone at the Kozhasai field was carried<br />
out. Work continued on the project for utilization<br />
of associated oil gas.<br />
There was a decline in production of gas condensate<br />
as part of the Shakh-Deniz project in Azerbaijan<br />
by 9.3% to 135,400 tonnes due to limited capacity of<br />
consumers in Azerbaijan and Turkey to take the gas.<br />
One new well was brought to operation in 2011 and<br />
gave an average daily flow of 1,200 tonnes. Gas was<br />
delivered through the South-Caucasus pipeline to<br />
Azerbaijan, Georgia and Turkey. Condensate was<br />
shipped via the Baku – Tbilisi – Ceyhan export pipeline.<br />
On October 25, 2011, a package of documents<br />
on further development of Stage 2 of the project<br />
was signed by representatives of the Azerbaijani<br />
state oil company, SOCAR, and the Turkish state oil<br />
and gas pipeline company, BOTAS, in the presence of<br />
the Turkish Prime Minister. The documents must also<br />
be ratified by the Turkish and Azerbaijani parliaments.<br />
An accord between Azerbaijan and its partners on<br />
a five-year extension of the production sharing<br />
agreement for Shakh-Deniz depends on final approval<br />
of Stage 2.<br />
LUKOIL’s share of gas condensate production at<br />
the Khauzak-Shady area in Uzbekistan (developed<br />
as part of the Kandym – Khauzak – Shady project),<br />
which was commissioned in 2007, was 9,100 tonnes<br />
in 2011.<br />
LUKOIL’s share of production at the South-West<br />
Gissar project in Uzbekistan, which was acquired in<br />
2008, declined by 11.9% in 2011 compared with 2010<br />
to a level of 77,400 tonnes, due to natural exhaustion<br />
of the oil fields which are being developed in<br />
the project.<br />
The Group’s share in the Meleiha project in Egypt<br />
was 20.4% less in 2011 than in 2010 and amounted<br />
Oil production wells in use, thousand wells<br />
Oil production, million tonnes<br />
46
Annual report 2011<br />
to 54,900 tonnes. This was due to reduction of<br />
LUKOIL’s share in the PSA due to growth of prices for<br />
hydrocarbons. A total of 24 new wells were brought<br />
into operation in 2011 and their average daily flow<br />
rate was 37.4 tonnes.<br />
The Group share in production as part of the WEEM<br />
project was 136,800 tonnes (excluding WEEM extension).<br />
A system for maintenance of strata pressure<br />
was launched in test mode in the course of the year.<br />
Preparations were carried out in the reporting year<br />
for the launch of production in the West Qurna-2<br />
project in Iraq. In 2009 a consortium of LUKOIL and<br />
the Norwegian company Statoil won a tender for<br />
development rights at the West Qurna-2 field, which<br />
is among the largest in the Republic of Iraq.<br />
The geological model of the field was brought up<br />
to date in 2011 to take account of new well-testing<br />
data, interpretation of fragments of geophysical<br />
studies and more accurate correlation of the geological<br />
section with sedimentation cycles. Drilling of<br />
23 production wells is scheduled to begin in 2012 as<br />
part of the early oil development stage. Other plans<br />
for 2012 include construction of geological and hydrodynamic<br />
field models, completion of work to re-open<br />
old wells, core studies and 3D seismic work.<br />
Oil production is scheduled to begin in 2013.<br />
Drilling of sidetracks, sidetracks<br />
Drilling of horizontal wells, wells<br />
47
Gas Field Development and Gas Production<br />
LUKOIL production of marketable gas by regions in 2011<br />
48
Annual report 2011<br />
LUKOIL’s gas program is focused on accelerated<br />
growth of gas production both in Russia and abroad<br />
and increase in the share of gas to a third of total<br />
hydrocarbon production by the Group. The main<br />
aim of this strategy is to commercialize gas reserves<br />
and reduce the Company’s exposure to major price<br />
volatility on the international oil market.<br />
Total gas production by LUKOIL Group in 2011<br />
(including the share of production by equity affiliates)<br />
rose by 3.3% to 22.023 billion cubic meters.<br />
Output of marketable gas (net of own use, reinjection<br />
into reservoir formations and transport losses) rose<br />
by 0.4% to 18.621 billion cubic meters (300,000 boe<br />
per day), including increase of output by 1.2% in<br />
Russia and reduction of output by 1.9% in other<br />
countries. Company revenue from sales of natural<br />
gas was $327 million in 2011, which is 4.8% more than<br />
in 2010, due to increase of demand and of prices for<br />
hydrocarbons.<br />
The main achievement in the Company’s gas business<br />
during 2011 was the launch of gas production<br />
at the Dzharkuduk field as part of the South-West<br />
Gissar project in Uzbekistan. Early gas was produced<br />
at the field towards the end of 2011 and attainment<br />
of large-scale production is scheduled in the<br />
first quarter of 2012. A complex gas preparation unit<br />
will be built at Dzharkuduk in 2013 when construction<br />
of the large Gumbulak and Adamtash fields will<br />
also be completed, with drilling of more than 40<br />
production wells. An external power transmission<br />
line will also be provided, and other constructions<br />
will include a gas collection and preparation system,<br />
pipelines for marketable gas and condensate, a shift<br />
camp, a field base and various engineering infrastructure<br />
facilities.<br />
The Company’s main gas field remains the<br />
Nakhodkinskoye field, where natural gas production<br />
rose by 1.6% in 2011 to 8,273 million cubic meters.<br />
All of this gas was sold to Gazprom. Net income<br />
of LUKOIL Group from gas projects in Russia was<br />
$114 million in 2011.<br />
The Company had 404 gas production wells at the<br />
end of 2011, of which 296 were in use.<br />
Output of natural gas increased by 1% in 2011 to a level<br />
of 14,082 million cubic meters, including 12,761 million<br />
cubic meters of marketable gas, production of which<br />
was almost unchanged from the previous year.<br />
Production of associated gas grew by 7.4% to 7,941<br />
million cubic meters, including 5,860 million cubic<br />
meters of marketable associated gas, production<br />
of which increased by 1.3%. Associated gas is used<br />
at Company fields, where it is injected in order to<br />
maintain strata pressure, for generation of electricity<br />
using gas-fired generating stations, and also for<br />
other production needs. Marketable associated gas<br />
is delivered to gas-processing plants and to local<br />
consumers.<br />
The Company has been increasing the share of associated<br />
gas, which it puts to use 1 , year by year and<br />
the share reached 79.3% in 2011 compared with<br />
76.8% in 2010, 71.1% in 2009 and 70.4% in 2008. The<br />
increase has been made possible by development of<br />
systems for utilization of associated gas at Company<br />
fields, including construction of compressor stations<br />
and gas pipelines. The level of utilization of associated<br />
gas at main Company fields in Western Siberia is<br />
now above 95%.<br />
The Company is pursuing construction of gas-fired<br />
power stations at fields as part of a small-scale<br />
generating program in order to further increase<br />
utilization of associated gas. This reduces gas flaring<br />
and gives cost savings on electricity, lowering oil<br />
lifting costs. LUKOIL is implementing a program for<br />
the years 2011–2013, which aims to increase rates<br />
of associated gas utilization by organizations in the<br />
Group. The Company built or upgraded 52 facilities<br />
at 49 fields in 2011 as part of the gas utilization<br />
program.<br />
1<br />
The share of produced gas in total gas extracted from strata. Remaining gas is flared off.<br />
49
cubic meters, representing a slight increase in<br />
comparison with 2010.<br />
A second exploration well was drilled in 2011 at the<br />
Sarmatskoye field and discovered substantial gas<br />
reserves. The increase in recoverable gas reserves<br />
amounted to 56 billion cubic meters.<br />
RUSSIA<br />
Production of marketable gas in Russia in 2011 was<br />
13,795 million cubic meters, which is 1.2% more<br />
than in 2010. The Company had 297 gas production<br />
wells in Russia at the end of 2011, of which 215<br />
were actually in use.<br />
Most of the Company’s natural gas production in 2011<br />
in Russia (more than 90%) came from the Nakhodkinskoye<br />
field in the Bolshekhetskaya Depression.<br />
Gas production there in 2011 was 8.3 billion<br />
Gas production wells, wells<br />
LUKOIL has an agreement with OJSC Rosneft Oil<br />
Company by which the Group will accept volumes<br />
of gas up to 5.6 billion cubic meters per year starting<br />
in 2013 from the Vankor group of fields for input<br />
to the LUKOIL gas transport system in the Bolshekhetskaya<br />
Depression, adjacent to the Khalmerpayutinskoye<br />
field, for delivery to the Gazprom<br />
gas transport system at the Yamburgskaya gas<br />
compression station. Construction of a pipeline<br />
system from the Khalmerpayutinskoye field to the<br />
Pyakyakhinskoye field, and from Pyakyakhinskoye<br />
to the Nakhodkinskoye field is scheduled for completion<br />
in 2013. Tenders have been carried out for purchases<br />
of pipes and valve systems, and subcontractors<br />
for construction of the pipeline system have<br />
been selected.<br />
Rosneft’s commitments under the agreement are<br />
to accept 3 million tonnes per year of stable oil and<br />
condensate mixture into its Vankor–Purpe pipeline<br />
for delivery to the Transneft trunk pipeline system.<br />
However, LUKOIL has decided not to use the Vankor<br />
route for transport of liquid hydrocarbons, but<br />
to use Transneft’s Zapolyarye–Purpe trunk pipeline<br />
instead, so construction of the Pykyakhinskoye field<br />
and the start of production there will be coordinated<br />
with the scheduled date for opening of that<br />
pipeline, which will pass across the field.<br />
Gas production wells in use, wells<br />
50
Annual report 2011<br />
When all fields in the Bolshekhetskaya Depression<br />
reach planned output levels, total annual production<br />
of natural gas by the Company in the region will attain<br />
20 billion cubic meters.<br />
LUKOIL reached agreement with Gazprom in the<br />
reporting year on deliveries of 8.35–12.11 billion cubic<br />
meters of gas from fields in the Bolshekhetskaya<br />
Depression during 2012–2016 at prices set by the<br />
Federal Tariff Service less 15% for use by industry in<br />
Yamal-Nenets Autonomous District. The agreement<br />
also states that Gazprom will make every effort to<br />
accept all of LUKOIL’s gas output from fields in the<br />
Northern Caspian into its gas transport system after<br />
LUKOIL begins production in that region and will<br />
deliver equivalent amounts to LUKOIL enterprises.<br />
International projects<br />
Production of marketable gas as part of international<br />
projects decreased by 1.9% in 2011 to 4.826 million<br />
cubic meters. The share of natural gas was 86%, almost<br />
unchanged from the previous year. The Company had<br />
107 gas production wells in international projects at<br />
the end of 2011, of which 81 were actually in use.<br />
Early gas was produced at the end of 2011 at the<br />
Dzharkuduk field as part of the South-West Gissar<br />
project in Uzbekistan, and full-scale production should<br />
be achieved in the first quarter of 2012. A complex<br />
gas preparation unit will be built at Dzharkuduk in<br />
2013 when construction of the large Gumbulak and<br />
Adamtash fields will also be completed, with drilling<br />
of more than 40 production wells. An external power<br />
transmission line will also be provided, and other<br />
construction work will include a gas collection and<br />
preparation system, pipelines for marketable gas<br />
and condensate, a shift settlement, a field base and<br />
various engineering infrastructure facilities.<br />
Most of marketable gas production outside Russia<br />
(54%) was at the Khauzak-Shady area, which was<br />
brought into production at the end of 2007 and is<br />
being developed as part of the Kandym – Khauzak –<br />
Shady project in Uzbekistan. Production of marketable<br />
gas at the Khauzak-Shady area was 2.63 billion<br />
cubic meters in 2011, which is almost unchanged<br />
from 2010.<br />
The Shady area (western part) of the Dengizskulsky<br />
field was brought into operation in November 2011.<br />
The total daily increment in field output was more<br />
than 5 million cubic meters. A contract has been signed<br />
for the design of project documents and delivery<br />
of equipment for the Khauzak booster compressor<br />
station.<br />
A contract was signed in August 2011 for preparation<br />
of a pre-project study and general documentation<br />
for construction of a gas-processing complex at the<br />
Kandym group of fields. The Korean company Hyundai<br />
Engineering was selected as sub-contractor for the<br />
work on the basis of a tendering competition. Standard<br />
load of this unique gas-processing plant will be 8<br />
billion cubic meters of gas per year, and the first set of<br />
facilities are scheduled for launch on August 1, 2016.<br />
The contract has been approved by the Government<br />
of Uzbekistan.<br />
The Group share of marketable gas in the Tengiz<br />
project in 2011 was 560 million cubic meters.<br />
Completion of a special program has raised the<br />
utilization rate for associated gas to more than 99%.<br />
The Group share of marketable gas production in<br />
2011 at the Shakh-Deniz project in Azerbaijan, which<br />
was brought into production in December 2006,<br />
was 513 million cubic meters in the reporting year,<br />
which is 5.9% less than in 2010. The reduction was<br />
due to limitation of volumes taken by Azerbaijan<br />
and Turkey.<br />
Marketable gas production, million cubic meters<br />
51
2<br />
Oil Refining, Gas Processing<br />
and Petrochemicals<br />
52
Annual report 2011<br />
Strategy 2012–2021:<br />
Significant increase of light products yield<br />
at Russian refineries<br />
Increase in gasoline production at Russian<br />
refineries by 50%<br />
Increase in average daily sales at Russian<br />
filling stations by 27%<br />
Installation of new secondary refining units<br />
at Russian refineries<br />
Bringing foreign refineries in line with<br />
the world standards<br />
Main indicators for LUKOIL’s Refining & Marketing business segment<br />
Indicator, $ million 2011 2010 Growth, %<br />
Revenue 128,549 100,246 28.2<br />
EBITDA 5,795 5,124 13.1<br />
Net income 3,687 3,330 10.7<br />
Capital expenditures 1,354 1,320 2.6<br />
The Company achieved impressive results in the<br />
Refining & Marketing business segment in 2011:<br />
segment net income rose by 11% to $3.687 billion.<br />
The increase in net profit was achieved through<br />
ongoing optimization and installation of new<br />
conversion capacities, primarily in Russia, as well as<br />
favourable market conditions in Russia.<br />
LUKOIL pursued work in 2011 to develop its oil refining<br />
business through modernization and expansion of<br />
refining capacities.<br />
53
Price and tax environment<br />
Growth of the world economy led to gradual recovery<br />
in demand for petroleum products during 2011, and<br />
there was substantial price growth on both domestic<br />
and export markets. The external price environment<br />
had a great influence on LUKOIL’s revenue growth<br />
since the Company sold 81% of its petroleum products<br />
outside Russia. Average prices for fuel oil in Europe<br />
rose by 38% (FOB Rotterdam), and prices for highoctane<br />
gasoline were 34% higher. The domestic market<br />
for petroleum products also saw price growth:<br />
heating fuel oil prices rose by 30% and prices for AI-95<br />
gasoline rose by 21%.<br />
Volume of refining in 2011, including processing<br />
at third-party refineries, totalled 65.2 million tonnes,<br />
of which 64.9 million tonnes are attributed to the<br />
Company’s own refineries (including the Company’s<br />
share of refining at the ISAB and Zeeland complexes).<br />
There was a significant increase of high-octane automotive<br />
gasoline consumption in Russia in 2011 due to<br />
increasing number of automobiles. The Government<br />
took a number of measures to address fuel shortages,<br />
including introduction of the ‘60-66’ system, which<br />
unifies export duties for light and dark oil products<br />
at 66% of the duty level for crude oil while keeping<br />
a higher rate of 90% for exports of gasoline.<br />
The new system encourages deeper refining of crude<br />
oil, which the Group has been working on for a number<br />
of years and will continue this work in the future.<br />
The Company is planning to reduce output of dark<br />
petroleum products at its Russian refineries by more<br />
than 2.5 times in the next decade. Implementation<br />
of modernization projects should boost output of<br />
automotive gasoline at LUKOIL’s Russian refineries<br />
by almost 1.5 times by 2021.<br />
LUKOIL Group includes five oil refineries outside<br />
Russia, which lowers exposure to domestic risks<br />
and allows global optimization of commodity flows.<br />
54
Annual report 2011<br />
Oil Refining<br />
LUKOIL Group Refineries<br />
1<br />
Capacity and refining volumes at Zeeland (for oil) are shown as the Company’s share (45%). In addition,<br />
2.17 million tonnes of vacuum gasoil were processed at Zeeland in 2011.<br />
2<br />
Including refining of 0.74 million tonnes of fuel oil in 2011.<br />
3<br />
Capacity and refining volumes at ISAB (for oil and fuel oil) are shown as the Company’s share (60%).<br />
55
LUKOIL Group continued rapid development<br />
of its oil refining business in 2011 through<br />
modernization and expansion of refining<br />
capacities.<br />
The Group raised operating efficiency of its refineries<br />
in 2011 through measures to optimize production<br />
capacities, increase capacity load of refining units,<br />
raise energy efficiency and reliability of equipment<br />
(increasing the operation period between overhauls),<br />
as well as to optimize personnel numbers. Financial<br />
impact from these measures was about $68.3 million.<br />
Russian refineries<br />
Crude oil throughput at refineries in Russia owned by<br />
LUKOIL Group was 45.3 million tonnes in 2011, which<br />
is 0.1% more than in 2010.<br />
The share of high-octane gasoline in total output of<br />
gasoline at Group refineries in Russia (not including<br />
mini-refineries) rose to 96.2% in 2011 (from 91.5% in<br />
2010). Light-product yield was 52.0% (48.5% in 2010).<br />
Scheduled work continued in 2011 at all of the<br />
Group’s Russian refineries to re-equip and automate<br />
production processes, improve energy efficiency,<br />
and enhance industrial and environmental security.<br />
Capital expenditures at Company’s refineries in Russia<br />
were $586 million in the reporting year (against<br />
$542 million in 2010).<br />
A hydrogen fluoride alkylation unit was brought into<br />
operation in the first quarter of 2011 at the Nizhny<br />
Novgorod Refinery. The catalytic cracking complex<br />
for vacuum gasoil, construction of which was<br />
completed at the end of 2010, reached planned<br />
capacity levels in 2011. Increase of gasoline output<br />
compared with 2010 was 1.1 million tonnes.<br />
The strategic development program for the Nizhny<br />
Novgorod Refinery, which was approved in 2011, calls<br />
for construction of a second catalytic cracking complex<br />
by 2015 using existing project documentation.<br />
Installation of the second complex will help to prevent<br />
repetition of the gasoline shortages, which were<br />
seen at the start of 2011, by ensuring that sufficient<br />
56
Annual report 2011<br />
supplies of high-quality automotive gasoline are<br />
available for the domestic market in the near future.<br />
Engineering studies and equipment orders for the<br />
project are already being carried out. The development<br />
program also includes installation of the second<br />
isomerisation unit, which will increase production<br />
of high-quality gasoline from low-octane fractions<br />
of straight-run gasoline. Construction of a facility for<br />
hydrocracking of residues is planned in the long term,<br />
and will substantially increase light product yield, as<br />
well as minimizing production of fuel oil and lowering<br />
sulphur content in fuel oil to 1%.<br />
A new delayed coking unit with one million tonnes<br />
annual capacity was brought into operation in<br />
December 2011 at the Volgograd Refinery. Its launch<br />
will terminate the fuel oil production in 2012.<br />
Construction and assembly works on a new diesel<br />
fuel hydrotreatment facility with 3 million tonnes<br />
annual capacity continued in 2011. Project completion<br />
will make all diesel fuel output from the Volgograd<br />
Refinery compliant with Euro-5 environmental standards.<br />
Commissioning of the unit is scheduled in the<br />
third quarter of 2012.<br />
A new primary refining unit with 6 million tonnes<br />
annual capacity is being installed. It will replace two old<br />
units and its launch will reduce energy consumption in<br />
crude refining and raise the quality of product<br />
fractionation. Launch of the unit is scheduled in 2015.<br />
Future plans include construction by 2016 of a deep<br />
refining complex for vacuum gasoil, which will<br />
increase production of diesel fuel compliant with<br />
Euro-5 standards, as well as high-quality lubricants.<br />
The deep refining complex will consist of a vacuum<br />
gasoil hydrocracking unit with 3.5 million tonnes<br />
capacity, as well as hydrogen and sulphur units.<br />
The delayed coking unit at the Perm Refinery was<br />
brought back into operation following reconstruction<br />
and replacement of the coke chambers. Technical<br />
furnaces at the Refinery are also being replaced<br />
in order to raise operating efficiency and reduce<br />
atmospheric emissions.<br />
Work on construction of a deep refining complex at<br />
the Perm refinery was in progress in 2011, including<br />
a delayed coking unit with 2.1 million tonnes annual<br />
capacity, a diesel hydrotreatment unit, a hydrogen<br />
unit and a sour water stripping unit. Project<br />
implementation will terminate fuel oil production<br />
and increase light product yield while complying<br />
with current and planned requirements for industrial<br />
safety and protection of the environment. Launch<br />
of the complex is scheduled in 2015.<br />
Work continued at the Ukhta Refinery in 2011<br />
on technical re-equipping of the vacuum block<br />
at the atmospheric-vacuum distillation units and<br />
modernization of the reaction block of the GDS-<br />
850 hydrodewaxing unit. The purpose of re-equipment<br />
of the vacuum block is to achieve deeper<br />
refining of crude oil by processing all fuel oil<br />
outputs. The extra vacuum annual capacities will also<br />
make it possible to refine more oil from the Yaregskoye<br />
field as production levels there increase.<br />
Oil refining by the Company, million tonnes<br />
Share of high-octane gasoline in total output<br />
of gasoline, % 1<br />
1<br />
Excluding mini-refineries and the ISAB and Zeeland complexes.<br />
57
Modernization of the reaction block of the hydrodewaxer<br />
will enable production of Euro-5 diesel<br />
fuel.<br />
Foreign refineries<br />
Refinery throughputs in 2011 at LUKOIL Group’s<br />
international refineries, including the Group’s share<br />
of refining at the ISAB and Zeeland complexes, were<br />
19.6 million tonnes, which is 6.3% less than in 2010.<br />
The decrease was due to stoppage of the Odessa<br />
Refinery at the end of 2010.<br />
Light product yield (not including ISAB and Zeeland)<br />
was 67.8% (66.0% in 2010). Irretrievable losses at<br />
foreign refineries amounted to 0.7% in 2011.<br />
Capital expenditures for modernization of the<br />
Group’s foreign refineries were $197 million in 2011<br />
($160 million in 2010).<br />
The Odessa Refinery (Ukraine) was closed down in<br />
the fourth quarter of 2010 due to the unfavourable<br />
market environment in Ukraine and switching of<br />
the Odessa-Brody pipeline from reverse mode, which<br />
made pipeline oil deliveries impossible. Sea deliveries<br />
would increase costs significantly. There was no<br />
improvement of the economic situation, which could<br />
justify resumption of refining operations in 2011.<br />
Possible reopening of the Refinery in 2012 is now<br />
under consideration.<br />
At the Burgas Refinery (Bulgaria) a project for<br />
optimization of boiler fuel loading arrangements<br />
at the Rosenets oil terminal was completed in 2011,<br />
and work on reservoir facilities was also completed.<br />
Management systems for primary refining capacities<br />
and for catalytic cracking were upgraded.<br />
Design work as well as equipment procurement on<br />
a processing complex for heavy residues is continuing<br />
and is due for completion in 2015. The goals of<br />
the project are to increase oil conversion at the<br />
Refinery, to end production of high-sulphur heating<br />
oils, and to raise output of diesel fuels that comply<br />
with Euro-5 standards. The central part of the new<br />
complex will be a tar hydrocracker with 2.5 million<br />
tonnes capacity.<br />
At the Ploiesti Refinery (Romania) most work was<br />
completed in 2011 on a project for launch of propylene<br />
production with sulphur content below 5 ppm, which<br />
will fetch higher prices on the market.<br />
The Company’s interest in the ISAB Refining Complex<br />
(Sicily, Italy) was increased from 49% to 60% in 2011.<br />
Value of the transaction was $342 million. The Group<br />
share in refining at ISAB was 6.95 million tonnes.<br />
The TRN Refinery in the Netherlands changed its<br />
name in 2011 to the Zeeland Refinery. Total 4.51<br />
million tonnes of oil (the Group share) was refined<br />
there in 2011.<br />
Share of diesel fuel with sulphur content below Change in output levels of petroleum products<br />
50 ppm in total diesel production, % 1 at Company's refineries in 2011 compared with<br />
2010, % 1<br />
1<br />
Excluding mini-refineries and the ISAB and Zeeland complexes.<br />
58
Annual report 2011<br />
Production of Lubricants<br />
Lubricant production at LUKOIL Group refineries in 2011<br />
59
Production and sale of lubricants is an important<br />
part of LUKOIL’s business. The Group is constantly<br />
improving the quality of products and expanding their<br />
range, as well as raising efficiency of the sales system<br />
and diversifying the geography of this business sector.<br />
LUKOIL is the leader on the Russian lubricants<br />
market, accounting for about 44% of domestic<br />
production. Lubricants are produced at Group<br />
refineries in Perm, Volgograd and Nizhny Novgorod.<br />
The Company also mixes lubricants from readymade<br />
components (both produced by the Company<br />
and bought from third parties) at facilities in Russia,<br />
Finland, Romania and Turkey.<br />
Lubricant production including mixing from readymade<br />
components totalled 1.238 million tonnes<br />
in 2011. Branded lubricant production was 316,000<br />
tonnes in 2011, representing an increase of 13% from<br />
2010.<br />
The number of different oils & lubricants<br />
and other vehicle chemicals made at LUKOIL’s<br />
Russian refineries increased from 230 to 261<br />
in 2011 compared with 2010. Outputs include<br />
motor and transmission oils for all types<br />
of transport, lubricants for industrial<br />
equipment, and base oils (used as inputs for<br />
production of ready-to-use oils, lubricants<br />
and additives).<br />
The Group continued its efforts in 2011 to improve<br />
efficiency in sales of lubricants, including further<br />
development of an import substitution program.<br />
The program includes regular supplies of lubricants<br />
to the Russian coal mining company, OJSC<br />
Kuzbassrazrezugol, and LLK-International has reached<br />
a long-term agreement for 2012, by which it will<br />
remain the sole supplier to this customer. A pilot<br />
project has been launched at Taldinsky Coal Mine for<br />
use of a mobile oil-changing complex. Availability<br />
of such mobile complexes expands LUKOIL’s opportunities<br />
for signing long-term contracts with<br />
leading mining companies in Russia. Lubricant deliveries<br />
to enterprises that are part of the ferrous<br />
metallurgy holding, OJSC Metalloinvest, continued<br />
in 2011 and a five-year strategic partnership and<br />
cooperation agreement has been signed with another<br />
Russian steelmaker, CherMK OJSC Severstal.<br />
A tendering competition carried out in December<br />
2011 by CJSC Severstal Resource selected the LUKOIL<br />
company, LLK-International, as sole supplier to<br />
a number of Severstal Resource enterprises, and the<br />
non-ferrous metals giant, GMK Norilsk Nickel, held<br />
a competition, as a result of which LUKOIL won the<br />
right to supply 450 tonnes of lubricants, which is<br />
twice more than the previous supply order placed<br />
by Norilsk.<br />
LLK-NAFTAN, the joint venture of LUKOIL and the<br />
Naftan refinery (Belarus), met 46% of LUKOIL’s requirements<br />
for additives used in lubricant production in<br />
2011. The JV has increased output by more than seven<br />
times, from 3,000 to 23,000 tonnes, since its creation<br />
in 2006.<br />
LUKOIL carries out sales of lubricants in more than<br />
40 countries worldwide and its sales geography is<br />
constantly expanding. In 2011 the Company began<br />
lubricant sales in Afghanistan, Mongolia and China.<br />
In a major breakthrough for LUKOIL’s lubricant business<br />
the Company obtained its first-ever contracts<br />
in 2011 for lubricant supplies to newly-built ships,<br />
winning a tender for first-filling of 71 vessels. MAN<br />
limitations on maximum size of engines suitable<br />
for LUKOIL lubricants were lifted. Approvals were<br />
obtained from Japanese marine engine manufactu-<br />
60
Annual report 2011<br />
rers, Daihatsu and Yanmar, and also from the biggest<br />
South Korean shipbuilder, Hyundai Heavy Industries.<br />
LUKOIL began supplying lubricants to the global<br />
shipping companies, Sovcomflot, Maersk, Happag<br />
Lloyd and ZIM. The Company’s ship lubricants were<br />
available in 550 ports in more than 62 countries worldwide<br />
by the end of 2011 and the share of LLK Marine<br />
on the global market reached 2%.<br />
The Company prioritizes customer relations in its<br />
lubricant business. LUKOIL was among the first companies<br />
in the industry to offer comprehensive service<br />
with full product support, from placement of client<br />
orders to delivery of the product, as well as analysis<br />
of used lubricants and recommendations for their<br />
further application.<br />
LUKOIL continued scheduled work on development<br />
of new high-efficiency lubricants during 2011. A total<br />
of 38 new products were developed during the year<br />
and 48 official approvals were obtained from manufacturers<br />
of machines and equipment. As of today<br />
LUKOIL lubricants have more than 350 valid official<br />
approvals from original equipment manufacturers<br />
(OEMs). LUKOIL LUX 5W-40 synthetic is the first oil from<br />
a Russian producer to win a license from the American<br />
Petroleum Institute (API) in the highest certification<br />
category (‘SN’).<br />
Launch of a new range of lubricants, LUKOIL GENESIS,<br />
on the Russian market is planned in 2012. The lubricants<br />
will meet the latest criteria of international<br />
vehicle manufacturers, including those in respect<br />
of fuel economy and environmental characteristics.<br />
New, up-do-date lubricants for heavy diesel engines,<br />
AVANGARD Professional 10W-30, will also be presented,<br />
as well as a series of synthetic products for<br />
automatic transmissions.<br />
LUKOIL motor oils meet international requirements of the Society of Automotive Engineers<br />
(SAE), the American Petroleum Institute (API), the European Automobile Manufacturers Association<br />
(ACEA) and the Russian Association of Automobile Engineers (AAE). Our oils are produced using<br />
the latest technologies and contain high-quality additives supplied by Russian and foreign<br />
producers.<br />
High performance qualities of LUKOIL lubricants have been acknowledged by major automotive<br />
manufacturers in Russia and abroad. Company motor oils have passed tests at western certification<br />
centers on engines made by DaimlerChrysler, BMW, Volkswagen, MAN, Porsche, Volvo, Renault<br />
trucks and Cummins, and have been approved for use in these engines. A total of 38 new lubricant<br />
products were brought into production in 2011 and 48 manufacturer approvals were obtained.<br />
Lubricant production at Company refineries,<br />
thousand tonnes<br />
Sales of branded lubricants, thousand tonnes<br />
61
Gas Processing<br />
Gas-processing plants of LUKOIL Group<br />
62
Annual report 2011<br />
Gas-processing plants of LUKOIL Group<br />
process associated gas from fields<br />
in Russia into marketable gas (fed into<br />
the Gazprom gas pipeline system)<br />
and liquid hydrocarbons.<br />
In 2011 the Company’s gas-processing<br />
plants processed 3,199 million cubic<br />
meters of gas feedstock (+1.0% to 2010)<br />
and 743,000 tonnes of liquid hydrocarbons<br />
(-2.2% to 2010). The increase<br />
in gas processing was due to higher<br />
demand for products.<br />
Company plants produced 2,523 million cubic<br />
meters of stripped gas, 1.518 million tonnes of liquefied<br />
gas including natural gas liquids and 194,000<br />
tonnes of liquid hydrocarbons (stable gas naphtha,<br />
isopentane and hexane-heptane fractions, and natural<br />
gas liquids).<br />
Expansion of capacities to 1,460 thousand tonnes<br />
for gas and to 1,700 thousand tonnes for natural gas<br />
liquids is planned for LUKOIL-Permneftegazpererabotka.<br />
The new production line will enable LUKOIL<br />
to meet its targets for utilization of associated oil<br />
gas in Perm Territory and also to raise the quality<br />
of outputs by separate processing of wet gas from<br />
LUKOIL-Permnefteorgsintez and of associated oil gas.<br />
63
Petrochemicals<br />
LUKOIL Group Petrochemical Plants<br />
Petrochemical production, thousand tonnes<br />
64
Annual report 2011<br />
LUKOIL's petrochemical business is one of the biggest<br />
in Russia, CIS and Eastern Europe. Company plants<br />
in Russia, Ukraine and Bulgaria produce pyrolysis<br />
and organic synthesis products, fuel fractions and<br />
polymer materials. LUKOIL meets a major share of<br />
Russian domestic demand for various chemicals<br />
and is a major exporter of chemicals to more than<br />
30 countries worldwide.<br />
In accordance with its development<br />
strategy in the petrochemicals sector,<br />
LUKOIL is steadily increasing production<br />
of chemicals with high value added<br />
(polymers, monomers and organic synthesis<br />
products) and reducing production<br />
of chemicals with low value added<br />
(secondary pyrolysis products and<br />
fuel fractions).<br />
LUKOIL petrochemical plants including Neftokhim<br />
Burgas produced 1,466 million tonnes of petrochemicals<br />
in 2011, which is 41.5% more than in 2010.<br />
The increase was due to launch of production at<br />
Karpatneftekhim in September 2010.<br />
The price environment on the petrochemical<br />
market was unfavourable in 2011. Sales prices in<br />
Russia for polyethylene rose by 3.8%, but prices for<br />
polypropylene fell by 9.5%, and prices for benzol<br />
fell by 5.8%. Prices for the same outputs also declined<br />
in Europe, by 3.1% for polyethylene, 17.2% for<br />
polypropylene and 6.7% for benzol.<br />
LUKOIL implemented various measures in 2011 for<br />
modernization of existing production and installation<br />
of new facilities as part of its strategy<br />
for development of the petrochemical sector. Capital<br />
expenditures in the sector were $89 million in<br />
2011, which is 17% more than in 2010.<br />
A unit for production of polyvinyl chloride (PVC)<br />
suspension was built and brought into operation<br />
during 2011 at Karpatneftekhim. Equipment<br />
assembly began as part of the construction of PVC<br />
production unit, which should be commissioned<br />
in 2012.<br />
Work was completed in the reporting year at<br />
Saratovorgsintez for expansion of sodium cyanide<br />
production to a level of 18,000 tonnes per year.<br />
A particularly large project scheduled for coming<br />
years is the creation of an industrial complex at<br />
Stavrolen for processing of Northern Caspian gas.<br />
Inputs will come from fields under LUKOIL development<br />
in the Caspian region. The purpose of the<br />
project is to achieve more value-added by deeper<br />
refining of ethane and natural gas liquids. The complex<br />
will also process ethylene into polyethylene, polypropylene<br />
and other chemical products. A first<br />
production line is scheduled to open in 2015<br />
with capacity of 2 billion cubic meters of gas and<br />
modernization of existing ethylene and polyethylene<br />
units will be completed at the same time.<br />
Pre-project studies and preparatory work for<br />
construction of the complex were carried out in 2011.<br />
They included synchronization of schedules and<br />
stages of construction with the time-frame for<br />
development of fields in the Northern Caspian,<br />
preparation of project documentation for the gas<br />
processing unit with initial processing capacity<br />
of 2 billion cubic meters, and positive outcomes of<br />
official studies by Government. The Russian Government<br />
also approved the passport for a regional<br />
investment project, which will enable release of budget<br />
financing for construction of external infrastructure<br />
facilities, including rail links and high-tension<br />
power transmission lines.<br />
65
3<br />
Power Generation<br />
66
Annual report 2011<br />
LUKOIL power generating companies<br />
67
LUKOIL’s new business sector, Power Generation,<br />
was created in 2008 as part of the Group’s Strategic<br />
Development Program, and the sector has a special<br />
role to play in the Group’s updated Strategy for<br />
2012–2021. Power Generation will be an important<br />
factor for growth of cash flow and shareholder value<br />
in the long term.<br />
The business comprises all aspects of power<br />
generation, including delivery and marketing of<br />
electrical energy and of heat produced at power<br />
plants. The nucleus of the segment is the Russian<br />
power generating company, UGK TGK-8, which was<br />
acquired by LUKOIL in 2008, but it also includes<br />
companies producing electricity and heat at<br />
Company refineries in Bulgaria, Romania, and Ukraine.<br />
This business sector provides energy<br />
both for the Company’s own needs (in the<br />
Exploration & Production and Refining<br />
& Marketing segments) and for external<br />
power and heat customers in the Southern<br />
Federal District of Russia.<br />
Structural transformations<br />
From January 1, 2011 hydroelectric stations owned<br />
by LUKOIL-Rostovenergo and LUKOIL-Kubanenergo<br />
were transferred to the new company, LUKOIL-<br />
Ecoenergo.<br />
In August 2011 Dagestanenergo was sold by LUKOIL<br />
Group as part of final procedures for the disposal<br />
of power assets in the Republic of Dagestan.<br />
Electricity and heat generation<br />
Companies in LUKOIL’s Power Generation segment<br />
generated about 12.6 billion kWh of power in 2011.<br />
Total supplies of heat were 15.2 million Gcal, of<br />
which 13.8 million Gcal in Russia. Levels of production<br />
were dictated by conditions on the market for<br />
electricity and heat energy.<br />
Work continued in 2011 under the Capacity Provision<br />
Agreement, to which LUKOIL subscribed when<br />
it acquired assets during reorganization of RAO<br />
Structure of LUKOIL’s Power Generation business<br />
68
Annual report 2011<br />
UES (the former Russian power sector monopoly).<br />
Combined-cycle facilities in Astrakhan Region (110-<br />
megawatt capacity) were brought into operation,<br />
and launch of a 410-megawatt combinedcycle<br />
generator is scheduled for 2012 in Krasnodar.<br />
These two facilities, with combined capacity in<br />
excess of 500 megawatts are only the first stage of<br />
LUKOIL’s ongoing work for modernization of Russian<br />
energy facilities and capacity increase in energydeficient<br />
regions. Other projects in the Southern<br />
Federal District in fulfilment of the Capacity Provision<br />
Agreement are now being developed, and<br />
LUKOIL is committed to building 900 megawatts of<br />
generating capacity in total.<br />
Liberalization of the wholesale market for electrical<br />
energy and capacity entered its concluding stage<br />
in 2010 and these markets were fully liberalized in<br />
2011. However, government regulation continues to<br />
have significant impact on the power generating<br />
segment. Amounts of electrical and heat energy,<br />
which the Government requires to be sold at regulated<br />
tariffs remains substantial (up to 35% of out-<br />
puts by some generators). In 2011 electricity and<br />
capacity was sold at regulated tariffs to households<br />
and other consumers with equivalent status.<br />
Small-scale generating<br />
LUKOIL is rapidly developing its own electricity<br />
generating facilities at oil and gas fields, enabling<br />
the Group to substantially reduce electricity<br />
purchases and increase the rate of associated<br />
gas use by using it to generate electricity at gasfired<br />
facilities. The Company has total smallgenerating<br />
capacity of 549 MW. Electricity generation<br />
at company facilities in this segment were 2,201 GWh<br />
in 2011, representing 17.3% of total consumption of<br />
electricity in production operations.<br />
Electricity supply arrangements have been made<br />
more secure by use of the latest technologies<br />
in investment projects for construction and<br />
reconstruction of the Company’s own generating<br />
facilities. Use of new technologies also enables<br />
the Company to limit spending on its electricity<br />
69
needs, through improvement of energy efficiency<br />
and use of the Company’s own refined products<br />
as generating fuel.<br />
Energy-saving technologies<br />
LUKOIL works constantly to improve reliability of<br />
its electricity supply arrangements and to reduce<br />
spending on energy. These efforts have been<br />
coordinated through corporate programs for energy<br />
saving and improvement of the reliability of power<br />
supplies.<br />
An energy-saving Program for LUKOIL organizations<br />
was approved at the start of the reporting year,<br />
prepared on the basis of proposals by enterprises<br />
themselves with the objective of limiting and reducing<br />
energy consumption in hydrocarbon production<br />
and refining, petroleum product marketing, petrochemicals,<br />
power generation and transportation.<br />
Energy savings of $35 million were achieved in 2011<br />
thanks to the Program.<br />
In 2011 LUKOIL developed an energy efficiency policy,<br />
which coordinates actions in this sphere throug-<br />
hout the Group. The policy defines progressive<br />
solutions and indicators for equipment quality,<br />
application of which will be compulsory in planned<br />
future projects. All investment projects and programs<br />
were subjected to expert analysis to ensure their<br />
compliance with criteria of energy efficiency and use<br />
of the latest energy saving solutions.<br />
Rational use of electricity substantially reduces<br />
Group spending on energy resources. An automated<br />
information and measurement system for industrial<br />
metering of electricity use has been installed and<br />
is operational at all Company subsidiaries. The system<br />
enables reduction of spending on electrical energy<br />
by most advantageous use of tariffs that are<br />
differentiated according to the time of day, by greater<br />
accuracy of metering, and by enabling purchase<br />
of electrical energy and capacity on the wholesale<br />
market.<br />
During 2011 LUKOIL addressed issues connected<br />
with installation of an energy management system<br />
and certification to the ISO 50001 international<br />
standard ‘Energy Management Systems – Requirements<br />
and Guidance’. Risks, viability and cost of the<br />
70
Annual report 2011<br />
system were assessed, a provisional schedule and<br />
road map for implementation were prepared, and<br />
pilot projects were selected.<br />
Renewable energy<br />
LUKOIL specialists appreciate the huge potential<br />
of resource and energy savings, which is offered<br />
by alternative sources of energy. Priority types of<br />
alternative renewable energy include hydro, wind,<br />
solar and geothermal energy. LUKOIL is developing<br />
alternative energy in partnership with international<br />
companies, which are already engaged in this<br />
sphere. In 2011 LUKOIL rapidly developed cooperation<br />
in the field of renewables with the Italian<br />
company, ERG Renew, which has extensive experience<br />
in construction and operation of renewable<br />
energy facilities. A working group of LUKOIL and<br />
ERG Renew is designing a number of wind-energy<br />
projects in Bulgaria, Romania, Ukraine and Russia.<br />
First priority has been given to renewable-energy<br />
power stations in countries where the Company<br />
has strong operating presence and where there<br />
is administrative and economic support for renewable<br />
energy at government level. This particularly<br />
concerns projects for wind power stations in Bulgaria<br />
and Romania.<br />
In Uzbekistan LUKOIL is working on a project for<br />
construction of a solar power station with 100<br />
megawatt capacity in association with the Uzbek<br />
Government and the Asian Development Bank.<br />
At the end of 2011 a 1.25 megawatt photovoltaic<br />
(solar) generating facility was brought into use at<br />
a fuel-fired power station belonging to LUKOIL<br />
in Bulgaria. Estimated annual production of electricity<br />
is about 1,500 megawatt-hours. Operation of<br />
the solar power facility will substantially reduce<br />
environmental impacts.<br />
71
4<br />
Sales and Marketing<br />
72
Annual report 2011<br />
Strategy<br />
Logistics optimization: reduction<br />
of transportation expenses<br />
Tight management of trade flows<br />
Increase of trading operations efficiency<br />
Increase of retail sales of petroleum<br />
products and related goods<br />
and services<br />
Retail network optimization<br />
Crude oil sales<br />
Total volume of crude oil sales by the Company<br />
in 2011, including deliveries for refining at the<br />
Company’s own refineries and at third-party<br />
refineries, was 110 million tonnes. Deliveries of oil to<br />
the domestic market were more efficient than most<br />
non-CIS delivery export routes, therefore substantial<br />
volumes of oil were reallocated from less efficient<br />
export routes to Company refineries or to the<br />
domestic market. Refining at facilities inside<br />
Russia remains the most efficient use<br />
of crude oil produced by LUKOIL. Crude oil<br />
deliveries to Group refineries in Russia in<br />
2011 were 45.3 million tonnes in 2011, which is almost<br />
the same as in 2010.<br />
Crude oil volumes of 259,000 tonnes were also<br />
purchased from third parties with delivery to the<br />
Nizhny Novgorod and Ukhta Refineries, enabling<br />
reallocation of the Group’s own oil to the most<br />
profitable export routes.<br />
The Company resumed the practice of crude oil<br />
substitution arrangements in deliveries for refining<br />
at third-party refineries. These third-party refineries<br />
were: the Ufa group of refineries, the Krasnodar,<br />
Khabarovsk, Ilsky, Mary and Antipinsky refineries, the<br />
Slavyansky Bitumen Plant and the Afipsky Refinery.<br />
Total of 1.43 million tonnes of the Company’s oil were<br />
supplied via these arrangements, and an equivalent<br />
73
quantity of oil belonging to counter parties was<br />
delivered to the Nizhny Novgorod and Ukhta refineries.<br />
Substitution arrangements give additional economic<br />
benefits through optimization of transport<br />
costs.<br />
Deliveries of LUKOIL feedstock to the Group’s foreign<br />
refineries and to the ISAB and Zeeland complexes<br />
were 19.6 million tonnes in 2011, which is 6.3%<br />
less than in 2010, mainly due to suspension of operations<br />
at the Odessa Refinery at the end of 2010. Deliveries<br />
of oil for refining at third-party refineries outside<br />
Russia totalled 0.27 million tonnes, which is many<br />
times more than in 2010 thanks to resumption<br />
of deliveries to refineries in Belarus and growth of<br />
deliveries to refineries in Kazakhstan.<br />
Crude oil sales on the domestic market totalled<br />
4.5 million tonnes in 2011, exceeding the figure in 2010<br />
by 22.8%. Domestic crude sales contracts are arranged<br />
to ensure guaranteed take-up of crude oil on the<br />
domestic market using formulas that offer a premium<br />
to the export alternative.<br />
Crude oil exports from Russia by LUKOIL subsidiaries<br />
(including oil acquired from other producers) were<br />
34.7 million tonnes in 2011 (696,800 barrels per day),<br />
which is 14.5% less than in 2010. Lower exports were<br />
the result of lower output of crude oil.<br />
Most of the Company’s exports of crude oil are<br />
delivered via the Transneft pipeline system (deliveries<br />
via the system accounted for 84.7% of exports),<br />
but Transneft deliveries declined by 6.9% in 2011 to<br />
29.4 million tonnes. The share of export deliveries<br />
by-passing the Transneft system decreased in 2011<br />
Structure of crude oil deliveries, %<br />
from 22.2% to 15.2%, due to reduction of output<br />
at the Yuzhno-Khylchuyuskoye field. The latter deliveries<br />
were valued on the basis of actual quality of<br />
the crude oil, with a premium to the Urals price.<br />
The Company exported 5.1 million tonnes of<br />
crude oil via its own transport terminals<br />
in 2011. Exports through the Varandey<br />
terminal accounted for 4 million tonnes,<br />
and exports through the port of Svetly<br />
were 1.1 million tonnes.<br />
In 2011 LUKOIL set up a joint venture for development<br />
of the R. Trebs and A. Titov oil fields, signing<br />
an agreement for acquisition by LUKOIL of a 25.1%<br />
stake in Bashneft-Polyus which owns the license for<br />
mineral resource use at the fields. A joint-venture<br />
agreement was also signed, under which oil from<br />
the Trebs and Titov fields will be transported via the<br />
Varandey Terminal.<br />
Work was carried out in 2011 to optimize export<br />
routes. Deliveries of oil via the port of Novorossiysk<br />
were substantially reduced due to low efficiency<br />
(until November 2011) and excess volumes were allocated<br />
to the most efficient export routes (Belarus and<br />
Kazakhstan) and to third-party refineries in Russia.<br />
Sales of crude oil on the international market (including<br />
exports) were 43.8 million tonnes in 2011, of which<br />
6.2 million tonnes were sold in the CIS countries<br />
and 37.6 million tonnes on other markets. Total sales<br />
of oil on Russian and international markets in 2011<br />
were 48.3 million tonnes, which is 6.1% less than<br />
in 2010.<br />
Crude oil exports from Russia, million tonnes<br />
1<br />
Including oil products delivered to ISAB and Zeeland.<br />
74
Annual report 2011<br />
Gas Sales<br />
The gas segment is a new and rapidly developing business segment for LUKOIL<br />
Group. Expansion in the gas segment is one of the Company’s strategic goals, since<br />
commercialization of gas reserves will significantly boost Company value<br />
Sales of natural, associated and stripped dry gas by<br />
the Group’s Russian organizations totalled 13.846<br />
billion cubic meters in 2011, which is 2% less than<br />
in 2010. In particular, 9.780 billion cubic meters of gas<br />
were sold to Gazprom (including nearly 8.3 billion<br />
cubic meters of natural gas from the Company’s<br />
Nakhodkinskoye field) and 4.066 billion cubic meters<br />
of gas were sold to other consumers (including<br />
deliveries to the Company’s own gas-processing<br />
plants).<br />
LUKOIL reached agreement with Gazprom in the<br />
reporting year on deliveries of 8.35–12.11 billion<br />
cubic meters of gas from fields in the Bolshekhetskaya<br />
Depression during 2012–2016 at a price equal<br />
to the minimum stipulated by the Federal Tariff Service<br />
for industrial users in the Yamal-Nenets Autonomous<br />
District minus 15%. The agreement also<br />
states that Gazprom will make every effort to accept<br />
all of LUKOIL’s gas output from fields in the Northern<br />
Caspian into its gas transport system after LUKOIL<br />
begins production in that region and will deliver<br />
equivalent amounts to LUKOIL enterprises.<br />
Thanks to intensive work by Company specialists,<br />
amendments have been made to the principles by<br />
which gas transportation tariffs via the Gazprom<br />
pipeline system are calculated for external producers.<br />
The amendments enable efficient transportation<br />
of gas over large distances.<br />
sales to Gazprom and 1,703 rubles in sales to endusers).<br />
The increase was due to growth in the share<br />
of more efficient sales to end-users and of prices for<br />
end-users.<br />
LUKOIL selling price for gas, rubles per thousand<br />
cubic meters<br />
Structure of gas sales by LUKOIL, rubles per<br />
thousand cubic meters<br />
Average-weighted price of gas sales in the reporting<br />
year rose by 5% in comparison with 2010 to 1,290<br />
rubles per thousand cubic meters (1,159 rubles in<br />
75
Gas Production and Supply Structure<br />
Russia<br />
Natural gas<br />
Associated Gas<br />
International<br />
Natural gas<br />
Associated Gas<br />
76
Annual report 2011<br />
Petroleum Product Marketing<br />
LUKOIL retail network (number of filling stations) As of 31.12.2011<br />
77
Structure of petroleum product sales in 2011<br />
(own production, wholesale and retail)<br />
reporting year: company exports were dominated<br />
by diesel fuel, fuel oil and gasoil, which together<br />
accounted for 89% of total export volumes.<br />
The Company’s petroleum product export structure<br />
mainly corresponds to the structure of product<br />
exports from Russia as a whole.<br />
Railway remained the chief means of transport for<br />
Group exports of petroleum products (about 79%<br />
of the total). Products were carried by railway to<br />
the Vysotsk terminal, via which 9.9 million tonnes<br />
of products were dispatched in 2011 (including<br />
0.5 million tonnes of vacuum gasoil, 2.0 million tonnes<br />
of diesel fuel and 6.4 million tonnes of fuel oil).<br />
Petroleum products were also exported by sea and<br />
by pipeline (12% and 9% of export volumes, respectively).<br />
Petroleum product and petrochemical<br />
wholesale<br />
LUKOIL sold 11.0 million tonnes of petroleum products<br />
to wholesale customers on the domestic market in<br />
2011, representing an increase of 0.4% compared<br />
with 2010.<br />
Export of petroleum products declined by 6.9%<br />
in 2011 to 24.0 million tonnes as deliveries of medium<br />
distillates to the domestic market were increased.<br />
The structure of exports remained unchanged in the<br />
Structure of petroleum product exports, %<br />
Work continued in 2011 to raise the efficiency of<br />
petroleum product sales by improvement of logistics<br />
arrangements. Deliveries of low-density polyethylene<br />
and polypropylene were redirected from export<br />
routes to the domestic market, and from less<br />
profitable to more profitable export routes (from<br />
China to Ukraine, Azerbaijan and Kyrgyzstan). Mutual<br />
deliveries of petrochemicals were made in 2011 under<br />
agreements between LUKOIL and SIBUR Holding,<br />
which gave additional economic benefits due to<br />
optimization of delivery routes.<br />
LUKOIL is rapidly developing its international petroleum<br />
product trading business, increasing both<br />
scale and international diversification of this business.<br />
The Group’s objective is to achieve maximum<br />
efficiency in resource placement, including direct<br />
sales to end-users by-passing third-party traders,<br />
deliveries of third-party’s resources and efficient<br />
provision of the Company’s own networks.<br />
LUKOIL has trading offices in nine countries worldwide<br />
and makes deliveries of crude oil and petroleum<br />
products to markets in Europe, the USA and the<br />
Asia-Pacific region, as well as increasing its sales<br />
volumes in new regions (Africa, Latin America and the<br />
Middle East). The Company had trading business in<br />
90 countries worldwide during the reporting year.<br />
78
Annual report 2011<br />
Petroleum product retail<br />
LUKOIL’s retail network operated in 26 countries at<br />
the start of 2012, including Russia, CIS and European<br />
countries (Azerbaijan, Belarus, Belgium, Bulgaria,<br />
Croatia, Cyprus, Czech Republic, Estonia, Finland,<br />
Georgia, Hungary, Italy, Latvia, Lithuania, Luxembourg,<br />
Macedonia, Moldova, Montenegro, Poland,<br />
Romania, Serbia, Slovakia, Turkey and Ukraine) as well<br />
as the USA. The network included 183 storage facilities<br />
with total reservoir capacity of 2.7 million cubic<br />
meters and 5,994 filling stations (including franchises).<br />
Retail sales of petroleum products through<br />
owned and leased filling stations increased<br />
by 6% in the reporting year compared with<br />
2010 to a level of 15.25 million tonnes. In<br />
2011 average daily sales per filling station<br />
(owned and leased) rose from 8.1 (in 2010)<br />
to 8.8 tonnes.<br />
Increase of retail sales mainly reflected a trend on<br />
the Russian market, where sales volumes were 15.4%<br />
higher than in 2010. There was a scheduled reduction<br />
in sales of Class-2 fuel in Russia during 2011 due to<br />
the Government’s Technical Regulations, but half of<br />
the country’s producers lacked technical capacity<br />
to produce higher-class fuels. So there was a major<br />
shortage of high-quality fuel on the domestic market<br />
in 2011. Demand for LUKOIL fuels at Russian filling<br />
stations was higher than earlier predictions based<br />
on natural growth of annual consumption and seasonal<br />
demand increases. However, sales on the<br />
international market declined in 2011, mainly due<br />
to restructuring of the Company’s retail network in<br />
the USA.<br />
closed permanently). At the same time, construction<br />
and acquisition of highly-efficient stations<br />
continued, and upgrading was carried out at existing<br />
stations. In Europe and the CIS 10 filling stations were<br />
built, 8 were acquired and 80 were upgraded (including<br />
installation of gas modules and rebranding<br />
actions). In Russia 34 filling stations were built and<br />
brought into operation, 35 were upgraded and<br />
35 were acquired.<br />
Investments for development of the retail business<br />
totalled $339 million in 2011.<br />
The Company continued to implement its program<br />
for development of a marketing and sales network<br />
for liquefied and compressed gas in 2011. Total<br />
Group sales of these products were 891,000 tonnes<br />
(of which 489,000 tonnes via the retail network),<br />
which is 6.5% more than in 2010.<br />
The Company continued to develop its system for<br />
non-cash payment by customers at its filling stations<br />
in 2011, using the LICARD fuel card system. A total of<br />
2,796 filling stations in Russia (including franchises)<br />
were capable of accepting the cards for payment<br />
at the start of 2012. There were 771 stations using<br />
the cards outside Russia. Total volume of fuel sales<br />
using LICARD was 4.3 million tonnes in 2011 with<br />
total value of $4.9 billion, including about 3.9 million<br />
tonnes sold in Russia.<br />
The Company continued optimization of its retail<br />
network in 2011 in order to reduce costs and increase<br />
efficiency. In Europe and CIS countries<br />
78 filling stations were optimized (21 were leased,<br />
6 were closed down, and 51 were put under dealer<br />
management). In Russia the changes affected<br />
102 filling stations (27 were leased, 9 were closed<br />
down, 18 were sold, and 48 were put under dealer<br />
management) and 9 storage facilities (1 was leased,<br />
4 were sold, 2 were temporarily closed, and 2 were<br />
79
LUKOIL has been implementing a customer incentive<br />
scheme since the middle of 2010, and 2.5 million<br />
customers in Russia had been brought into the<br />
scheme as of January 1, 2012. Total fuel sales using<br />
incentive cards were about 2 million tonnes in 2011.<br />
Russia<br />
As of January 1, 2012 LUKOIL’s retail network in Russia<br />
consisted of 2,336 filling stations (including franchises)<br />
and 109 storage facilities with reservoir capacity<br />
of 1.12 million cubic meters. The filling stations<br />
and storage facilities are operated by 7 petroleum<br />
product supply organizations, which do business<br />
in 62 of Russia’s administrative regions.<br />
Volume of retail sales of petroleum<br />
products on the domestic market in 2011 was<br />
8.3 million tonnes, which is 18.3% more than<br />
in 2010. Average daily sales per filling station<br />
in Russia rose from 10.2 to 11.7 tonnes, which<br />
is 14.7% more than in 2010.<br />
Investments in development of the Group’s Russian<br />
retail business were $216 million in 2011.<br />
The Company carried out various actions in 2011<br />
to lower expenses and raise efficiency of its Russian<br />
marketing network. These included the sale of<br />
19 filling stations and 1 storage facility, leaseout<br />
of 33 filling stations, closure of 7 stations and<br />
transfer of 81 to dealer management, while 2 storage<br />
facilities suspended operations, 2 were closed<br />
and 2 were leased out. The Group built 34 new filling<br />
stations, upgraded 35 existing stations and acquired<br />
35 stations.<br />
The Company continued to develop production<br />
and sales of its new-generation EKTO fuel brands in<br />
2011 in order to maximize profitability. Total sales<br />
of EKTO fuels (gasoline and diesel) in 2011 through<br />
the Company’s retail network in Russia were<br />
2.8 million tonnes, which is 5% more than in 2010.<br />
The share of EKTO products in overall retail sales of<br />
motor fuel in 2011 was about 34%.<br />
Since the first quarter of 2011 production of highoctane<br />
gasoline (92/95) at Company’s refineries<br />
80
Annual report 2011<br />
has been in compliance with the Class-4 (Euro-4)<br />
requirements of the Russian Technical Regulations.<br />
Development of retail sales of non-fuel products<br />
and services is an important part of the Group’s Refining<br />
& Marketing Strategy and work in this direction<br />
was continued in 2011. Revenue from sales of nonfuel<br />
products and services through the Group’s retail<br />
network amounted to $193 million in 2011, which is<br />
32.2% more than in 2010 (45% of this revenue was<br />
from sales of food products, 23% represented packaged<br />
goods, and 32% was from sales of accessories<br />
and services). The revenue increase reflects<br />
improvement in service quality at filling stations<br />
and optimization of the range of goods and services.<br />
Development of non-fuel business is an important<br />
factor for positioning of LUKOIL Group as a customeroriented<br />
company with international standards<br />
of service.<br />
International<br />
LUKOIL’s retail network in the CIS (outside Russia),<br />
Europe, and the USA consists of 3,658 filling stations<br />
(including franchises) and 74 storage facilities with<br />
reservoir capacity of 1.6 million cubic meters.<br />
Investments in development of international retail<br />
network were $123 million in 2011.<br />
Retail sales of petroleum products on international<br />
markets in the reporting year were 6.9 million tonnes,<br />
which is 5.0% less than in 2010. The decline was mainly<br />
due to restructuring of the retail network in the<br />
USA. Average daily sales per filling station in Europe<br />
were 6.8 tonnes compared with 6.5 tonnes in 2010.<br />
Withdrawal of inefficient stations gave an increase in<br />
sales volume per filling station comparing with 2010,<br />
despite reduction of demand in some countries.<br />
Work continued to promote the Group’s EKTO fuel<br />
brand on foreign markets in 2011 (in Lithuania, Latvia,<br />
Estonia, Ukraine, Romania, Turkey, Moldova, Bulgaria,<br />
Macedonia and Croatia). The geography of EKTO<br />
sales is expanding year by year, and will be extended<br />
to Azerbaijan and Montenegro in 2012. Total sales<br />
of EKTO fuel (diesel and gasoline) outside Russia<br />
in 2011 were 723,000 tonnes, via more than 1,200<br />
filling stations.<br />
A loyalty program was implemented in 2011 for<br />
customers using the LUKOIL-brand filling station<br />
network in Turkey. A total of 432 stations have joined<br />
the program and more than 400,000 loyalty cards<br />
have been issued. A loyalty program was also launched<br />
in Romania, where 30 filling stations in Bucharest<br />
have joined the pilot program.<br />
Abroad, as well as in Russia, LUKOIL is working hard to<br />
increase profitability of its filling stations, particularly<br />
through development of retail sales of non-fuel<br />
products and services. Revenue from sales of non-fuel<br />
products and services at filling stations in Europe and<br />
the CIS was $507 million in 2011, which is 10% more<br />
than in 2010. The Company plans to further increase<br />
non-fuel revenues from filling stations abroad through<br />
marketing, optimization of the product range,<br />
improvement of fast-food services at filling stations,<br />
new service additions, work with suppliers, use of best<br />
trading practices, and better standards of customer<br />
service.<br />
Average daily sales of petroleum products per<br />
filling station, tonnes per day<br />
The Group brought 18 filling stations into operation<br />
in Europe and the CIS during 2011, of which 10 were<br />
newly built and 8 were acquired, and 80 stations were<br />
upgraded.<br />
81
Trade Balance of LUKOIL<br />
Subsidiaries (2011)<br />
Russia<br />
International<br />
82
Annual report 2011<br />
83
5<br />
Technology<br />
and Innovation<br />
84
Annual report 2011<br />
Innovation and the application of new<br />
technologies are among the main competitive<br />
strengths of LUKOIL. The Company’s<br />
specialists both design new technologies<br />
and work to modernize existing technologies.<br />
Total Research and Development financing increased<br />
in 2011 and accounted for more than $140 million<br />
(comparing with more than $120 million in 2010).<br />
Organizational transformation of LUKOIL’s scientific<br />
project capacities was completed in 2011. Four regional<br />
institutes were taken into LUKOIL-Engineering,<br />
which established five branches in different geographical<br />
regions where it has activities. The institutes,<br />
which are the core of LUKOIL’s scientific project<br />
capacity, carried out R&D work, project studies and<br />
other work with total value of $310 million in 2011.<br />
A LUKOIL working group was set up in 2011 to consider<br />
issues associated with participation in the Russian<br />
Government’s Skolkovo innovation project. Work<br />
was carried out during the year on selection of scientific<br />
and technology projects, which have been recommended<br />
for implementation as part of joint work<br />
with the Skolkovo Innovation Center. Joint scientific<br />
research work between OJSC RITEK ( LUKOIL subsidiary)<br />
and the Skolkovo Center is scheduled in 2012–2014.<br />
The Group continued to work closely in 2011 with the<br />
Russian Corporation of Nanotechnologies (RUSNANO)<br />
on commercialization of nanotechnologies and<br />
their application in the oil and gas industry. OJSC<br />
RITEK carried out joint work with RUSNANO during<br />
the accounting year on innovative developments<br />
for extraction of difficult reserves in Bazhenov<br />
formations.<br />
85
Exploration & Production Technologies<br />
LUKOIL fully recognizes the vital role of technology<br />
in supporting competitiveness of the Exploration<br />
& Production segment. Most R&D work in the segment<br />
in 2011 was focused on development of geological<br />
and geophysical study techniques, improvement of<br />
reserve assessment methods (work continued on<br />
a methodology to assess hydrocarbon reserves in<br />
reservoirs with complex structure), as well as design<br />
and improvement of methods for increasing oil<br />
recovery and optimizing technological solutions<br />
used for development of new areas and deposits.<br />
The Company is particularly keen to develop<br />
technologies that ensure environmental safety during<br />
field development, most notably in development<br />
of offshore fields.<br />
Structure of EOR techniques used by LUKOIL<br />
Group in 2011<br />
A program of industrial testing enabled<br />
a technology breakthrough in 2011, which<br />
raises the forecast for viable development<br />
of new reserves in 2012–2021 by 3.6 billion<br />
barrels of oil thanks to increase of oil<br />
recovery rates at fields in Russia.<br />
New drilling technologies<br />
LUKOIL made particularly rapid advances during<br />
2011 in drilling of horizontal wells that use multizonal<br />
hydrofracturing of strata. A total of 96 wells with multizonal<br />
hydrofracturing were brought into operation<br />
in 2011 and gave 637,000 tonnes of oil. Average daily<br />
oil flow from the wells was 56.3 tonnes. Application<br />
of this technique at the Urevskoye and Tevlinsko-<br />
Russkinskoye fields led to significant adjustment<br />
of field development plans, increasing the target<br />
recovery factor and thereby raising rates of return<br />
in these investment projects.<br />
In another technology advance an expanded<br />
logging-while-drilling (LWD) complex was used for<br />
construction of horizontal wells on an industrial scale,<br />
enabling real-time drilling of horizontal boreholes<br />
in productive strata, thereby ensuring maximum<br />
contact with the reservoir.<br />
Drilling of horizontal wells in the depression at wells<br />
in Western Siberia gave an increase of oil flow rates<br />
by 2–4 times compared with previously drilled wells<br />
using clay-polymer solutions, while reducing unit<br />
costs by 30%.<br />
Successful work in drilling and invariant well completion<br />
led to significant adjustment of production drilling<br />
programs for the medium term, when the<br />
Company plans to make greater use of complex<br />
completion. This work has also had favourable impact<br />
on the economics of investment projects.<br />
86
Annual report 2011<br />
Enhanced oil recovery<br />
techniques<br />
One key outcome of the Company’s technology<br />
drive is ever greater application of methods for<br />
intensification of oil production and of enhanced<br />
oil recovery (EOR) techniques. These methods offer<br />
significant increase of recoverable reserves and oil<br />
production, enabling commercial development of<br />
high-viscosity oil, oil in low permeability reservoirs,<br />
and hard-to-recover reserves at late stages of<br />
field development. In recent years the share<br />
of oil produced at LUKOIL fields using various<br />
technologies that act on oil strata has been over<br />
20% of total oil production. The Company applies<br />
physical, chemical, hydrodynamic and heat methods<br />
to stimulate extraction.<br />
The Group carried out 4,894 EOR operations in<br />
2011, which is roughly equal to the number in 2010.<br />
Additional production obtained as a result of EOR<br />
techniques was 22.3 million tonnes, or 26% of total<br />
Shares of additional production obtained by use<br />
of various EOR techniques in 2011<br />
oil production by the Company in Russia. Most of the<br />
additional production volume (almost 14.5 million<br />
tonnes) was obtained using physical methods,<br />
primarily hydrofracturing.<br />
The Group carried out 681 hydrofracturing operations<br />
at fields in 2011, achieving average additional oil<br />
flows of 10.8 tonnes per day. The effectiveness of<br />
hydrofracturing operations in 2011 was comparable<br />
with results in 2010. Maintenance of levels of additional<br />
output from hydrofracturing was achieved<br />
through improvement of project planning, selection<br />
of wells using permanently acting hydrodynamic<br />
models, and tighter quality control over the materials<br />
and reagents, which were used by service companies.<br />
Use of other EOR methods (hydrodynamic, heat,<br />
chemical methods and oil production intensification)<br />
gave 8 million tonnes of production. The Company<br />
continued to make extensive use of the latest chemical<br />
technologies in 2011 (there were 1,417 operations<br />
using chemical technologies in 2011 compared with<br />
1,351 in 2010).<br />
Drilling of sidetracks at existing wells has also proved<br />
a highly-efficient form of EOR. The Company continued<br />
drilling of sidetracks in 2011 (241 sidetracks drilled<br />
in comparison with 224 in 2010), giving an average<br />
daily flow increase of 20.4 tonnes. Consistently high<br />
efficiency was achieved through science-based miniprojects<br />
with use of hydrodynamic modelling, as well<br />
as greater accuracy in forecasting of the geological<br />
structure of reserves at locations where sidetracks<br />
were drilled. Sidetracks are mainly used to extract<br />
residual oil reserves at wells, which have been taken<br />
out of operation.<br />
Production of high-viscosity oil<br />
LUKOIL is rapidly developing and applying new<br />
technologies for production of high-viscosity oils.<br />
Experience of work with high-viscosity oil extraction<br />
in Russia is concentrated in the Komi Republic,<br />
where LUKOIL is developing the Yaregskoye and<br />
Usinskoye fields. Thermal methods are used at both<br />
fields to increase oil recovery and annual production<br />
is over 3 million tonnes.<br />
87
Effect from EOR (2011)<br />
Additional production from EOR in Russia,<br />
million tonnes<br />
Use of chemical methods, wells<br />
88
Annual report 2011<br />
The Permocarbon deposit at the Usinskoye field<br />
is being developed using steam-heating and cyclicsteam<br />
stimulation across extended areas. There<br />
has been successful work in recent years to improve<br />
efficiency of thermal applications at vertical wells<br />
(development of combined cyclic-steam stimulation<br />
(CSS) is being continued and trials have begun to<br />
increase oil flow through simultaneous injection<br />
of heat carriers and composites for oil displacement).<br />
New thermal technologies are being introduced:<br />
steam-heat stimulation of rock formations in horizontal<br />
well systems; technology for perpendicular<br />
thermo-gravitational deposit draining; CCS technologies<br />
for horizontal wells, vertical wells with radial<br />
channels, and for an entire productive interval; and<br />
technologies for oil recovery by steam. Additional<br />
oil production at the deposit obtained by use of<br />
thermal methods has been in excess of 6.1 million<br />
tonnes since the start of their application.<br />
The Company applied thermal action on strata via<br />
a horizontal-well system for the first time in 2011<br />
(in test mode). Experimental work with perpendicular<br />
thermo-gravitational strata draining is planned<br />
for 2012.<br />
The Yaregskoye field is being developed using<br />
a thermal mine-shaft technology (production at the<br />
field mainly uses a mining technique). Work began<br />
in test mode during 2011 to improve heat treatment<br />
applications by use of a new drilling rig which enables<br />
underground boreholes to be drilled to a length<br />
of 800 m (more than double the length of traditional<br />
underground boreholes). Use of the new drilling<br />
rig, together with use of boring combines, will<br />
substantially reduce spending on preparation for<br />
development of slanted blocks and will raise productivity.<br />
Geological and hydrodynamic<br />
models<br />
Oil and gas production subsidiaries of LUKOIL produced<br />
hydrocarbons at 358 fields in the Russian<br />
Federation during 2011. Geological and hydrodynamic<br />
modelling is used for monitoring of development<br />
processes, choice of technologies, and for measuring<br />
efficiency during production of reserves. Use of geological<br />
and hydrodynamic models enables optimal<br />
technological solutions to be put into effect during<br />
field development, and helps to select the most<br />
appropriate solutions for the specific geological<br />
structure and composition of available reserves.<br />
Modelling leads to improvement of oil recovery rates<br />
and reduces expenditures on field development.<br />
Models are widely used by the Company when<br />
drilling over fields and applying EOR methods, and<br />
are designed to cover all fields in Western Siberia,<br />
Timan-Pechora and Kaliningrad Region. Although<br />
reserves in traditional production regions have been<br />
in development for long periods of time, use of<br />
modelling has enabled the Company to keep output<br />
levels steady and in some cases to increase output.<br />
This result reflects improved quality of the models<br />
and ever greater use of such models during production<br />
drilling, as well as continued work to improve<br />
the techniques of well completion, and of primary<br />
and secondary drilling into productive strata.<br />
Number of geological-hydrodynamic field models<br />
Five pairs of production and injection wells were<br />
drilled at the Lyaelskaya area of the Yaregskoye field<br />
in 2011 with horizontal completions and borehole<br />
length up to 1,100 m. The purpose of this test work<br />
is to obtain know-how in use of horizontal boreholes<br />
for injection and production purposes. The technology<br />
is similar to Steam Assisted Gravity Drainage<br />
(SAGD), which is being applied to oil sands in Canada,<br />
and the tests have confirmed its efficiency.<br />
89
Refining Technologies<br />
LUKOIL places much emphasis on development,<br />
modernization and construction of high-tech equipment<br />
that reduces costs in refining operations and<br />
enables production of new, high-quality product<br />
types. Constant improvement of quality serves<br />
the interests of customers and protects the environment,<br />
and sales of products with a large share<br />
of value-added generate additional profit for the<br />
Group.<br />
LUKOIL is currently working on construction of new<br />
equipment and modernization of all its refineries.<br />
Re-equipment of the vacuum block on atmospheric<br />
distillation unit at the Ukhta Refinery was continued<br />
in 2011, as was modernization of the reactor<br />
block on the GDS-850 hydrodewaxer. A hydrogen<br />
fluoride alkylation unit was brought into operation<br />
in the first quarter of 2011 at the Nizhny Novgorod<br />
Refinery and scheduled production levels were<br />
achieved by the complex for catalytic cracking of<br />
vacuum gasoil, construction of which was completed<br />
at the end of 2010. At the Volgograd Refinery<br />
a new delayed coking unit with one million tonnes<br />
annual capacity was brought into operation in<br />
December 2011.<br />
The strategic development program for LUKOIL<br />
refineries 2012–2021 includes construction of a number<br />
of facilities and units, which will result in substantial<br />
increase of light product yield and volumes<br />
of high-quality gasoline and diesel outputs. There<br />
will also be a significant reduction of negative<br />
environmental impacts.<br />
Studies are also being carried out to find ways of<br />
improving energy efficiency and levels of safety in<br />
operations at oil refineries, gas-processing plants and<br />
petrochemical facilities.<br />
LUKOIL is devoting much attention to the development<br />
of the latest technologies for production<br />
of lubricants and additives, and a science and technology<br />
unit focused on this issue has been set up within<br />
the Company. Its main functions are development<br />
90
Annual report 2011<br />
and marketing of high-quality products, which are<br />
required for proper operation of the latest machinery,<br />
as well as development of new technologies<br />
and blends. This work is being carried out by Company<br />
specialists in collaboration with scientific centres<br />
in Russia.<br />
Much was done in the reporting year to optimize<br />
production processes and improve the quality of<br />
lubricant outputs. Achievements included reduction<br />
of energy consumption and improvement of the<br />
quality of base oils. The Company developed<br />
38 new lubricant types during the year. A new lubricant<br />
product line under the name LUKOIL GENESIS<br />
will be marketed in Russia during 2012, and will meet<br />
the highest standards of international vehicle<br />
producers including those for fuel economy and<br />
environmental aspects.<br />
Information Technologies<br />
We apply the latest information technologies to<br />
optimize our business processes in a variety of<br />
spheres. LUKOIL continues to develop and install automated<br />
systems for management of production<br />
and technology processes, as well as IT systems to<br />
help manage Group companies. The Company is also<br />
working to improve quality of its telecommunication<br />
systems, information security, IT hardware and<br />
office equipment.<br />
IT technologies can be of great value for enhancing<br />
the efficiency of both industrial operations<br />
and business management. LUKOIL has expanded<br />
functionality of all software programs and applied<br />
them at an ever increasing number of Group orga-<br />
nizations. Consecutive creation and development<br />
of the Integrated Management System 1 with SAP<br />
architecture had enabled installation of 24 modules<br />
at nearly 112 Group organizations by the end of 2011.<br />
There was further progress in adoption of the Global<br />
Integrated Management System, which will enable<br />
a single standard and proper organization of information<br />
flows between LUKOIL organizations: local<br />
rules for asset portfolios and/or projects and business<br />
processes were designed, using base documents<br />
of the new corporate management system. A process<br />
management model for the Group was designed,<br />
enabling harmonious interaction between<br />
business processes.<br />
1<br />
Page 83, LUKOIL Annual Report 2010<br />
91
6<br />
Social<br />
Responsibility<br />
92
Annual report 2011<br />
Environment Protection<br />
A functional development program for environmental<br />
protection was prepared in 2011 as part of<br />
LUKOIL Group Strategy 2012–2021. The following<br />
strategic guidelines for achievement of environmental<br />
security were defined:<br />
• 95% utilization of associated oil gas;<br />
• ending discharge of effluent into natural water<br />
spaces;<br />
• reducing greenhouse gas emissions and obtaining<br />
additional income through implementation<br />
of the mechanisms of Article 6 of the Kyoto<br />
Protocol;<br />
• fully overcoming the aftermath of previous<br />
environmental damage;<br />
• obtaining a ratio of waste accumulation to use/<br />
recycling of waste no higher than 1;<br />
• payments for negative environmental impact<br />
should not exceed the standard rate of such<br />
payments by more than 15%;<br />
• reduction of pipeline failures and purification<br />
of land that has been damaged as a result of such<br />
failures.<br />
93
LUKOIL is guided in its work by the highest standards<br />
of care for the environment and industrial safety.<br />
Acknowledgement of responsibility to society for<br />
rational use of natural resources and preservation<br />
of the environment in a favourable state are among<br />
key considerations for LUKOIL in implementation of<br />
its industrial projects.<br />
Scheduled work was carried out in 2011 at LUKOIL<br />
and Group organizations to ensure industrial<br />
and environmental safety and for the prevention<br />
and resolution of emergency situations.<br />
In July 2011 the Company’s senior management approved<br />
amendments for 2011–2013 to the previously<br />
approved Environmental Safety Program of LUKOIL<br />
organizations for 2009–2013. The amendments took<br />
account of an updated review of environmental<br />
issues, proposals by Group organizations, and<br />
the creation within the Group of a Power Generation<br />
business sector. Financing assigned for<br />
implementation of the Program measures in 2011–<br />
2013 is about $2 billion.<br />
More than $700 million were spent on environmental<br />
measures in the reporting year. A significant<br />
share of this money was used to comply with the<br />
Government requirement that utilization of associated<br />
gas must reach a level of 95% in 2012.<br />
Environmental measures by the Company in 2011<br />
enabled a reduction of most environmental impact<br />
indicators (including relative indicators), with the<br />
exception of atmospheric emissions. Growth of<br />
emissions was due to increased operation of smallscale<br />
generating facilities at Company production<br />
sites and resulting growth in fuel consumption, as<br />
well as increased flaring of associated gas by a number<br />
of Company organizations. We are now intensifying<br />
our efforts to raise levels of associated gas utilization<br />
in order to comply with Russian Government<br />
requirements for 95% of such gas to be utilized<br />
and thereby to avoid liability to above-standard<br />
environmental payments from 2012 onwards. All<br />
Group enterprises should be compliant with the<br />
required utilization rate by 2015.<br />
Discharge of waste water was more than halved<br />
in 2011 thanks to actions to improve efficiency of<br />
purification equipment. Reduction of water use by<br />
6% was mainly achieved as a result of technical and<br />
organizational measures for rational use of water by<br />
companies in the Power Generation sector, which is<br />
the largest user of water in the Group.<br />
The environmental and economic measures introduced<br />
by the Kyoto Protocol are an important incentive<br />
for investments to reduce greenhouse gas emissions.<br />
By the start of 2012 LUKOIL’s portfolio of projects for<br />
reduction of greenhouse gas emissions included<br />
14 projects for implementation in Russia, total<br />
impact of which in 2008–2012 should be equal to<br />
about 33 million tonnes of СО 2<br />
-equivalent. At present<br />
four projects are closest to completion: these<br />
projects have completed all the necessary design<br />
stages, secured support from Sberbank of Russia,<br />
and been approved by decrees of the Russian<br />
Ministry for Economic Development as projects for<br />
joint implementation in accordance with Article 6 of<br />
the Kyoto Protocol. A sale of emissions quotas has<br />
already been transacted for projects developed by<br />
OJSC RITEK.<br />
LUKOIL organizations pursued the goals of environmental<br />
security in 2011 through actions for rational<br />
use of water resources and prevention of water pollution,<br />
reduction of atmospheric emissions, recycling<br />
of accrued waste that contains crude oil, and nonpolluting,<br />
sustainable use of land. Specific steps carried<br />
out in the reporting year were as follows:<br />
• diagnostics and major repairs of pipelines;<br />
• modernization and construction of facilities, which<br />
increase the rate of utilization of associated gas;<br />
• acquisition of equipment for resolving crude oil<br />
and petroleum product leakages;<br />
• recultivation of disturbed land and land polluted<br />
by crude oil;<br />
• various works for monitoring of environmental<br />
components;<br />
94
Annual report 2011<br />
• construction of new and reconstruction of existing<br />
networks for water supply and water discharge;<br />
Waste water discharge, million cubic meters<br />
• installation of chlorination units for<br />
decontamination of industrial and river water;<br />
• replacement of equipment and optimization of<br />
technologies for reducing pollutant emissions;<br />
• construction of a complex for processing of waste<br />
that contains crude oil.<br />
Environmental spending, $ million<br />
A supervisory audit of LUKOIL’s health, safety<br />
and environment (HSE) management system was<br />
carried out in 2011. Auditors of the international<br />
certification company, Bureau Veritas, visited<br />
21 Group organizations. Two substantial compliance<br />
failures were detected at CJSC LUKOIL-AIK (rectified<br />
in the course of the audit) as well as 17 minor failures<br />
requiring corrective and preventative measures.<br />
Number of accidents with environmenal impact<br />
95
Health and Safety<br />
LUKOIL continued to ensure health and safety of its<br />
employees in the reporting period in accordance<br />
with the Company’s Health, Safety & Environment<br />
Policy for the 21 st Century and with due respect for<br />
Russian law and the laws of countries where LUKOIL<br />
has operations.<br />
A Program for health and safety, improvement of<br />
working conditions, and prevention and resolution<br />
of emergency situations at organizations in LUKOIL<br />
Group for 2011–2015 was designed and approved<br />
in the reporting year. The Program involves 67<br />
Company organizations and spending on measures<br />
as part of the Program in 2011 was nearly $300 million.<br />
Accident and injury rates improved in 2011 compared<br />
with 2010. There were 19 accidents at LUKOIL<br />
organizations during the year compared with 43 in<br />
2010. The number of people who suffered injuries<br />
as a result of accidents declined from 49 to 25, and<br />
there were no fatalities (compared with 2 fatalities<br />
in 2010).<br />
However, one serious accident did occur in 2011,<br />
involving an explosion and subsequent fire at the<br />
pyrolysis gas separation and benzol production<br />
section of Stavrolen. As a result, nine employees<br />
and contractors received injuries of varying severity.<br />
Fire services attached to the Russian Ministry<br />
for Emergency Situations attended the incident and<br />
were assisted by other accident and rescue services.<br />
Scheduled preventative measures ensured that there<br />
were no incidents during 2011, which could be classed<br />
as emergencies. Safety drills and training sessions<br />
are held regularly at sea and river terminals, and at<br />
production, refining and storage sites, to ensure<br />
that the Company’s special teams and equipment<br />
remain in a high state of readiness to deal with any<br />
oil or petroleum product leakages. A total of 90 drills<br />
and training sessions were held in 2011 for dealing<br />
with emergency oil and product leakages.<br />
An international emergency training event, ‘Caspian<br />
2011’, was held during September 2011 in the<br />
Caspian Sea with participation by rescue services<br />
from Kazakhstan and Azerbaijan (observers from<br />
Turkmenistan also took part for the first time). Aircraft,<br />
special sea craft and coastal detachments were<br />
active in the manoeuvres. Levels of preparedness<br />
of the participants, coordination between<br />
the various rescue services (including those from<br />
other countries), and work by the rescue coordination<br />
center and by the emergency service section<br />
of LUKOIL-Nizhnevolzhskneft were highly commended<br />
by the Russian Ministry for Emergency Situations.<br />
Number of accidents<br />
Number of people injured in accidents<br />
96
Annual report 2011<br />
Personnel and Social Programs<br />
The Company’s success is completely dependent on<br />
the people who work for it. LUKOIL therefore does<br />
everything within its power to create and maintain<br />
a team of professionals who are capable of achieving<br />
all the ambitious tasks, which the Company sets itself.<br />
LUKOIL’s social policy is designed to help its employees<br />
to work efficiently and realize their potential<br />
in the confidence that they enjoy comprehensive<br />
social protection. We take issues of staff motivation<br />
very seriously and try to ensure that each employee<br />
takes a personal interest in achievement of the best<br />
possible results by the Company.<br />
LUKOIL aspires to a system of human resource<br />
management that matches the best global standards.<br />
During the reporting year Company experts<br />
carried out an analysis of how best-practice systems<br />
for management of resources, assets and business<br />
processes have been constructed at the world’s<br />
leading energy companies. Unified models have<br />
been designed for management of core business at<br />
the Group companies, eliminating inefficient links<br />
and duplication of management functions.<br />
Optimization of organizational structures at LUKOIL<br />
companies is being implemented in accordance<br />
with the new models and constructs, and this work<br />
is scheduled for completion by the end of 2012.<br />
The Company makes full use of social partnerships<br />
in the labour sphere, expanding cooperation<br />
with trade unions, government bodies and local<br />
communities. Since 2008 LUKOIL has been the official<br />
representative of the Russian Union of Industrialists<br />
and Entrepreneurs in the Tripartite Commission for<br />
Regulation of Social and Labour Relations, which is<br />
the most senior social partnership organization acting<br />
under the Labour Code of the Russian Federation.<br />
In 2011 the Company took part in 10 sessions of<br />
the Commission, at which 79 issues were considered.<br />
Approaches used for improving operational and<br />
financial efficiency within LUKOIL Group include<br />
reorganization of structural sub-divisions and transfer<br />
of non-core sub-divisions from the Group to<br />
external providers. As a result the overall number of<br />
employees at LUKOIL organizations decreased by<br />
7.5% in 2011 in comparison with 2010, maintaining<br />
the trend towards higher productivity and per-unit<br />
efficiency indicators at the Company: revenue per<br />
employee grew by 37.6% in the reporting year, and net<br />
profit rose by 24.3%.<br />
Much attention was paid in the reporting year<br />
to development of the system of staff appraisal.<br />
Appraisals of the work of more than 1,800 staff at<br />
the Company’s central office were carried out and<br />
the results were used to prepare personal development<br />
plans and in calculation of annual bonuses for<br />
2010. A pilot project was also carried out to assess<br />
candidates for LUKOIL’s executive reserve (to fill senior<br />
executive posts at the Company) in accordance with<br />
an approved model of corporate competences.<br />
LUKOIL fully understands the importance of a welldesigned<br />
system of salaries and remuneration<br />
for supporting motivation among its employees<br />
Hydrocarbon production per employee,<br />
thousand boe<br />
Refinery throughput at own refineries per<br />
employee, tonnes<br />
97
and ensuring their commitment to growth of the<br />
Company’s shareholder value. Wage levels in the<br />
industry are constantly monitored, which enables<br />
timely decisions on adjustment of wages in order<br />
to make them competitive and to encourage highly<br />
qualified specialists to seek employment at the<br />
Company. As a result Company payroll has expanded<br />
by 5% in the last five year despite a substantial<br />
reduction in employee numbers (by more than 20%).<br />
In addition to material incentives, LUKOIL provides<br />
encouragement to personnel through marks of<br />
merit for outstanding achievements at work. Special<br />
events were held at all Group companies in 2011<br />
at which workers and groups of workers received<br />
national awards, sectoral marks of distinction and<br />
LUKOIL awards. There were 38 winners of national<br />
awards among LUKOIL employees in 2011, while<br />
sectoral distinctions were earned by 754 workers<br />
and the Company’s own awards were conferred<br />
on 2,017 employees and 20 groups of employees.<br />
30 LUKOIL employees were awarded prizes by the<br />
Russian Union of Oil and Gas Workers in 2011.<br />
An efficient system of social guarantees helps to attract<br />
highly-qualified specialists to the Company,<br />
reduce employee turnover rates and strengthen<br />
corporate spirit, and is therefore of fundamental<br />
importance for LUKOIL operations. The Company<br />
offers a broad range of programs and opportunities<br />
to its employees as part of the LUKOIL social package.<br />
These include:<br />
• leisure and recreation provisions for employees<br />
and their families, organization of sport and fitness<br />
events<br />
• health care and medical treatment for Company<br />
employees, including voluntary health insurance<br />
• help to employees in acquiring housing<br />
• social support to women and families with children<br />
• social support to young specialists.<br />
• non-state pension provision for employees, which<br />
has operated since 2004 on the principle of shared<br />
funding of non-state pensions by employee and<br />
employer. By the end of 2011 more than 38,000<br />
employees of LUKOIL organizations in Russia had<br />
entered the shared funding system, and the sum<br />
of their contributions during the year was over<br />
$12.5 million. The Company’s total contributions<br />
under non-state pension provision programs in<br />
Russia and abroad for the reporting period were<br />
$37 million.<br />
Total spending by LUKOIL companies in 2011 for<br />
implementation of social programs for employees,<br />
their families and pensioners was $286 million, and<br />
spending on infrastructure for provision of social<br />
services totalled $83 million.<br />
LUKOIL gives priority to work with young specialists<br />
as part of the Group’s comprehensive target<br />
program for cooperation with young people and<br />
young specialists in the period from 2008 to 2017.<br />
Committees of young specialists operate at the<br />
Company enterprises, and their functions include<br />
support to young specialists in adjustment to new<br />
working conditions, obtaining and improving skills,<br />
and commitment to corporate values and corporate<br />
culture. The Company held a sixth competition<br />
in 2011 to find the Best Young Specialist of the Year,<br />
as a result of which the title was awarded to 68 of<br />
the Company’s young specialists. LUKOIL personnel<br />
also took an active part in the TEK-2010 annual<br />
competition to find the best R&D project by a young<br />
Sales per employee, $ thousand<br />
Net income per employee, $ thousand<br />
98
Annual report 2011<br />
engineer to address technical challenges in the fuel<br />
& energy industry: 27 employees of LUKOIL companies<br />
were prize winners in the competition.<br />
Further trainings were organized and held as part of<br />
the Young Specialist’s School in 2011. Such trainings<br />
are an integral part of the system for enhancing<br />
the knowledge and skills of new recruits to the<br />
Company, reducing the amount of time needed for<br />
their adaptation to the corporate environment and<br />
raising their professional efficiency.<br />
retraining and raising the qualifications of workers in<br />
offshore projects.<br />
Another group of 15 LUKOIL employees undertook an<br />
internship at ConocoPhillips in 2011.<br />
Employees by business segments in 2011, %<br />
The tradition of work experience opportunities<br />
at the Company for students of leading Russian higher<br />
education was continued (66 students benefited<br />
from a period of work experience at the Company<br />
in 2011). Work also continued on joint schemes with<br />
specialized oil & gas institutes around the country,<br />
including the ‘Step into the Future’ program for the<br />
selection of best students.<br />
The second Forum for young workers of LUKOIL<br />
Group companies was held in Western Siberia during<br />
the reporting year and was dedicated to the 20 th<br />
anniversary of the Group. A tele-bridge enabled<br />
young specialists from Timan-Pechora, Moscow, Perm,<br />
Nizhny Novgorod, Western Siberia, as well as regions<br />
of Southern and Eastern Europe to participate in the<br />
Forum.<br />
Our work with personnel is focused on skill levels.<br />
The Group has a system of continuous training, which<br />
is designed to ensure that LUKOIL personnel acquire<br />
the knowledge and skills, which they require in their<br />
jobs. LUKOIL uses the whole spectrum of modern training<br />
aids: workshops, seminars away from the work<br />
place, special training programs, work placements<br />
abroad, trainings, courses for improvement of<br />
qualifications, professional training days, distance<br />
learning, MBA programs, etc.<br />
The Corporate Study Centre which was opened<br />
in 2011 in the city of Astrakhan trains workers for<br />
operations on offshore oil and gas platforms and at<br />
river and sea terminals, as well as teaching employees<br />
how to deal with emergency situations and ensuring<br />
that they are familiar with industrial and fire<br />
safety drills. An agreement has also been signed with<br />
the Makarov State Maritime Academy for training,<br />
99
Sponsorship and Charity<br />
Social and charity programs are an integral part of<br />
the Company’s corporate strategy and help to ensure<br />
constructive partnership with the state, business<br />
and society. Corporate programs have a targeted<br />
character and are based on professional experience<br />
and human potential in regions where the Company<br />
operates. At the same time, the Company has come<br />
to understand the danger of creating social dependence<br />
through charity actions. Therefore, together<br />
with its traditional charity actions, LUKOIL makes<br />
increasing use of strategic support programs and<br />
social investments, which combine solutions to social<br />
problems with the strategic interests of the Company.<br />
This approach is based on joint work between<br />
business and the non-profit and government sectors<br />
to address urgent social and economic problems<br />
in local communities.<br />
Total spending by the Company on charity and social<br />
programs was about $99 million in 2011.<br />
Company policy in this field has two principal<br />
components:<br />
• social investments<br />
• sponsorship and traditional charity programs<br />
Social investment programs<br />
Support for children’s homes<br />
and schools<br />
Helping children is a Company priority, and underlies<br />
all of the social programs, which we have built<br />
and which we pursue: charitable programs,<br />
sponsorship, sports development programs for<br />
children and young people, and cultural programs.<br />
Social investments in human capital are particularly<br />
valuable in today’s environment and LUKOIL strives<br />
100
Annual report 2011<br />
to achieve a balanced approach, providing support<br />
both to children, who by virtue of their family<br />
circumstances or health find themselves in a worse<br />
situation than their peers, and to children with<br />
favourable family backgrounds by helping them to<br />
develop their natural abilities and talents.<br />
The Company, its subsidiaries and the LUKOIL Charity<br />
Fund provide help to children in 70 Russian children’s<br />
homes and boarding schools, ensuring that they<br />
remain in good health and obtain an education, which<br />
will enable them to acquire a profession and find their<br />
place in life.<br />
Every year the LUKOIL Charity Fund organizes<br />
summer vacations by the Black Sea for children<br />
from sponsored children’s homes in Kirov, Kstovo,<br />
Ishim, Nizhny Novgorod, Leningrad Region, Perm<br />
Territory, Astrakhan and Volgograd Regions, as well as<br />
organizing educational trips around Russia.<br />
The Charity Fund has also been providing special<br />
LUKOIL grants since 2006 to students who continue<br />
their studies in higher education or technical institutes<br />
after leaving children’s homes. Such grants were paid<br />
to 45 young people in 2011.<br />
Since 2008 the LUKOIL Charity Fund and the<br />
subsidiaries of the Company in Astrakhan Region<br />
have been working on a project, by which children<br />
from care homes and disadvantaged families<br />
are trained for work in managerial and technical<br />
capacities at LUKOIL. The project is motivated by<br />
a severe deficit of technical specialists, needed for a<br />
new large-scale project, which LUKOIL is implementing<br />
in the region. The young people from children’s<br />
homes and disadvantaged families have been given<br />
the opportunity to train at technical and highereducation<br />
colleges for a career with LUKOIL: 20 such<br />
students have already been placed at Astrakhan<br />
Polytechnic College and the Volga-Caspian Fishery<br />
and Industry Complex. The LUKOIL Charity Fund is<br />
covering costs of their tuition and living expenses,<br />
and they will be given employment at Group organizations<br />
in the region after completion of their studies.<br />
In Nizhny Novgorod Region the Company provides<br />
assistance to the Kstovo Oil Industry College, where<br />
students include children who were formerly at<br />
LUKOIL care homes. The students regularly visit<br />
LUKOIL’s Nizhny Novgorod Refinery to learn about<br />
its operations and to acquire practical knowledge<br />
and skills.<br />
In 2011 the LUKOIL Charity Fund and the Nizhny<br />
Novgorod Museum of Art joined forces to implement<br />
a successful art and education project under the<br />
title, ‘New talents discovered’, which was designed<br />
to help gifted young people of between 13 and 16<br />
years of age at children’s homes to make the best<br />
of their talents. The teenagers mastered basic skills<br />
in drawing, painting and composition, and were<br />
taught the fundamentals of fine art and the history<br />
of art. The climax of the project for its participants<br />
was a culminating exhibition of children’s drawing<br />
held at the Nizhny Novgorod Museum of Art in October<br />
2011 and attended by the President of LUKOIL,<br />
Vagit Alekperov, and the Governor of Nizhny Novgorod<br />
Region, Valery Shantsev. The best and most<br />
impressive of the children’s drawings were used<br />
to create the new corporate calendar of LUKOIL-<br />
Volganefteprodukt.<br />
The Group gives special attention to children with<br />
special medical needs. One project, which LUKOIL<br />
has maintained over a number of years, is called<br />
‘An illustrated book for every little blind child’ and<br />
is part of a larger program, ‘Illustrated Books for<br />
Blind Children’. In 2011 publications were supplied<br />
to specialized children’s institutions in Kazan as part<br />
of this project.<br />
Education programs<br />
Concern for the young generation and training<br />
of qualified, young specialists for the Russian oil<br />
industry are important aspects of LUKOIL’s activity.<br />
The Company provides support to a number<br />
of higher education institutes, which prepare<br />
specialists for a career in oil and gas, including the<br />
Gubkin Russian State Oil and Gas University, Perm<br />
National Research Polytechnic University, Ukhta<br />
State Technical University, Tyumen State Oil and<br />
Gas University, Ufa State Oil and Technical University,<br />
Volgograd State University, Volgograd State<br />
Technical University, Astrakhan State Technical<br />
101
University, the Mendeleyev Chemical Technologies<br />
Institute, and the Plekhanov Mining Institute in Saint<br />
Petersburg.<br />
As well as providing assistance to institutes with oil<br />
and gas specializations, the Company also supports<br />
the Higher School of Economics (National Research<br />
University), the Financial University (attached to<br />
the Russian Federal Government), the Volzhsky<br />
branch of the Moscow Energy Institute, Rostov<br />
State Railway University, Moscow State Social<br />
Humanitarian Institute, as well as secondary education<br />
institutions, including the Kstovo State Technical<br />
College, Budennovsk Regional Polytechnic<br />
College, Stavropol College of Geological Exploration,<br />
and Moscow School Gymnasium №45.<br />
Several oil and gas institutes in the CIS countries<br />
also benefit from Company support, including the<br />
State Oil Academy of Azerbaijan.<br />
Grant programs<br />
Since 2000 the Company has paid grants to particularly<br />
talented students at oil industry and technical<br />
institutes in Russia. In 2011 monthly corporate grants<br />
of 2,500 and 3,000 rubles were paid to about 200<br />
students in various Russian cities. Total grant payments<br />
in the period from 2007 to 2011 were nearly<br />
$700 thousand, of which more than $170,000 were<br />
paid in 2011.<br />
Teaching staff: the key to survival<br />
of scientific potential<br />
About 90 talented young teachers at leading Russian<br />
oil and gas institutes receive grants as part of<br />
LUKOIL’s program for support to young teachers. Total<br />
grant payments in the period from 2007 to 2011 were<br />
in excess of $1.2 million, including $250,000 in 2011.<br />
Provision of teaching resources<br />
Assistance to higher education institutes for improvement<br />
of their equipment and resource base is<br />
of crucial importance, ensuring that high standards<br />
of education are achieved. The Company helps oil<br />
and gas institutes in Russia to acquire scientific equipment<br />
for their laboratories. Substantial sums were<br />
allocated in 2008–2011 for new equipment and<br />
repairs to buildings at Tyumen State Oil and Gas<br />
University, Ukhta State Technical University, Ufa State<br />
Oil and Technical University, Perm State Technical<br />
University and the Gubkin State Oil and Gas University.<br />
Support for medical<br />
institutions<br />
LUKOIL provides assistance to a number of major<br />
specialized medical research centers: the Center<br />
for Haematology Research (part of the Russian<br />
Academy of Medical Science), the Russian<br />
Cardiovascular Scientific and Production Complex,<br />
and the A. V. Vishnevsky Institute of Surgery.<br />
The Company also supports development of the<br />
system of medical services in regions where it has<br />
operations. In 2008–2011 the Company helped to<br />
purchase expensive equipment for the Limanskaya<br />
Central District Hospital in Astrakhan Region,<br />
the Astrakhan Children’s Clinical Hospital №1,<br />
Bolshemurashkinskaya Central District Hospital in<br />
Nizhny Novgorod Region, Natal Clinic №4 in Moscow<br />
and the Kstovo Central District Hospital.<br />
Social project<br />
competitions<br />
Social project competitions, which are held annually<br />
by LUKOIL subsidiaries in association with the<br />
LUKOIL Charity Fund, offer a particularly efficient way<br />
of implementing programs of social importance.<br />
Holding of the competitions in regions of Company<br />
presence has become an integral part of LUKOIL’s<br />
system of corporate responsibility. Success of the<br />
social project competitions has proved that distribution<br />
of charity funds on a competitive basis is one<br />
of the most effective means of social investment.<br />
The system is founded on competitiveness,<br />
transparency and openness, and the intention<br />
is to support the projects and initiatives of local<br />
communities to solve the most pressing problems<br />
which their regions face, while at the same time<br />
maximizing the impact of charity assistance provided<br />
102
Annual report 2011<br />
by LUKOIL. In this respect the main task of social<br />
project competitions is to encourage more people<br />
to be socially active and to learn the necessary skills<br />
to solve their own problems and the problems of<br />
their community.<br />
or to serve Government priorities in the social sphere.<br />
For example, a ‘family-values’ nomination was added<br />
in 2008, which had been officially declared ‘Year<br />
of the Family’ by the Russian Government and,<br />
similarly, a special nomination was created in 2009,<br />
which was the ‘Year of Youth’ in Russia. Celebration<br />
of the 65 th anniversary of victory in World War II justified<br />
a nomination to support projects on the theme<br />
of that commemoration and in 2011 a special<br />
nomination dedicated to LUKOIL’s 20 th anniversary was<br />
added.<br />
LUKOIL’s social project competitions have proved<br />
their worth in recent years as a unique vehicle for<br />
nurturing social initiative. Independent experts agree<br />
that the competition mechanism enables funds<br />
to be allocated more efficiently. Most importantly,<br />
the system has a strong motivational element,<br />
encouraging ‘grassroots’ initiative by the people<br />
and organizations, who receive funding. The mechanism<br />
enables project participants to develop their<br />
potential, set themselves goals and organize their<br />
progress towards achievement of those goals, helped<br />
by the informational and financial resources provided<br />
by LUKOIL.<br />
Sponsorship and charity programs<br />
Social project competitions have been held in<br />
regions of LUKOIL presence since 2002, when the<br />
first competition was organized in Perm Territory.<br />
Geography of the events has greatly expanded in<br />
recent years: they are now held in 10 of Russia’s<br />
administrative regions.<br />
A total of $2.5 million were set aside by the Company<br />
for social project competitions in 2011, which is almost<br />
double the amount spent five years ago.<br />
The social project competitions have several<br />
nominations, which are the same in every region<br />
where they are held: ‘ecology’, ‘charity’, ‘culture<br />
and art’, ‘physical exercise, sport and tourism’ and<br />
‘Where I live’. But other nominations may be added<br />
to suit the specific needs of a particular territory,<br />
Preserving cultural<br />
and historical heritage<br />
Support for museums and the arts<br />
Supporting culture is a traditional sphere of sponsorship<br />
and charity for Russian companies. Partnership<br />
with cultural institutions involves sponsorship<br />
(financing of productions, concerts, exhibitions, etc.),<br />
but also has a pure charity element. The Company’s<br />
priority is to support classical art in all its varieties.<br />
LUKOIL provides support to a number of leading<br />
museums in Russia, including the Tretyakov<br />
Gallery, the Museums of the Moscow Kremlin, the<br />
Pushkin Museum of Fine Arts, the Russian Museum,<br />
and the V. M. and A. M. Vasnetsov Art Museum in the<br />
town of Vyatka.<br />
103
In 2011 LUKOIL was among partners of the Tretyakov<br />
Gallery exhibition, ‘What is Truth The 180 th Anniversary<br />
of the Birth of Nikolai Ge’.<br />
A touring exhibition, ‘The Kremlin from the Moscow<br />
Principality to the last Coronation’ was organized<br />
in 2011 in Kazan as part of the joint culture and<br />
education project with the Museums of the Moscow<br />
Kremlin, which began in 2004. Continuing the tradition<br />
of previous years, lecture-and-visit activities as well<br />
as a children’s drawing competition were provided<br />
by staff of the Museums for young people at children’s<br />
homes in Tatarstan. Similar touring exhibitions<br />
have already been held in Perm, Nizhny Novgorod<br />
and Volgograd in the years since the project began.<br />
The Company also supported the exhibition ‘Poiret,<br />
King of Fashion’, which was held at the Museums of<br />
the Moscow Kremlin in 2011.<br />
Funding was provided to the Pushkin Museum of<br />
Fine Arts for creation of a multimedia site devoted<br />
to the Museum’s collection of antiquities and for<br />
publication of the album, ‘Masterpieces of the<br />
Antiquities Collection at the Pushkin Museum of<br />
Fine Arts’.<br />
The Russian Museum received assistance for<br />
organization of an exhibition devoted to the 150 th<br />
anniversary of Konstantin Korovin.<br />
The V. M. and A. M. Vasnetsov Regional Museum of<br />
Fine Arts received support from LUKOIL for acquisition<br />
and installation of computer and multimedia<br />
equipment, as well as multimedia software to create<br />
а museum internet class for children and teenagers.<br />
LUKOIL has a long-running association with the<br />
Tchaikovsky Symphony Orchestra, conducted by<br />
Vladimir Fedoseyev. Concerts were organized in<br />
Brussels, Geneva, Zagreb, Nizhny Novgorod and<br />
Kstovo in 2011 as part of celebrations of LUKOIL’s 20 th<br />
anniversary.<br />
The Company has provided support over many years<br />
to the Perm State Theatre of Opera and Ballet, the<br />
Kaliningrad Regional Philharmonia (and its program,<br />
‘Bring the family to the concert hall’), as well as the<br />
Urals Academic Philharmonic Orchestra.<br />
LUKOIL is the official partner of the Spasskaya Bashnya<br />
festival of military bands, which is held annually<br />
on Red Square in Moscow.<br />
Other events supported by the Company in 2011<br />
included the ‘Great Caucasus’ festival of art from the<br />
Caucasus (held in Perm Territory), the 2 nd ‘Golden<br />
Harp’ international musical charity project, the<br />
‘Crescendo’ music festival, and the 2 nd M. Magomaev<br />
Vocalists Competition, as well as activities by the<br />
Russian Synod Choir. In Astrakhan the Company<br />
gave its support to a concert by the pianist Denis<br />
Matsuev, who was given an enthusiastic welcome<br />
by the local audience.<br />
Support for religious confessions<br />
Participation of the Company and its subsidiaries<br />
in the revival of Russia’s religious traditions<br />
and spiritual culture is an integral part of LUKOIL’s<br />
charity activity. LUKOIL is particularly keen to support<br />
those religious institutions, which are most<br />
active in the service of society.<br />
The Company supports the program for reconstruction<br />
and restoration of the Optyna Pustyn<br />
monastery, and has provided funds to help equip<br />
auditoria at the Cyril and Methodius Graduate<br />
104
Annual report 2011<br />
and Doctoral Centre, as well as for the Church of<br />
the Resurrection at Kadashy.<br />
Company subsidiaries also play an active part in the<br />
revival and development of centres of church and<br />
spiritual life in Russia and abroad.<br />
Program for revival of traditional<br />
arts and crafts<br />
LUKOIL-Perm has carried out a number of programs<br />
in recent years to support traditional crafts in the<br />
region around Perm in the northern Urals (the Kama<br />
river region).<br />
Perm Territory is now almost unique in Russia for the<br />
amount and the variety of traditional handicrafts,<br />
which are practised there and which have their roots<br />
in past centuries.<br />
The best examples of this work are displayed annually<br />
at an interregional exhibition-fair of traditional<br />
crafts and applied-decorative art under the general<br />
sponsorship of LUKOIL-PERM.<br />
The Govorlivskoye Gulbishe festival, which was<br />
held in 2011 using a social competition grant from<br />
LUKOIL-PERM gave a new impulse to the development<br />
of traditional handicrafts and revival of ethnic<br />
culture. The grant money was used to set up an<br />
experimental craft centre where young people are<br />
taught the skills of processing sylvinite, a natural<br />
material that is found in Perm Region. Funds provided<br />
to the winner of another social projects competition<br />
have been used to create a unique museum,<br />
the Tatar Hut, which has become a major attraction<br />
for visitors and tourists. Master classes are held at<br />
the museum, where people can learn how to make<br />
traditional items, and a unique collection of ancient<br />
embroidered cloths has been put on display.<br />
Organizational and financial assistance is also<br />
provided to a regional honey festival, the ‘Selenite<br />
Casket’ children’s festival of traditional handicrafts,<br />
as well as to the ‘Yelovskaya Rybka’ fishing<br />
and sport festival and the ‘Khlebny Spas’ harvest<br />
festival.<br />
Targeted assistance<br />
Help for war veterans, the disabled,<br />
and disadvantaged groups<br />
Oil workers and other veterans of the Great Patriotic<br />
War (World War II), as well as veterans of the labour<br />
front, have a special place in LUKOIL’s social programs.<br />
Every year they receive special payments and gifts<br />
from the Company to coincide with Victory Day.<br />
The Company also provides assistance to families<br />
of members of the armed forces, who have perished<br />
in more recent armed conflicts.<br />
LUKOIL provides financial assistance to people with<br />
disabilities, including support to help them to earn<br />
a living independently and thus to feel a part of society.<br />
Working with peoples of<br />
the Russian Far North<br />
Operations by LUKOIL in Siberia and the Far North<br />
of Russia can have significant impact on the living<br />
conditions of small indigenous peoples, creating<br />
various social and economic problems. Areas that are<br />
being developed for extraction of oil and gas are<br />
also areas where these peoples carry out economic<br />
activities (reindeer herding, fishing and hunting),<br />
that are essential to their survival. Resulting changes<br />
in the traditional way of life of these peoples can<br />
give rise to social and economic problems. LUKOIL’s<br />
objective is to resolve these issues by moving gradually<br />
away from charity provision to the indigenous<br />
inhabitants of these regions and towards an economic<br />
partnership with them.<br />
The Company develops and implements special<br />
programs for work with the owners of kinship lands.<br />
In Khanty-Mansiysk Autonomous District (Yugra)<br />
LUKOIL-Western Siberia makes agreements for social<br />
and economic development of districts and locations<br />
inhabited by small indigenous people in order<br />
to preserve and develop the traditional way of life<br />
of the Khanti, Mansi, Nenets and Selkup peoples.<br />
Issues in the relationship between the Company and<br />
indigenous peoples are resolved at meetings between<br />
LUKOIL managers and representatives of the<br />
105
Assembly of small indigenous peoples of the North,<br />
heads of administrative districts, and the local inhabitants<br />
themselves. LUKOIL works actively with<br />
the social organizations ‘Save Yugra’ and ‘Yamal for<br />
our Children’. In Yugra LUKOIL has industrial activities<br />
at 34 traditional resource areas, on which 164 families<br />
depend for their livelihood. The Company provides<br />
material assistance to each family in the form<br />
of petrol, construction materials, boats and boat<br />
engines, as well as snowmobiles. Financing is made<br />
available for construction and repairs to villages,<br />
and apartments are provided for local people in nearby<br />
towns.<br />
Members of the young generation of indigenous<br />
peoples also benefit from the Company’s attention.<br />
LUKOIL has begun work on the Kar Tokhi children’s<br />
camp for local ethnic groups, where children can<br />
learn the basics of hunting, reindeer herding and<br />
fishing, train in traditional handicrafts and learn how<br />
to handle a snowmobile.<br />
LUKOIL’s Western Siberian subsidiaries view preservation<br />
of the lifestyle, language and culture of indigenous<br />
peoples as an important goal. They therefore<br />
work with local administrations, helping to finance<br />
the construction of educational facilities, maintenance<br />
of places of worship, and holding of national festivals.<br />
The Company is also carrying out social and charity<br />
projects in the Nenets Autonomous District in order<br />
to improve the living standards of the indigenous<br />
Nenets and Komi peoples. An agreement between<br />
the Administration of Nenets Autonomous District<br />
and LUKOIL ensures that local people are in regular<br />
receipt of social assistance. In 2011 such assistance<br />
included support to seven groups of families and also<br />
to the Yasavey Association of the Nenets People.<br />
Since 2008 LUKOIIL-Komi together with the Administration<br />
of Nenets Autonomous District and the<br />
Yasavey non-government organization have been<br />
implementing the ‘Red Tent’ project, which provides<br />
health checks for the indigenous population and<br />
subsequent courses of treatment, when necessary, at<br />
the hospital in Naryan-Mar. There is particular need<br />
for dental services, so the medical team includes a<br />
mobile stomatology unit. Red Tent also provides<br />
training in first aid and use of mini-drugstores.<br />
Sport projects<br />
Support for Russian sport has been a key aspect of<br />
LUKOIL’s social policy over many years. The Company’s<br />
key priorities at the present time in the sphere of sport<br />
and fitness are:<br />
• encouraging health and fitness among Company<br />
employees and their families, developing mass<br />
sport<br />
• supporting professional sports teams in Russia,<br />
national sporting federations and the Russian<br />
Olympic movement<br />
• helping to develop children’s sport in Russia<br />
The health and fitness of Company employees is of<br />
much concern to LUKOIL, which therefore organizes<br />
competitions in various summer and winter sports in<br />
all regions of Russia where it has operations.<br />
The international ‘Spartakiada’ sports competitions<br />
organized by LUKOIL are of particularly importance<br />
for developing and achieving broad involvement<br />
in physical culture and sport.<br />
The 5 th Spartakiada, dedicated to the 20 th anniversary<br />
of the Company’s creation, was held in summer<br />
2011 in Perm, and included competitions in minifootball,<br />
volleyball, streetball, weight-lifting, armwrestling,<br />
track and field athletics, swimming,<br />
chess, tug-of-war, and table tennis. The home team<br />
from Perm won the competition for the 5 th consecutive<br />
year.<br />
LUKOIL provides support to a number of leading<br />
Russian sports teams to encourage the development<br />
of professional sport in Russia. Professional<br />
teams that benefit from Company sponsorship include<br />
Moscow Spartak football club, Caspian Dawn<br />
handball club in Astrakhan, Volgograd Spartak<br />
106
Annual report 2011<br />
water polo club, Moscow Dinamo hockey club,<br />
and Torpedo hockey club in Nizhny Novgorod. The<br />
Company is the official partner of the VTB League,<br />
which brings together the strongest basketball<br />
teams of Eastern Europe.<br />
For many years the Company has been the general<br />
sponsor of the national ski-racing team and partner<br />
of the Russian Ski-Racing Federation. LUKOIL assists<br />
both in training of the national team and development<br />
of amateur ski sport in Russia.<br />
As part of its support to the Russian Olympic Movement<br />
the Company is cooperating with the Russian<br />
Olympic Support Foundation, which provides<br />
targeted support to sportsmen in Russian national<br />
teams practising Olympic sports.<br />
In addition to its support for sports teams, LUKOIL<br />
also views sport as a way of testing the Company’s<br />
own products to the limits. The successes and victories<br />
of LUKOIL Racing Team, which is the strongest car<br />
racing team in Russia, continue to prove the efficiency<br />
of the Company’s fuels and lubricants at both<br />
circuit and rally competitions in prestigious Russian<br />
and international racing series. The Company’s<br />
involvement in racing goes beyond support to its<br />
own team: in 2011 LUKOIL became the official fuel<br />
supplier for the Silk Road rally, which is now the part<br />
of the world-famous Dakar rally series.<br />
LUKOIL also plays a major role in development<br />
of sport among children and young people.<br />
The Company has provided support since 2001 for<br />
one of the biggest children’s sport organizations<br />
in Russia, the Children’s Football League. About 3,000<br />
teams and more than 5,000 young football players<br />
from all parts of Russia take part in League competitions<br />
each year. Since 2002 the Children’s Football<br />
League has held an annual tournament under the<br />
title of the ‘LUKOIL International Children’s League<br />
of Champions’. Tournament matches in 2011 were<br />
dedicated to the 20 th anniversary of LUKOIL: qualifying<br />
rounds were held in seven cities in Russia<br />
and three foreign cities, with a final in Moscow and<br />
a super-final in the Turkish city of Alania.<br />
107
In 2011, as part of its 20 th anniversary celebrations,<br />
the Company organized competitions in football,<br />
skiing, artistic gymnastics, paintball, bowling, volleyball<br />
and handball for children, students and Company<br />
employees in Kaliningrad, Astrakhan, Volgograd,<br />
Rostov, Moscow, Tyumen, and Krasnodar<br />
regions. The competitions were also dedicated to<br />
people who have made major contributions to<br />
past develop-ment of the Russian oil industry:<br />
N. K. Baibakov, S. A. Povkh, V. Yu. Filanovsky-Zenikov,<br />
V. G. Schmidt, Yu.S. Korchagin and V. P. Sukharev.<br />
With the slogan ‘Win with us!’, these competitions<br />
were a logical continuation of sports actions by the<br />
Company in previous years: ‘Live with sport!’, ‘Believe<br />
in yourself!’ and the LUKOIL President’s Cup.<br />
LUKOIL museums<br />
LUKOIL’s network of corporate museums was created<br />
in 2005 and now consists of more than 20 museums<br />
at Group organizations in various regions<br />
of Russia, as well as in Ukraine, Bulgaria and Romania.<br />
More than 20 touring exhibitions were held in 2011<br />
including ‘LUKOIL’s Offshore Projects’, ‘140 years<br />
since the birth of I. M. Gubkin’, ‘Petroleum Products<br />
Business’, ‘Power Generation’, ‘Social Project Competitions’<br />
and ‘LUKOIL for Children’. The exhibitions were<br />
displayed at the Company’s central office and at<br />
other venues, including the Russian Ministry of<br />
Energy, the Russian Ministry of Natural Resources<br />
and Ecology, the State Maritime Academy, and the<br />
Crocus Expo international exhibition center.<br />
An exhibition dedicated to the Company’s 20 th<br />
anniversary was displayed at the Kremlin Palace,<br />
the Pillar Hall at the House of the Unions, and also in<br />
Switzerland, Belgium, Holland and Qatar.<br />
The LUKOIL Museum also played an important role<br />
in the organization of an exhibition in 2011 to mark<br />
the 100 th anniversary of the birth of the N. K. Baibakov,<br />
held at the Central Museum of the Modern History<br />
of Russia, as well as contributing to themed sections<br />
at the exhibitions ‘The Space Age’ and ‘P. A Stolypin.<br />
A Life for his Country’.<br />
108
Annual report 2011<br />
The Company Museum also provided assistance in<br />
the making of a film about I.M. Gubkin and re-issue<br />
of D. Ergin book, The Prize.<br />
The LUKOIL Museum holds regular sessions with<br />
students of the Gubkin Oil and Gas State University<br />
to study the history of the Russian oil industry.<br />
Blood donation actions<br />
LUKOIL holds voluntary blood donation actions for<br />
employees at the Company’s central office and also at<br />
subsidiaries in Perm Territory and Astrakhan Region.<br />
In 2011 a blood donation event at the central office,<br />
held to coincide with Blood Donor’s Day, collected<br />
about 160 liters of blood.<br />
The Company views blood donation as a valuable<br />
form of corporate voluntary action, which both helps<br />
society and helps to strengthen corporate culture<br />
by bringing members of staff together and forging<br />
links between them. Such events are also a way of<br />
developing a sense of corporate responsibility,<br />
which is something that the Company views as highly<br />
important.<br />
Such actions were first held in 2010 when 380 employees<br />
at the central office and a number of subsidiaries<br />
took part, collecting about 170 liters of blood.<br />
109
7<br />
Corporate Governance<br />
and Securities<br />
110
Annual report 2011<br />
Corporate Governance<br />
LUKOIL’s system of corporate governance is<br />
an effective tool for protecting the rights<br />
and interests of Company shareholders.<br />
Efficient corporate governance lowers<br />
the weighted average cost of capital<br />
and reduces investment risks, making<br />
investments in LUKOIL more attractive and,<br />
as a consequence, raising shareholder<br />
value of the Company. LUKOIL’s corporate<br />
governance system attaches special<br />
importance to protecting the rights<br />
of minority shareholders.<br />
High quality of the Company’s corporate governance<br />
system has been recognized by the investment<br />
community over many years.<br />
111
Board of Directors and Management<br />
Committee<br />
Board of Directors<br />
of LUKOIL<br />
The Board of Directors plays a crucial role in LUKOIL’s<br />
system of corporate governance, exercising overall<br />
control of Company activities in the interests of<br />
investors and shareholders. In accordance with Russian<br />
legislation and the LUKOIL Charter, the Board of<br />
Directors defines priorities for Company development<br />
and ensures efficient functioning of the Company’s<br />
executive bodies.<br />
The Board of Directors of LUKOIL has 11 members<br />
who are elected by a cumulative vote of the General<br />
Meeting of Shareholders. Shareholders who own no<br />
less than 2% of voting shares in the Company have<br />
the right to propose candidates to the Board. Such<br />
proposals must be submitted to the Company not<br />
later than 30 days after the end of the financial year.<br />
The Board of Directors takes a decision on the final list<br />
of candidates during the last five days after the end<br />
of that period, usually by a vote in absentia. Members<br />
of the Board of Directors are elected until the next<br />
General Meeting of Shareholders and there is no limit<br />
on the number of times they can be re-elected.<br />
In accordance with the Code of Corporate Conduct,<br />
which was recommended for adoption by companies<br />
by the Decree of the Federal Commission for the<br />
Securities Market on April 4, 2002, the Board of<br />
Directors of LUKOIL includes independent directors,<br />
whose presence enables the Board to formulate an<br />
objective opinion on matters discussed and therefore<br />
to strengthen confidence in the Company on the part<br />
of investors and shareholders. At the present time<br />
7 of the 11 members of the Board of Directors are<br />
independent.<br />
The Board of Directors held 8 meetings in person<br />
during 2011 and carried out 16 votes in absentia. The<br />
Board of Directors dealt with the following matters<br />
within its competence during 2011:<br />
• definition of Company business priorities,<br />
strategic, medium-term and annual planning,<br />
and review of business results<br />
112
Annual report 2011<br />
• in-depth study and design of specific measures<br />
for development of Group business segments;<br />
• improvement of corporate governance<br />
taken into account. So a Board member who submits<br />
his written opinion before the start of the meeting is<br />
considered to have taken part in the meeting.<br />
• formation of the Management Committee,<br />
guidelines for selection of the external<br />
auditor<br />
• preparations for holding the General Meeting<br />
of Shareholders<br />
• approval of transactions with interest<br />
Participation by members of the Board<br />
of Directors at in-person meetings of<br />
the Board of Directors in 2011*<br />
Meetings<br />
Vagit Alekperov 8/8<br />
Igor Belikov (until June 23, 2011) 3/3<br />
Viktor Blazheev 8/8<br />
Valery Grayfer 7/8<br />
Herman Gref 7/8<br />
Igor Ivanov 8/8<br />
Ravil Maganov 8/8<br />
Richard Matzke (from June 23, 2011) 5/5<br />
Sergei Mikhailov 8/8<br />
Mark Mobius 8/8<br />
Guglielmo Moskato (from June 23, 2011) 5/5<br />
Alexander Shokhin 8/8<br />
Donald Wallette Jr (until June 23, 2011) 3/3<br />
* In accordance with the resolution of the Board<br />
of Directors, for purposes of defining a quorum<br />
in conduct of a BoD meeting and voting results,<br />
the written opinion of an absent Board member<br />
concerning the agenda items, which is received by<br />
the Board Secretary before the start of the meeting, is<br />
113
Members of the Board<br />
of Directors of LUKOIL<br />
Valery Grayfer<br />
Chairman of the LUKOIL Board of Directors<br />
Chairman of the RITEK Board of Directors<br />
Born 1929<br />
Graduated in 1952 from the Gubkin Moscow Oil Institute. Doctoral Candidate<br />
in Technical Sciences. Awarded six orders, four medals, and a Diploma of the<br />
Supreme Soviet of the Tatar ASSR. Awarded a Diploma of the President of the<br />
Russian Federation in 2009. Deputy to the USSR Oil Industry Minister, Head of<br />
the Tyumen Main Office for the Oil and Gas Industry (from 1985). CEO of RITEK<br />
(1992–January 1, 2010); Chairman of the Board of Directors of RITEK (from 2010).<br />
Chairman of the Board of Directors of LUKOIL (from 2000). Professor of the<br />
Gubkin Russian State Oil and Gas University, Lenin Prize Winner and Russian<br />
Government Prize Winner.<br />
Elected to the LUKOIL Board of Directors since 1996.<br />
Vagit Alekperov<br />
President of LUKOIL<br />
Member of the LUKOIL Board of Directors<br />
Chairman of the LUKOIL Management Committee<br />
Born 1950<br />
Graduated in 1974 from the Azizbekov Institute of Oil and Chemistry in<br />
Azerbaijan. Doctor of Economics, current Member of the Russian Academy<br />
of Natural Sciences. Awarded four orders, eight medals, a Diploma and Letter<br />
of Acknowledgement from the President of the Russian Federation. Winner<br />
of two Russian Government Prizes. Worked in the oil industry in Azerbaijan<br />
and Western Siberia (from 1968). CEO of Kogalymneftegaz (oil production<br />
company), a division of Glavtyumenneftegaz within the Ministry of the Oil<br />
and Gas Industry of the USSR (1987-1990). Deputy, then First Deputy<br />
to the USSR Oil and Gas Industry Minister (1990-1991). President<br />
of Langepasuraykogalymneft (oil production group) (1992-1993). Chairman<br />
of the Board of Directors of LUKOIL (1993–2000). President of LUKOIL (from<br />
1993).<br />
Elected to the LUKOIL Board of Directors since 1993.<br />
114
Annual report 2011<br />
Igor Belikov<br />
Independent Member of the Board of Directors of LUKOIL 1 (until 23.06.2011)<br />
Director of the Russian Institute of Directors (since 2002)<br />
Member of the HR and Remuneration Committee of the LUKOIL Board of<br />
Directors (until 23.06.2011)<br />
Born 1956<br />
Graduated in 1980 from Voronezh State University, post-graduate studies at<br />
the Africa Institute of the Academy of Sciences of the USSR, Doctoral Candidate<br />
in Historical Science, completed a period of study at London University,<br />
Diploma in Banking and Insurance awarded by the Further Qualification<br />
Institute of the Financial Academy (attached to the Government of<br />
the Russian Federation), Audit Certificate and Corporate Governance<br />
Certificate from Schulich School of Business (York University, Toronto,<br />
Canada, 2002), Corporate Governance Consulting Certificate (Global<br />
Corporate Governance Forum, Washington, USA, 2008). Director of the<br />
Russian Institute of Directors (from 2002). Co-author of the Russian Code<br />
of Corporate Conduct (2002) and of the first National Report on Corporate<br />
Governance (2004). Member of the Expert Council of the Federal Commission<br />
for the Securities Market (FCSM) (2002–2004). Executive Secretary<br />
of the National Council for Corporate Governance (2003–2004). Member<br />
of the Expert Council for Corporate Governance at the Federal Service for<br />
Financial Markets, Deputy Chairman of the College of the Association<br />
of Corporate Directors, member of the International Corporate Governance<br />
Network (ICGN) (from 2004). Expert on the Intergovernmental Group<br />
of Experts on International Accounting Standards of the UN Conference<br />
on Trade and Development (UNCTAD, Geneva) (2003–2006).<br />
Elected to the Board of Directors of LUKOIL from 2008 to 2009 and from 2010<br />
to June 2011.<br />
Viktor Blazheev<br />
Independent Member of the LUKOIL Board of Directors 1<br />
Rector of the Kutafin Moscow State Academy of Law<br />
Member of the LUKOIL BoD Audit Committee<br />
Born 1961<br />
Graduated from the All-Union Correspondence-Study Law Institute (ACLI)<br />
in 1987; completed a post-graduate program at ACLI/Moscow Law Institute<br />
(Civil Litigation Faculty) in 1990. Since 1994 he has combined work as a lecturer<br />
with various administrative posts at the Moscow State Academy of Law. Dean<br />
of the Full-time Department of the Moscow State Academy of Law (1999–2001).<br />
Vice-Rector of Moscow State Academy of Law in charge of academic agenda<br />
(2001–2002). First Vice-Rector of Moscow State Academy of Law in charge<br />
of academic agenda (2002–2007). Rector of Kutafin Moscow State Academy<br />
of Law (from 2007).<br />
Elected to the LUKOIL Board of Directors since 2009.<br />
1<br />
In accordance with the provisions of the Code of Corporate Conduct, which was recommended for application by the<br />
Decree of the Russian Federal Commission for the Securities Market, dated April 4, 2002. The same applies to all other<br />
independent BoD members listed in this section<br />
115
Herman Gref<br />
Independent Member of the LUKOIL Board of Directors 1<br />
President, Chairman of the Executive Board of SBERBANK<br />
(Savings Bank of the Russian Federation)<br />
Chairman of the LUKOIL BoD Audit Committee<br />
Born 1964<br />
Graduated from Omsk State University in 1990, completed a post-graduate<br />
program at St. Petersburg State University in 1993. First Deputy Minister of<br />
Property Relations of the Russian Federation (1998–2000). Minister of Economic<br />
Development and Trade of the Russian Federation (2000–2007). President,<br />
Chairman of the Executive Board of SBERBANK (Savings Bank of the Russian<br />
Federation) (from 2007). Doctoral Candidate in Economic Science.<br />
Elected to the LUKOIL Board of Directors since 2009.<br />
Igor Ivanov<br />
Independent Member of the LUKOIL Board of Directors 1<br />
President of the Russian Council for International Relations<br />
Chairman of the LUKOIL BoD Strategy and Investment Committee<br />
Born 1945<br />
Graduated from the Maurice Thorez Moscow State Institute of Foreign<br />
Languages in 1969. Corresponding Member of the Russian Academy of Sciences.<br />
Doctor of Historical Science, Professor. Awarded Russian and foreign<br />
orders and medals. First Deputy Minister of Foreign Affairs of the Russian<br />
Federation (1993–1998). Minister of Foreign Affairs of the Russian Federation<br />
(1998–2004). Secretary of the Security Council of the Russian Federation<br />
(2004–2007). Professor of the Moscow State Institute of International Affairs<br />
(University), attached to the Russian Ministry of Foreign Affairs.<br />
Elected to the LUKOIL Board of Directors since 2009.<br />
1<br />
In accordance with the provisions of the Code of Corporate Conduct, which was recommended for application by the<br />
Decree of the Russian Federal Commission for the Securities Market, dated April 4, 2002. The same applies to all other<br />
independent BoD members listed in this section<br />
116
Annual report 2011<br />
Ravil Maganov<br />
Member of the LUKOIL Board of Directors<br />
Member of the LUKOIL Management Committee<br />
First Executive Vice-President of LUKOIL (Exploration & Production)<br />
Member of the LUKOIL BoD Strategy and Investment Committee<br />
Born 1954<br />
Graduated in 1977 from Moscow Gubkin Petrochemical & Gas Institute. Honored<br />
Employee of the Oil and Gas Industry of the Russian Federation. Awarded<br />
three orders and three medals. Winner of three Russian Government Prizes<br />
in science and technology. Chief Engineer, Deputy CEO, CEO of Langepasneftegaz<br />
(oil production company) (1988-1993). Vice-President of LUKOIL<br />
(1993-1994). First Vice-President of LUKOIL (1994–2006). First Executive Vice-<br />
President of LUKOIL (from 2006).<br />
Elected to the LUKOIL Board of Directors since 1993.<br />
Richard Matzke<br />
Independent Member of the LUKOIL Board of Directors 1<br />
Member of the LUKOIL BoD Strategy and Investment Committee<br />
Born 1937<br />
Graduated from Iowa State University (1959), Pennsylvania State University<br />
(1961), and St. Mary's College in California (1977). Masters in Geology,<br />
MBA. President of Chevron Overseas Petroleum and Member of the Board<br />
of Directors of Chevron Corporation (1989-1999). Vice-Chairman of Chevron<br />
and Chevron-Texaco Corporation (2000–2002). Awarded a non-Government<br />
(sectoral) medal ‘For Development of the Russian Oil and Gas Industry’<br />
in 2006; winner of the national prize ‘Director of the Year, 2006’ (Russia)<br />
in the ‘Independent Directors’ nomination, organized by the Association<br />
of Independent Directors and PricewaterhouseCoopers. Member of the<br />
Board of Directors of Eurasia Drilling Company (from 2010)<br />
Elected to the LUKOIL Board of Directors in 2002–2010 and from June 2011.<br />
1<br />
In accordance with the provisions of the Code of Corporate Conduct, which was recommended for application by the<br />
Decree of the Russian Federal Commission for the Securities Market, dated April 4, 2002. The same applies to all other<br />
independent BoD members listed in this section<br />
117
Sergei Mikhailov<br />
Member of the LUKOIL Board of Directors<br />
CEO of CJSC Consulting Group<br />
Member of the LUKOIL BoD Audit Committee<br />
Member of the LUKOIL BoD HR and Remuneration Committee<br />
Born 1957<br />
Graduated in 1979 from Dzerzhinsky Military Academy, in 1981 from Moscow<br />
Aviation Institute (Further Qualification Faculty), and in 1998 from the<br />
Plekhanov Russian Economics Academy. Doctoral Candidate in Technical<br />
Sciences, Doctor of Economics, Professor. Awarded four medals. Service in the<br />
armed forces (1974-1992). Head of Section, Deputy Chairman of the Russian<br />
Federal Property Fund (1992-1996). Head of the Restructuring and Investment<br />
Department of the Ministry of Industry (1996-1997). CEO of Management-<br />
Center (management company) (1997–2003). CEO of Management-Consulting<br />
(from 2001). Chairman of the Board of Directors of Capital Unit Investment<br />
Funds (Management Company), Member of the Board of Russian Mediagroup,<br />
Spartak-Moscow Football Club, and Petrocommerce Commercial Bank<br />
(from 2004). Member of the Board of Directors of IFD Capital (from 2005).<br />
Chairman of the Board of Directors of Capital Investment Group (2008–2009).<br />
Member of the Board of Directors of Capital Management Company, Chairman<br />
of the Board of Directors of Capital Asset Management (from 2008).<br />
Chairman of the Board of Directors of Capital Group Asset Management (from<br />
2010). Deputy CEO of Capital Management Company (from 2011).<br />
Elected to the LUKOIL Board of Directors since 2003.<br />
Mark Mobius<br />
Independent Member of the Board of Directors of LUKOIL 1<br />
Executive President of Templeton Emerging Markets Group<br />
Member of the Strategy and Investment Committee of the Board of Directors<br />
Born 1936<br />
Graduated from the Massachusetts Institute of Technology (USA) in 1964.<br />
Doctor of Economic and Political Science. BA and Masters Degree from Boston<br />
University (USA). Executive President of Templeton Asset Management Ltd<br />
(until August 2010). Executive President of Templeton Emerging Markets<br />
Group (since August 2010). Works at Franklin Templeton Investments since 1987.<br />
Elected to the Board of Directors of LUKOIL in 2002–2004 and since June 2010 .<br />
1<br />
In accordance with the provisions of the Code of Corporate Conduct, which was recommended for application by the<br />
Decree of the Russian Federal Commission for the Securities Market, dated April 4, 2002. The same applies to all other<br />
independent BoD members listed in this section<br />
118
Annual report 2011<br />
Guglielmo Antonio Claudio Moscato<br />
Independent Member of the Board of Directors of LUKOIL<br />
Chairman of the Board and CEO of GasMediterrraneo & Petrolio<br />
Member of the LUKOIL BoD Strategy and Investment Committee<br />
Member of the LUKOIL BoD HR and Remuneration Committee<br />
Born 1936<br />
Graduated in 1961 from Milan Polytechnical University. Previously held<br />
positions as BoD Chairman of ENI SpA, BoD Chairman and CEO of AGIP SpA<br />
(also BoD Chairman of the Enrico Mattei Foundation (Eni) and Chairman of<br />
the Eni Corporate University). Currently holds the position of BoD Chairman<br />
and CEO of GasMediterrraneo & Petrolio.<br />
Elected to the Board of Directors of LUKOIL since 2011.<br />
Alexander Shokhin<br />
Independent Member of the LUKOIL Board of Directors 1<br />
President of the Russian Union of Industrialists and Entrepreneurs<br />
President of the National Research University – Higher School of Economics.<br />
Head of the Faculty for Theory and Practice of Interaction between Business<br />
and Government.<br />
Chairman of the LUKOIL BoD HR and Remuneration Committee<br />
Born 1951<br />
Graduated from the Economics Faculty of Lomonosov Moscow State University<br />
in 1974, Doctor of Economics, Professor. Awarded an order for ‘Services<br />
to Russia’ (3 rd and 4 th grade) and a medal of the Russian Security Council<br />
for ‘Services to National Security’. Began working career in 1969. Deputy<br />
Chairman of the Government of the Russian Federation, Minister of the Economy,<br />
Minister for Labour and Employment (1991–1994). Deputy in three elected<br />
State Dumas of the Russian Federation (1994–2002). First Deputy Chairman<br />
of the State Duma of the Russian Federation (1996-1997). Chairman of Duma<br />
Fraction ‘Our Home is Russia’ (1997–1998). Deputy Chairman of the Russian<br />
Government in 1998. Chairman of the Supervisory Council of Renaissance<br />
Capital Investment Group (2002–2006). Member of the Public Chamber<br />
of the Russian Federation (2005–2009). President of the Russian Union of<br />
Industrialists and Entrepreneurs (from 2005).<br />
Member of the Russian Presidential Commission for Formation and Preparation<br />
of the Executive Managers’ Reserve, of the Competitiveness and<br />
Enterprise Council of the Prime Minister of Russia, and of Government<br />
Commissions for Administrative Reform, for Drafting of Legislation, for High-<br />
Technology and Innovation, for Transport and Communications, and for<br />
Development of Small and Medium-sized Business.<br />
Elected to the LUKOIL Board of Directors since 2005.<br />
1<br />
In accordance with the provisions of the Code of Corporate Conduct, which was recommended for application by the<br />
Decree of the Russian Federal Commission for the Securities Market, dated April 4, 2002. The same applies to all other<br />
independent BoD members listed in this section<br />
119
Donald Wallette Jr<br />
Independent Member of the LUKOIL Board of Directors (until 23.06.2011) 1<br />
President of the Asia-Pacific Regional Division of ConocoPhillips<br />
Member of the LUKOIL BoD Strategy and Investment Committee<br />
(until 23.06.2011)<br />
Born 1958<br />
Graduated from the University of Southern California with a Degree in<br />
Chemical Engineering in 1981. ConocoPhillips Manager for Production Support<br />
and Optimization (2002–2005). Vice-President for the Shtokman Project in the<br />
Russia/Caspian Region Division of ConocoPhillips (2005–2006). Russia/Caspian<br />
Region President of ConocoPhillips (December 2006 to August 2010). President<br />
of the Asia-Pacific Regional Division of ConocoPhillips (from September 2010).<br />
Elected to the LUKOIL Board of Directors from 2007 to June 2011.<br />
1<br />
In accordance with the provisions of the Code of Corporate Conduct, which was recommended for application by the<br />
Decree of the Russian Federal Commission for the Securities Market, dated April 4, 2002. The same applies to all other<br />
independent BoD members listed in this section<br />
120
Annual report 2011<br />
Committees of the Board<br />
of Directors<br />
Committees of the Board of Directors<br />
have been created to ensure efficient functioning<br />
of the Board of Directors,<br />
as follows: for Strategy and Investments;<br />
for Audit; and for HR and Remuneration.<br />
The committees carry out preliminary<br />
examination of matters of importance<br />
and prepare recommendations to the<br />
Board of Directors.<br />
Strategy and Investment<br />
Committee<br />
The Committee for Strategy and Investments<br />
prepares recommendations to the Board of Directors<br />
concerning strategy objectives for long-term<br />
Company development. The principal function of the<br />
Committee is to prepare recommendations on the following<br />
issues:<br />
• analysis of strategic development concepts,<br />
programs and plans of the Company<br />
• the amount of dividends to be paid on shares<br />
and the procedure for dividend payment<br />
• distribution of Company profit and loss for<br />
the financial year<br />
Members of the Strategy and Investments Committee<br />
are elected from among BoD members and are at<br />
least three in number. At least one member of the<br />
Committee must be independent, assuming that at<br />
least one independent member has been elected<br />
to the Board. Committee members are elected at a<br />
meeting of the newly elected Board of Directors for<br />
the period until election of the next Board of Directors<br />
by the General Meeting of Shareholders.<br />
The Committee consists of Igor Ivanov (Chairman),<br />
Ravil Maganov, Mark Mobius, Richard Matzke and<br />
Guglielmo Moscato.<br />
Audit Committee<br />
The Audit Committee analyzes the results of audit<br />
of the financial accounts of LUKOIL, carried out by<br />
external auditors, and prepares recommendations<br />
to the BoD for decisions on the following issues:<br />
• selection of the candidate for external auditor<br />
of the Company<br />
• assessment of the auditor’s opinion<br />
• assessment of the level of objectivity and<br />
independence of the Company auditor<br />
121
Members of the Audit Committee are elected from<br />
among non-executive members of the Board of<br />
Directors of the Company and are at least three in<br />
number. At least one member of the Committee<br />
must be independent, assuming that at least one<br />
independent member has been elected to the<br />
Board. Committee members are elected at a meeting<br />
of the newly elected Board of Directors for the period<br />
until election of the next Board of Directors by the<br />
General Meeting of Shareholders.<br />
The Committee consists of Herman Gref (Chairman),<br />
Sergei Mikhailov and Viktor Blazheev.<br />
Members of the HR and Remuneration Committee<br />
are elected from among non-executive members<br />
of the Board of Directors of the Company and are at<br />
least three in number. At least one member of the<br />
Committee must be independent, assuming that at<br />
least one independent member has been elected<br />
to the Board. Committee members are elected at<br />
a meeting of the newly elected Board of Directors<br />
for the period until election of the next Board of<br />
Directors by the General Meeting of Shareholders.<br />
The Committee consists of Alexander Shokhin (Chairman),<br />
Guglielmo Moscato and Sergei Mikhailov.<br />
HR and Remuneration<br />
Committee<br />
The HR and Remuneration Committee has responsibility<br />
for the following issues:<br />
• defining criteria for choice of candidates to<br />
the Board of Directors, Management Committee<br />
and the post of Company President<br />
• preliminary assessment of candidates to<br />
the Management Committee and post<br />
of Company President<br />
• preparing recommendations to the Board<br />
of Directors for decisions on HR issues<br />
and issues of remuneration to members<br />
of Company management bodies and<br />
of the Audit Commission<br />
122
Annual report 2011<br />
Management Committee of LUKOIL<br />
Vagit Alekperov<br />
President of LUKOIL<br />
Member of the LUKOIL Board of Directors<br />
Chairman of the LUKOIL Management Committee<br />
Born 1950<br />
Graduated in 1974 from the Azizbekov Institute of Oil and Chemistry in<br />
Azerbaijan. Doctor of Economics, current Member of the Russian Academy<br />
of Natural Sciences. Awarded four orders, eight medals, a Diploma and<br />
Letter of Acknowledgement from the President of the Russian Federation.<br />
Winner of two Russian Government Prizes. Worked in the oil industry in<br />
Azerbaijan and Western Siberia (from 1968). CEO of Kogalymneftegaz<br />
(oil production company), a division of Glavtyumenneftegaz within the<br />
Ministry of the Oil and Gas Industry of the USSR (1987–1990). Deputy,<br />
then First Deputy to the USSR Oil and Gas Industry Minister (1990–1991).<br />
President of Langepasuraykogalymneft (oil production group) (1992–<br />
1993). Chairman of the Board of Directors of LUKOIL (1993–2000). President<br />
of LUKOIL (from 1993).<br />
Anatoly Barkov<br />
Member of the LUKOIL Management Committee<br />
Vice-President, Head of the Main Division of General Affairs, Corporate<br />
Security and Communications of LUKOIL<br />
Born 1948<br />
Graduated in 1992 from Ufa Oil Institute. Doctoral Candidate in Economic<br />
Science. Honored Employee of the Oil and Gas Industry of the Russian<br />
Federation. Awarded an order and 10 medals. Head of Operations, Head of<br />
Oil and Gas Production, Senior Engineer at Kogalymneftegaz (1987–1992).<br />
Executive Director, then Director of the Department of Foreign Projects<br />
at Langepasuraykogalymneft (1992–1993). Vice-President, Head of the<br />
Main Division of General Affairs, Corporate Security and Communications<br />
of LUKOIL (1993 – January 2012). Vice-President for General Affairs, Corporate<br />
Security and Communications of LUKOIL (from February 2012).<br />
123
Gennady Fedotov<br />
Member of the LUKOIL Management Committee<br />
Vice-President for Economics and Planning of LUKOIL<br />
Born 1970<br />
Graduated from the Moscow Physics and Technology Institute in 1993.<br />
Awarded a medal of the order ‘For Services to Russia’ (2 nd grade). Worked<br />
at the companies Halliburton and Shell (1994–2002). Head of Section,<br />
Deputy Head, Head of the Main Division for Corporate Budget and Economic<br />
Planning of LUKOIL (2002–2007). Vice-President, Head of the Main<br />
Division for Economics and Planning of LUKOIL (2007 – January 2012). Vice-<br />
President for Economics and Planning of LUKOIL (from February 2012).<br />
Leonid Fedun<br />
Member of the LUKOIL Management Committee<br />
Vice-President for Strategic Development of LUKOIL<br />
Born 1956<br />
Graduated in 1977 from Rostov Nedelin Higher Military School. Doctoral<br />
Candidate in Philosophy. Awarded an order and seven medals. CEO of<br />
LUKoil Consulting (1993-1994). Vice-President and Head of the Main<br />
Division of Strategic Development and Investment Analysis of LUKOIL<br />
(1994 – January 2012). Vice-President for Strategic Development of LUKOIL<br />
(from February 2012).<br />
124
Annual report 2011<br />
Evgeny Khavkin<br />
Member of the LUKOIL Management Committee<br />
Vice-President, Head of the BoD Office of LUKOIL<br />
Born 1964<br />
Graduated in 2003 from Moscow Institute of Economy, Management<br />
and Law. Awarded two medals. Worked in oil companies in Western Siberia<br />
(from 1988). Deputy Head, then First Deputy Head of the BoD Office of<br />
LUKOIL (1997–2003). BoD Secretary, Head of the BoD Office of LUKOIL<br />
(2003 – January 2012). Vice-President, Head of the BoD Office of LUKOIL<br />
(from February 2012).<br />
Lyubov Khoba<br />
Member of the LUKOIL Management Committee<br />
Vice-President, Chief Accountant of LUKOIL<br />
Born 1957<br />
Graduated in 1992 from Sverdlovsk Institute of National Economy. Doctoral<br />
Candidate in Economic Science. Honored Economist of the Russian<br />
Federation. Awarded two medals and an order. Chief Accountant at<br />
Kogalymneftegaz (1991-1993). Chief Accountant at LUKOIL (1993–2000).<br />
Vice-President of LUKOIL, Head of Financial Accounting (2000–2003). Chief<br />
Accountant and Vice-President of LUKOIL (2003–2004). Chief Accountant<br />
of LUKOIL (2004 – January 2012). Vice-President, Chief Accountant of<br />
LUKOIL (from February 2012).<br />
125
Sergei Kukura<br />
Member of the LUKOIL Management Committee<br />
First Vice-President of LUKOIL (Economics and Finance)<br />
Born 1953<br />
Graduated in 1979 from the Ivano-Frankovsk Institute of Oil and Gas. Doctor<br />
of Economics. Honored Economist of the Russian Federation. Awarded<br />
an order and five medals, and Letter of Acknowledgement from the President<br />
of the Russian Federation. Winner of a Russian Government Prize<br />
for Science and Technology. Vice-President of Langepasuraykogalymneft<br />
(1992–1993). First Vice-President of LUKOIL (from 1993).<br />
Ravil Maganov<br />
Member of the LUKOIL Board of Directors<br />
Member of the LUKOIL Management Committee<br />
First Executive Vice-President of LUKOIL (Exploration & Production)<br />
Member of the LUKOIL BoD Strategy and Investment Committee<br />
Born 1954<br />
Graduated in 1977 from Moscow Gubkin Petrochemical & Gas Institute.<br />
Honored Employee of the Oil and Gas Industry of the Russian Federation.<br />
Awarded three orders and three medals. Winner of three Russian Government<br />
Prizes in science and technology. Chief Engineer, Deputy CEO, CEO<br />
of Langepasneftegaz (oil production company) (1988–1993). Vice-President<br />
of LUKOIL (1993–1994). First Vice-President of LUKOIL (1994–2006). First<br />
Executive Vice-President of LUKOIL (from 2006).<br />
126
Annual report 2011<br />
Sergei Malyukov<br />
Member of the LUKOIL Management Committee<br />
Vice-president for Internal Control and Audit of LUKOIL<br />
Born 1954<br />
Graduated in 1977 from Dzerzhinsky Military Academy and in 1997 from<br />
the Higher School of Economics. Doctoral Candidate in Philosophy. Awarded<br />
five medals. Service in the armed forces (1972–1995). Head of Section, Head<br />
of Division, Head of Department of the Main Division for Strategic<br />
Development and Investment Analysis of LUKOIL (1995–2010). Head<br />
of the Main Division for Control, Internal Audit and Risk Management<br />
(2010 – January 2012). Vice-President for Internal Control and Audit of<br />
LUKOIL (from February 2012).<br />
Ivan Masliaev<br />
Member of the LUKOIL Management Committee<br />
Vice-President, General Counsel of LUKOIL<br />
Born 1958<br />
Graduated in 1980 from Lomonosov Moscow State University. Doctoral<br />
Candidate in Law. Honored Lawyer of the Russian Federation. Awarded<br />
three medals. Head of the Legal Department of Langepasuraykogalymneft<br />
(1992–1993). Head of the Legal Department at LUKOIL (1994-1999).<br />
Head of the Main Division for Legal Support at LUKOIL (2000 – January 2012).<br />
Vice-President, General Counsel of LUKOIL (from February 2012).<br />
127
Alexander Matytsyn<br />
Member of the LUKOIL Management Committee<br />
Vice-President for Finance of LUKOIL<br />
Born 1961<br />
Graduated in 1984 from Lomonosov Moscow State University. Doctoral<br />
Candidate in Economics. Honored Economist of the Russian Federation.<br />
MBA from Bristol University (1997). Awarded a medal, ‘For services to<br />
Russia’ (2 nd grade). Director and CEO of international auditing firm KPMG<br />
(1994–1997). Vice-President, Head of the Main Division of Treasury and<br />
Corporate Finance of LUKOIL (1997 – January 2012). Vice-President for Finance<br />
of LUKOIL (from February 2012).<br />
Anatoly Moskalenko<br />
Member of the LUKOIL Management Committee<br />
Vice-President for Human Resource Management and Corporate Structure<br />
Development of LUKOIL<br />
Born 1959<br />
Graduated in 1980 from Moscow Higher School of the Armed Forces, from<br />
the Military-Diplomatic Academy in 1987, and from the Russian Presidential<br />
Civil Service Academy in 2005. Doctoral Candidate in Economics. Awarded<br />
five orders and 20 medals. Served in the Armed Forces (1976–2001). Head<br />
of the Human Resources Department of LUKOIL (2001–2003). Head of the<br />
Main Division of Human Resources at LUKOIL (2003 – January 2012). Vice-<br />
President for Human Resource Management and Corporate Structure<br />
Development of LUKOIL (from February 2012).<br />
128
Annual report 2011<br />
Vladimir Mulyak<br />
Member of the LUKOIL Management Committee<br />
Vice-President for Technologies and Development of Oil and Gas Fields<br />
of LUKOIL<br />
Born 1955<br />
Graduated from Moscow Gubkin Petrochemical & Gas Institute in 1977.<br />
Doctoral Candidate in Geological and Mineral Sciences. Awarded a medal<br />
of the order ‘For services to Russia’ (2 nd grade). Winner of a Russian<br />
Government Prize for Science and Technology. Chief Engineer, Head of<br />
Lasyeganneft oil and gas production unit of LUKoil-Langepasneftegaz<br />
(1990–1996). First Deputy CEO for Production, CEO of Belorusneft (1996–<br />
2001). First Vice-President for Production of KomiTEK in 2001. Chief Engineer,<br />
First Deputy CEO, CEO of LUKOIL-Komi (2002–2007). Vice-President, Head<br />
of the Main Division of Oil and Gas Production of LUKOIL (2007 – January<br />
2012). Vice-President for Technologies and Development of Oil and Gas<br />
Fields of LUKOIL (from February 2012).<br />
Vladimir Nekrasov<br />
Member of the LUKOIL Management Committee<br />
First Vice-President of LUKOIL (Refining & Marketing)<br />
Born 1957<br />
Graduated in 1978 from Tyumen Industrial Institute. Doctoral Candidate in<br />
Technical Science, Member of the Academy of Mining Sciences. Awarded<br />
two orders and three medals. Winner of a Russian Government Prize.<br />
Chief Engineer, CEO of Kogalymneftegaz (part of LUKOIL-Western Siberia)<br />
(1992–1999). Vice-President of LUKOIL and CEO of LUKOIL-Western Siberia<br />
(1999–2005). First Vice-President of LUKOIL since 2005.<br />
129
Valery Subbotin<br />
Member of the LUKOIL Management Committee<br />
Vice-President for Supplies and Sales of LUKOIL<br />
Born 1974<br />
Graduated from Tyumen State University in 1996. Awarded a medal of the<br />
order ‘For Services to Russia’ (2 nd grade). Worked at LUKOIL-Prague, LUKOIL-<br />
Bulgaria, and the Moscow Representative Office of the company LITASCO<br />
(1998–2003). First Deputy Head of the Office of the Board of Directors<br />
of LUKOIL (2003–2005). Vice-President, Head of the Main Division of Supplies<br />
and Sales of LUKOIL (2007 – January 2012). Vice-President for Supplies<br />
and Sales of LUKOIL (from February 2012).<br />
Vadim Vorobyov<br />
Member of the Management Board of LUKOIL<br />
Vice-President for Coordination of Petroleum Products Sales of LUKOIL<br />
Born 1961<br />
Graduated in 1983 from the Lobachevsky Gorky State University, in 1998<br />
from the Lobachevsky Nizhny Novgorod State University in 1998. Doctoral<br />
Candidate in Economics. Awarded a medal of the order, ‘For services<br />
to Russia’ (2 nd grade). Komsomol and Communist Party work (1981–1992).<br />
Management positions in insurance and bank structures in Nizhny<br />
Novgorod (1992–1998). Vice-President, President of NORSI-OIL (1998–<br />
2002). CEO of LUKOIL-Volganefteprodukt (2002–2005). Vice-President<br />
of LUKOIL and Head of the Main Department for Coordination of Petroleum<br />
Product Sales in Russia (2005–2009). Vice-President of LUKOIL<br />
and Head of the Main Department for Coordination of Petroleum Product<br />
Sales (2009–2012). Vice-President for Coordination of Petroleum Product<br />
Sales of LUKOIL (from 2012).<br />
130
Annual report 2011<br />
Shares of BoD and Management Committee members in Charter Capital,<br />
as of December 31, 2011 1<br />
BoD and Management Committee members Share, %<br />
Vagit Alekperov 20.60 2<br />
Anatoly Barkov 0.07<br />
Igor Belikov –<br />
Viktor Blazheev –<br />
Gennady Fedotov 0.02<br />
Leonid Fedun 9.27 2<br />
Valery Grayfer 0.007<br />
Herman Gref –<br />
Igor Ivanov –<br />
Evgeny Khavkin 0.01<br />
Lyubov Khoba 0.34<br />
Sergei Kukura 0.39<br />
Ravil Maganov 0.37<br />
Sergei Malyukov 0.001<br />
Ivan Masliaev 0.02<br />
Richard H. Matzke –<br />
Sergei Mikhailov 0.06<br />
Mark Mobius –<br />
Guglielmo Moscato –<br />
Anatoly Moskalenko 0.01<br />
Vladimir Mulyak 0.01<br />
Vladimir Nekrasov 0.04<br />
Alexander Shokhin –<br />
Valery Subbotin 0.005<br />
Vadim Vorobyov 0.006<br />
1<br />
Unless otherwise indicated, share stakes of BoD and Management Committee members are shown in<br />
accordance with requirements of Russian law for disclosure of such information, and include shares held<br />
directly by Board/Management Committee members as well as shares held by nominee investors in their<br />
names.<br />
2<br />
Including beneficiary ownership.<br />
131
Remuneration to Members of the Board of Directors and Management Board<br />
In compliance with the decision of the LUKOIL Annual<br />
General Meeting of Shareholders, each member of the<br />
Board of Directors was paid a remuneration of 4.47<br />
million rubles in 2011 for carrying out their duties.<br />
There were additional payments for the roles of Board<br />
Chairman (1.04 million rubles), Chairman of a BoD<br />
Committee (520,000 rubles), as well as some other<br />
types of payment associated with duties of Board<br />
members and members of BoD Committees. Members<br />
of the Board of Directors also received compensation<br />
for costs associated with fulfilment of their duties as<br />
Board members, the nature of which was defined by<br />
the LUKOIL Annual General Meeting of Shareholders<br />
on 24 June 2004, in the amount of factually incurred<br />
costs, which are confirmed by documents. Mark<br />
Mobius, a BoD member, filed for rejection of the<br />
remuneration that was offered to him by the decision<br />
of the LUKOIL Annual General Meeting. The rejection<br />
was taken into account when payments were made to<br />
the BoD members.<br />
In the reporting year members of the Management<br />
Committee were paid remuneration equal to their<br />
monthly salary in their principle job. This payment was<br />
made in accordance with the main terms of contracts,<br />
drawn up with members of the Management<br />
Committee, subject to achievement of key corporate<br />
targets in the reporting period. Members of the<br />
Management Committee also received an annual<br />
base salary, annual bonus payments based on results<br />
of their work during the year, additional compensations<br />
of a social nature, and annual long-term<br />
premium payments in the framework of the longterm<br />
incentive program for employees of LUKOIL<br />
and its subsidiaries. Size of long-term premium<br />
payments was calculated by multiplying the number<br />
of shares conditionally owned by a Company official<br />
by the dividend per share, which was approved by<br />
the Annual General Meeting of Shareholders.<br />
Remuneration in 2011 to members of the BoD and Management Committee of LUKOIL<br />
Paid in 2011, thousand rubles<br />
Salary Bonuses Remuneration<br />
Other<br />
payments<br />
Total<br />
Board of Directors – – 50,316 4,074 54,390<br />
Management<br />
Committee 485,740 475,088 32,916 22,697 1,016,441<br />
132
Annual report 2011<br />
Changes in Group Structure<br />
The Program for restructuring of LUKOIL has been<br />
in progress since 2002. Its main purpose is to increase<br />
shareholder value by raising the level of transparency<br />
and efficiency of management processes, consolidating<br />
core subsidiaries and withdrawing non-core<br />
and inefficient assets from the Group.<br />
The Company continued work in 2011 to dispose<br />
of non-core, unused and inefficient assets. A total<br />
of 950 assets were disposed of for a total gain<br />
of almost $290 million. The biggest transactions were<br />
sale of 100% of the Company’s interests in Global-<br />
Flot LLC, LANKOR LLC, and of equity investments<br />
in Kiinteistoosakeyhtio Oy Bulevardi 26. Part of the<br />
proceeds from these sales was used for financing of<br />
the Company’s core activities. More than 4,000 noncore,<br />
unused and inefficient property assets are to<br />
be withdrawn from the Group during 2012–2013.<br />
Acquisition by LUKOIL of a 25.1% equity holding in<br />
Bashneft-Polyus LLC and an agreement between<br />
LUKOIL-Komi and Bashneft-Polyus LLC for sale and<br />
purchase of 20 wells at the Trebs and Titov fields<br />
were both completed in 2011 as part of agreements<br />
made between LUKOIL and Bashneft Oil Company<br />
for involvement of LUKOIL in development of the<br />
Trebs and Titov fields.<br />
LUKOIL acquired 11% in a joint venture for<br />
management of the ISAB oil refining complex in Italy,<br />
from the company ERG. The transaction increases<br />
LUKOIL’s stake in the JV from 49% to 60%. Thus ERG<br />
partially exercised its sell option in accordance with<br />
the agreement on JV creation in 2008.<br />
The number of companies within LUKOIL Group and<br />
of companies, in which LUKOIL companies have an<br />
interest, decreased by 25 units to 337 (subsidiary<br />
and associate companies, as defined by US GAAP<br />
criteria). 16 companies were added to the Group in<br />
the reporting period, and 41 were disposed of.<br />
Financial Management<br />
The Company uses a global approach to<br />
financial management, reflecting the scale<br />
and geographical diversity of its business.<br />
The system for centralized management<br />
of treasury operations, which was created<br />
by the Company in 2006, ensures efficient<br />
distribution of capital among Group<br />
organizations.<br />
Work continued in 2011 for improvement of the<br />
cash management system inside LUKOIL Group.<br />
A project was successfully implemented for automated<br />
cash debiting/crediting in intra-corporate financing<br />
inside Russia, and all major companies within<br />
LUKOIL Group (over 50 in total) were included in<br />
the project. Changeover to a fully automated system<br />
has increased the efficiency of liquidity management<br />
by reducing withdrawal of sums from cash turnover,<br />
and lessened the financial burden on Group<br />
companies.<br />
Intra-Group settlements were optimized by design<br />
and implementation of a single agreement for<br />
offsetting of loan debt with respect to all Group<br />
133
companies in Russia, enabling an automated system<br />
of cash transfer between the parent company, as<br />
the pool leader, and the Group’s Russian companies.<br />
A system for novation of intra-Group settlement<br />
obligations with respect to commission and loan<br />
agreements has also been designed and is ready<br />
to be implemented, enabling substantial reduction<br />
in the amounts withdrawn from Group cash turnover<br />
through changes to the operating systems of main<br />
servicing banks.<br />
The Company continued work in 2011 for optimization<br />
of its credit portfolio, reducing debt financing<br />
costs and extending the term of current debt<br />
instruments on the best market terms.<br />
LUKOIL increased the volume of its committed credit<br />
lines from $900 million to $1.3 billion in 2011 in order<br />
to maintain investment rating of the Company’s<br />
liquidity ratio at the requisite level. Work was also<br />
carried out to extend the terms of current agreements.<br />
The Company installed a system of financial risk<br />
monitoring as part of its project to build a system<br />
that prevents cash flow interruptions; adequacy<br />
and availability of relevant information was tested<br />
and a mathematical business model for LUKOIL<br />
Group was designed as well as an interactive Group<br />
report taking account of risk factors.<br />
Internal Control and Audit<br />
The system of internal control and internal audit is an<br />
integral part of the Company’s corporate governance<br />
structure, ensuring that the Company operates<br />
efficiently and that the interests of its shareholders<br />
and investors are protected. The Group has an Internal<br />
Audit Service, which ensures that management<br />
receives objective and accurate information on the<br />
business of organizations in LUKOIL Group.<br />
A total of 20 control and internal audit checks were<br />
carried out at LUKOIL Group organizations in all<br />
business segments during 2011. The main purposes<br />
of the checks were:<br />
• monitoring of business efficiency, including<br />
investment efficiency, of LUKOIL Group<br />
organizations<br />
• checking that business of Group organizations<br />
is in accordance with LUKOIL’s strategic goals<br />
and monitoring compliance with Company<br />
management decisions, including decisions taken<br />
as a result of previous checks<br />
• identifying significant risks related to business<br />
of Group organizations and designing<br />
recommendations on ways to minimize risks<br />
• assessing measures by management of<br />
subsidiaries and structural subdivisions<br />
of the Company to ensure stable and efficient<br />
functioning of various components of the<br />
internal control system<br />
• assessing whether organization and conduct<br />
of book-keeping and financial accounting<br />
help to make operating and financial control<br />
more efficient, contribute to further growth<br />
of shareholder value and protect shareholder<br />
interests<br />
134
Annual report 2011<br />
• ensuring that LUKOIL Group assets are properly<br />
kept and efficiently used<br />
The results of audit and control checks were submitted<br />
to the Company President, and were brought to the<br />
notice of heads of the audited subsidiaries and of the<br />
Audit Committee of the Board of Directors of LUKOIL,<br />
in accordance with the established procedure.<br />
Audit recommendations and management decisions<br />
were designed based on outcome of the checks<br />
in order to raise efficiency of Company business<br />
and minimize any risks, which had been identified.<br />
Based on these recommendations, subsidiaries and<br />
Group sub-divisions, which supervise the activity of<br />
subsidiaries, have designed measures to eliminate<br />
failures and violations that were identified by the<br />
internal audit process.<br />
In order to ensure efficiency of its internal audit<br />
process, LUKOIL constantly monitors execution of<br />
decisions taken by the Company’s governing bodies as<br />
a result of audits and execution of approved measures<br />
that have been designed on the basis of internal audit<br />
recommendations. Monitoring showed that 94.8% of<br />
such instructions were executed to schedule in 2011<br />
(the level in 2010 was 90.6%).<br />
The Group works constantly to organize and<br />
coordinate audit activity at LUKOIL companies.<br />
During 2011 checks of financial and business activity<br />
in 2010 were carried out at 69 Group companies and<br />
checks of activity during nine months of 2011 were<br />
carried out at 63 Group companies.<br />
The Company continued its work in 2011 to improve<br />
its risk management system. A new document, the<br />
LUKOIL risk management policy, was prepared in the<br />
reporting year, setting out a conceptual basis for risk<br />
management by the Group. A risk committee was<br />
also created, answering directly to the President of<br />
LUKOIL, and a provisional method for identification,<br />
description, and assessment of risks at LUKOIL<br />
organizations was compiled. The method was tested<br />
and approved at a number of Group organizations<br />
during the accounting year.<br />
135
Information Disclosure<br />
Since receiving a full secondary listing on the London<br />
Stock Exchange in 2002 the Company has set up<br />
and successfully operates a system of corporate<br />
information disclosure for the investment community.<br />
LUKOIL’s level of informational openness and<br />
quality of information disclosure fully comply with<br />
internationally accepted standards and with standards<br />
of the UK Financial Services Authority.<br />
LUKOIL won prizes in several annual report<br />
competitions in 2011, as in previous years. Such<br />
prizes are a testimony to the Company’s efforts to<br />
enhance the scale and efficiency of information<br />
disclosure about Company business to investors,<br />
shareholders and the general public.<br />
The Company’s policy of informational openness<br />
includes:<br />
• quarterly publication of financial statements,<br />
prepared in accordance with US GAAP<br />
• conference calls and webcasts for the investment<br />
community to accompany publication of financial<br />
results and announcement of other important<br />
corporate events<br />
• annual publication of international audit<br />
of Company hydrocarbon reserves<br />
• annual publication of an Analyst Databook<br />
and Fact Book containing detailed industrial<br />
and financial statistics<br />
In accordance with the Disclosure and Transparency<br />
Rules of the UK Financial Services Authority (FSA),<br />
as a foreign company with a standard listing in<br />
the United Kingdom, LUKOIL started from 2011 to<br />
prepare a Corporate Governance Report for the<br />
previous year.<br />
The Company continued to prioritize outside<br />
meetings with shareholders for purposes of imparting<br />
information. Such meetings were held in 2011 in<br />
Ufa and Saint Petersburg. Matters discussed at<br />
the meetings included: rights and duties of shareholders,<br />
dividend policy of LUKOIL and procedure<br />
for dividend payment, ownership rights to shares<br />
that are inherited, details of how inherited dividends<br />
can be received, changes of shareholders details in<br />
the register of owners of securities, and obtaining<br />
information from the shareholder register.<br />
Meetings with shareholders were carried out as part<br />
of the Program for improvement of shareholder<br />
rights mechanisms in the period 2010–2014, which<br />
was approved by the Board of Directors of LUKOIL<br />
on May 18, 2010. This Program calls for regular meetings<br />
with Company shareholders living in various<br />
regions of the Russian Federation and wider use of<br />
information technologies, and electronic means<br />
of communication with shareholders in order to<br />
ensure that they are better informed of their rights and<br />
the means of exercising those rights.<br />
• publication every two years of a Company<br />
Sustainability Report on the Company’s activities<br />
in the Russian Federation<br />
• regular meetings with investors and shareholders<br />
• trips for representatives of the investment<br />
community to Company operating regions<br />
136
Annual report 2011<br />
Company Securities<br />
The LUKOIL share price saw major fluctuations in<br />
2011, reflecting the situation on the Russian and<br />
international stock markets. Maximum price per<br />
share in the reporting year was 2,090 rubles and the<br />
minimum price level was 1,500 rubles. However,<br />
LUKOIL shares remained among the most liquid<br />
securities on the Russian stock market in 2011 and<br />
were included in calculation of all main share indexes.<br />
As in previous years, trading in Company shares in<br />
Russia was concentrated on the Moscow Interbank<br />
Currency Exchange (MICEX) and the RTS Stock<br />
Exchange.<br />
Rapid growth of the LUKOIL share price in the first<br />
half of the year was due mainly to growth of prices<br />
for hydrocarbons, caused by supply limitations<br />
associa-ted with political instability in the Middle<br />
East and North Africa. Prices began to decline in the<br />
second quarter of the year, due to intensification<br />
of the debt crisis in peripheral countries of the<br />
European Union, which exerted pressure on markets<br />
worldwide. High levels of volatility continued<br />
until November 2011, due to uncertainty about<br />
further actions by governments in developed<br />
countries to tackle the problems of mounting<br />
debt. Market concern over the state of the US,<br />
European and Japanese economies had negative<br />
impact on all of the world’s leading share indexes.<br />
By October markets were at their lowest levels since<br />
the beginning of 2011, after which the situation<br />
stabilized towards the end of the year.<br />
The LUKOIL share price on the MICEX exchange<br />
fell by 2.4% in the course of 2011 and stood at<br />
1,701 rubles ($53.1) per share at the end of December.<br />
However, that performance should be compared<br />
with a 16.9% fall by the MICEX Index. So prices<br />
for LUKOIL shares were much stronger than the<br />
overall Russian stock market. LUKOIL’s capitalization as<br />
of 31 December, 2011 was $44.9 billion.<br />
LUKOIL SHARE PRICE ON THE MICEX EXCHANGE IN 2011<br />
137
The volume of trading in LUKOIL shares and depository<br />
receipts increased in 2011 compared with 2010.<br />
According to the exchanges total traded volume<br />
of LUKOIL shares at MICEX and RTS increased by<br />
22.7% to 746 million shares, or by 25.3% to<br />
$43.5 billion. The Company’s depositary receipts<br />
were traded on the US over-the-counter market,<br />
and on exchanges in London, Frankfurt, Munich and<br />
Stuttgart. The total number of receipts (ADRs) issued<br />
on the Company’s common shares at the end of<br />
2011 was 548.33 million (64.47% of Company share<br />
capital). The volume of trading in the Company’s<br />
ADRs on the London Stock Exchange (the main<br />
institution where they are traded) increased by<br />
58.7% in the reporting year to a level of $79.6 billion.<br />
LUKOIL ADRs had the second largest traded volume<br />
among international companies on London Stock<br />
Exchange IOB system (15.1% of total volumes traded<br />
in the system).<br />
LUKOIL shares are still used as the base instrument<br />
for derivative securities on forward markets. Future<br />
and option contracts for delivery of LUKOIL shares<br />
are one of the main instruments in the futures section<br />
of the RTS market.<br />
In contrast with 2010, LUKOIL Group did not carry<br />
out issues and placements of bonds in 2011, and the<br />
Group was therefore able to significantly reduce its<br />
debt burden in the course of the year.<br />
LUKOIL did its utmost in the reporting year to maintain<br />
shareholder value. Record levels of net income<br />
and free cash flow were achieved, despite lower<br />
operating results, ensuring that the Company<br />
remained attractive to investors in the context<br />
of instability of the world financial system.<br />
MONTHLY VOLUME OF TRADING IN SHARES (ADR) OF LUKOIL IN 2011, $ million<br />
138
Annual report 2011<br />
LUKOIL share price compared with Bloomberg Oils Index and MICEX Index in 2011, %<br />
Changes in ownership structure of LUKOIL share capital in 2011<br />
Main LUKOIL shareholders (> 1% of ordinary shares) 1<br />
Number of<br />
shares on<br />
January 1, 2011<br />
% of total shares<br />
on January 1, 2011<br />
Number of<br />
shares on<br />
January 1, 2012<br />
% of total<br />
shares on<br />
January 1, 2012<br />
ING Bank (Eurasia) ZAO 645,159,254 75.85 645,877,294 75.94<br />
Depository-Clearing<br />
Company 69,483,048 8.17 72,002,391 8.47<br />
National Depository<br />
Center 52,526,643 6.18 46,976,333 5.52<br />
SDK Garant 33,411,404 3.93 33,427,724 3.93<br />
DK URALSIB 12,065,926 1.42 12,049,529 1.42<br />
J.P. Morgan Bank<br />
International LLC 7,778,301 0.91 10,983,473 1.29<br />
1<br />
Nominee.<br />
139
Dividends<br />
LUKOIL bases its dividend policy on a balance of<br />
interests between the Company and its shareholders,<br />
aiming to increase the Company's investment<br />
attractiveness and shareholder value, and to respect<br />
and strictly observe the rights of shareholders, as set<br />
out in acting legislation of the Russian Federation,<br />
the Company Charter and internal documents.<br />
Dividends accrued in 2011 on results for 2010<br />
were $1,646 million or 18.3% of consolidated<br />
net income of LUKOIL Group for 2010 under<br />
US GAAP.<br />
Dividend payments for 2011 will be increased<br />
in comparison with payments for 2010. On 27 April<br />
2012 the Board of Directors recommended the<br />
Annual General Meeting of Shareholders to approve<br />
dividends for 2011 at a level of 75 rubles per share<br />
($2.33 at the exchange rate on 31 December 2011).<br />
So the share of dividends in consolidated net income<br />
of LUKOIL will be 19.1% and dividend yield will<br />
be 4.2%. Basic earnings per share in 2011 were $13.30<br />
in comparison with $10.95 in 2010.<br />
Dividends per common share (rubles) and dividend yield, %<br />
Dividend, rubles Dividend yield, % 2<br />
2007 42 2.02<br />
2008 50 2.86<br />
2009 52 3.48<br />
2010 59 3.52<br />
2011 1 75 4.17<br />
1<br />
Dividends recommended by the LUKOIL Board of Directors for approval at the Annual General Meeting of Shareholders.<br />
2<br />
Dividend yield is calculated based on the average market price for LUKOIL ordinary shares on the MICEX exchange and<br />
the dollar exchange rate at the end of the year, for which the dividends are paid.<br />
Dividends paid on ordinary shares of the Company,<br />
$ million<br />
140
OAO LUKOIL<br />
CONSOLIDATED FINANCIAL<br />
STATEMENTS<br />
As of December 31, 2011 and 2010<br />
and for each of the years in the three-year<br />
period ended December 31, 2011<br />
prepared in accordance<br />
with US GAAP
ZAO KMPG<br />
10 Presnenskaya Naberezhnaya<br />
Moscow, Russia 123317<br />
Telephone +7 (495) 937 4477<br />
Fax +7 (495) 937 4400/99<br />
Internet www.kpmg.ru<br />
Independent Auditors’ Report<br />
The Board of Directors<br />
OAO LUKOIL:<br />
We have audited the accompanying consolidated balance sheets of OAO LUKOIL and subsidiaries as<br />
of December 31, 2011 and 2010, and the related consolidated statements of income, stockholders’ equity and<br />
comprehensive income, and cash flows for each of the years in the three year period ended December 31, 2011.<br />
These consolidated financial statements are the responsibility of the Company’s management. Our responsibility<br />
is to express an opinion on these consolidated financial statements based on our audits.<br />
We conducted our audits in accordance with auditing standards generally accepted in the United States of<br />
America. Those standards require that we plan and perform the audit to obtain reasonable assurance about whether<br />
the financial statements are free of material misstatement. An audit includes consideration of internal control<br />
over financial reporting as a basis for designing audit procedures that are appropriate in the circumstances, but<br />
not for the purpose of expressing an opinion on the effectiveness of the Company’s internal control over<br />
financial reporting. Accordingly, we express no such opinion. An audit also includes examining, on a test basis,<br />
evidence supporting the amounts and disclosures in the financial statements, assessing the accounting principles<br />
used and significant estimates made by management, as well as evaluating the overall financial statement<br />
presentation. We believe that our audits provide a reasonable basis for our opinion.<br />
In our opinion, the consolidated financial statements referred to above present fairly, in all material respects,<br />
the financial position of OAO LUKOIL and subsidiaries as of December 31, 2011 and 2010, and the results of their<br />
operations and their cash flows for each of the years in the three year period ended December 31, 2011, in conformity<br />
with U.S. generally accepted accounting principles.<br />
U.S. generally accepted accounting principles require that the Supplementary Information on Oil and Gas<br />
Exploration and Production Activities on pages 180 through 188 be presented to supplement the basic<br />
consolidated financial statements. Such information, although not a part of the basic consolidated financial<br />
statements, is required by the Financial Accounting Standards Board who considers it to be an essential part<br />
of financial reporting for placing the basic consolidated financial statements in an appropriate operational,<br />
economic, or historical context. We have applied certain limited procedures to the required supplementary<br />
information in accordance with auditing standards generally accepted in the United States of America, which<br />
consisted of inquiries of management about the methods of preparing the information and comparing the<br />
information for consistency with management's responses to our inquiries, the basic consolidated financial<br />
statements, and other knowledge we obtained during our audit of the basic consolidated financial statements.<br />
We do not express an opinion or provide any assurance on the information because the limited procedures do<br />
not provide us with sufficient evidence to express an opinion or provide any assurance.<br />
ZAO KPMG<br />
Moscow, Russian Federation<br />
February 24, 2012<br />
ZAO KPMG, a company incorporated under the Laws of the Russian<br />
Federation, a subsidiary of KPMG Europe LLP, and a member firm of the<br />
KPMG network of independent member firms affiliated with KPMG International<br />
Cooperative (“KPMG International”), a Swiss entity.<br />
142
OAO LUKOIL Consolidated Balance Sheets As of December 31, 2011 and 2010<br />
(Millions of US dollars, unless otherwise noted)<br />
Note 2011 2010<br />
Assets<br />
Current assets<br />
Cash and cash equivalents 3 2,753 2,368<br />
Short-term investments 157 168<br />
Accounts receivable, net 5 8,921 8,219<br />
Inventories 6 7,533 6,231<br />
Prepaid taxes and other expenses 3,219 2,934<br />
Other current assets 946 697<br />
Total current assets 23,529 20,617<br />
Investments 7 5,952 5,637<br />
Property, plant and equipment 8, 9 56,803 54,629<br />
Deferred income tax assets 13 591 676<br />
Goodwill and other intangible assets 10 1,344 1,446<br />
Other non-current assets 2,973 1,012<br />
Total assets 91,192 84,017<br />
Liabilities and Equity<br />
Current liabilities<br />
Accounts payable 5,995 5,607<br />
Short-term borrowings and current portion of long-term debt 11 1,792 2,125<br />
Taxes payable 2,271 2,099<br />
Other current liabilities 1,050 944<br />
Total current liabilities 11,108 10,775<br />
Long-term debt 12, 16 7,300 9,069<br />
Deferred income tax liabilities 13 2,790 2,417<br />
Asset retirement obligations 8 2,120 1,788<br />
Other long-term liabilities 408 360<br />
Total liabilities 23,726 24,409<br />
Equity 15<br />
OAO LUKOIL stockholders’ equity<br />
Common stock 15 15<br />
Treasury stock, at cost (4,081) (3,683)<br />
Equity-linked notes (980) (980)<br />
Additional paid-in capital 4,798 4,700<br />
Retained earnings 67,940 59,212<br />
Accumulated other comprehensive loss (54) (67)<br />
Total OAO LUKOIL stockholders’ equity 67,638 59,197<br />
Non-controlling interests (172) 411<br />
Total equity 67,466 59,608<br />
Total liabilities and equity 91,192 84,017<br />
President of OAO LUKOIL<br />
Alekperov V.Y.<br />
Vice-president –<br />
Chief accountant of OAO LUKOIL<br />
Khoba L.N.<br />
The accompanying notes are an integral part of these consolidated financial statements.<br />
143
OAO LUKOIL Consolidated Statements of Income For the years ended December 31, 2011, 2010 and 2009<br />
(Millions of US dollars, unless otherwise noted)<br />
Note 2011 2010 2009<br />
Revenues<br />
Sales (including excise and export tariffs) 21 133,650 104,956 81,083<br />
Costs and other deductions<br />
Operating expenses (9,055) (8,298) (7,340)<br />
Cost of purchased crude oil, gas and products (59,694) (43,250) (31,761)<br />
Transportation expenses (6,121) (5,608) (4,830)<br />
Selling, general and administrative expenses (3,822) (3,558) (3,306)<br />
Depreciation, depletion and amortization (4,473) (4,154) (3,937)<br />
Taxes other than income taxes 13 (12,918) (8,978) (6,474)<br />
Excise and export tariffs (22,217) (18,878) (13,058)<br />
Exploration expenses (532) (336) (218)<br />
Loss on disposals and impairments of assets (1,663) (363) (381)<br />
Income from operating activities 13,155 11,533 9,778<br />
Interest expense (694) (712) (667)<br />
Interest and dividend income 211 174 134<br />
Equity share in income of affiliates 7 690 472 351<br />
Currency translation loss (301) (122) (520)<br />
Other non-operating income (expense) 58 125 (13)<br />
Income before income taxes 13,119 11,470 9,063<br />
Current income taxes (2,678) (2,104) (1,922)<br />
Deferred income taxes (615) (247) (72)<br />
Total income tax expense 13 (3,293) (2,351) (1,994)<br />
Net income 9,826 9,119 7,069<br />
Net loss (net income) attributable<br />
to non-controlling interests 531 (113) (58)<br />
Net income attributable to OAO LUKOIL 10,357 9,006 7,011<br />
Earnings per share of common stock attributable to<br />
OAO LUKOIL (US dollars):<br />
Basic 15 13.30 10.95 8.28<br />
Diluted 15 13.04 10.94 8.28<br />
The accompanying notes are an integral part of these consolidated financial statements.<br />
144
OAO LUKOIL Consolidated Statements of Stockholders’ Equity and Comprehensive Income<br />
For the years ended December 31, 2011, 2010 and 2009<br />
(Millions of US dollars, unless otherwise noted)<br />
Stockholders’<br />
equity<br />
2011 2010 2009<br />
Comprehensive<br />
income<br />
Stockholders’<br />
equity<br />
Comprehensive<br />
income<br />
Stockholders’<br />
equity<br />
Common stock<br />
Balance as of January 1 15 15 15<br />
Balance as of December 31 15 15 15<br />
Comprehensive<br />
income<br />
Treasury stock<br />
Balance as of January 1 (3,683) (282) (282)<br />
Stock purchased (398) (3,664) –<br />
Stock disposed – 263 –<br />
Balance as of December 31 (4,081) (3,683) (282)<br />
Equity-linked notes<br />
Balance as of January 1 (980) – –<br />
Equity-linked notes purchased – (980) –<br />
Balance as of December 31 (980) (980) –<br />
Additional paid-in capital<br />
Balance as of January 1 4,700 4,699 4,694<br />
Premium on non-outstanding shares issued – 1 –<br />
Effect of stock compensation plan 98 98 20<br />
Convertible bonds issue – 113 –<br />
Changes in non-controlling interests – (141) (15)<br />
Treasury stock disposed – (70) –<br />
Balance as of December 31 4,798 4,700 4,699<br />
Retained earnings<br />
Balance as of January 1 59,212 51,634 45,983<br />
Net income 10,357 10,357 9,006 9,006 7,011 7,011<br />
Dividends on common stock (1,629) (1,428) (1,360)<br />
Balance as of December 31 67,940 59,212 51,634<br />
Accumulated other comprehensive loss,<br />
net of tax<br />
Balance as of January 1 (67) (75) (70)<br />
Pension benefits:<br />
Prior service cost 22 22 12 12 (4) (4)<br />
Actuarial (loss) gain (9) (9) (4) (4) 1 1<br />
Unrecognized loss on available-for-sale<br />
securities – – – – (2) (2)<br />
Balance as of December 31 (54) (67) (75)<br />
Total comprehensive income 10,370 9,014 7,006<br />
Total OAO LUKOIL stockholders’ equity<br />
as of December 31 67,638 59,197 55,991<br />
Non-controlling interests<br />
Balance as of January 1 411 388 670<br />
(Net loss) net income attributable<br />
to non-controlling interests (531) 113 58<br />
Changes in non-controlling interests (52) (90) (340)<br />
Balance as of December 31 (172) 411 388<br />
Total equity as of December 31 67,466 59,608 56,379<br />
The accompanying notes are an integral part of these consolidated financial statements.<br />
145
OAO LUKOIL Consolidated Statements of Stockholders’ Equity and Comprehensive Income<br />
For the years ended December 31, 2011, 2010 and 2009<br />
(Millions of US dollars, unless otherwise noted)<br />
Share activity<br />
2011 2010 2009<br />
(thousands<br />
of shares)<br />
(thousands<br />
of shares)<br />
(thousands<br />
of shares)<br />
Common stock, issued<br />
Balance as of January 1 850,563 850,563 850,563<br />
Balance as of December 31 850,563 850,563 850,563<br />
Treasury stock<br />
Balance as of January 1 (69,208) (3,836) (3,836)<br />
Purchase of treasury stock (6,893) (68,912) –<br />
Disposal of treasury stock – 3,540 –<br />
Balance as of December 31 (76,101) (69,208) (3,836)<br />
The accompanying notes are an integral part of these consolidated financial statements.<br />
146
OAO LUKOIL Consolidated Statements of Cash Flows For the years ended December 31, 2011, 2010 and 2009<br />
(Millions of US dollars)<br />
Note 2011 2010 2009<br />
Cash flows from operating activities<br />
Net income attributable to OAO LUKOIL 10,357 9,006 7,011<br />
Adjustments for non-cash items:<br />
Depreciation, depletion and amortization 4,473 4,154 3,937<br />
Equity share in income of affiliates, net of dividends received 185 316 (213)<br />
Dry hole write-offs 417 225 117<br />
Loss on disposals and impairments of assets 1,663 363 381<br />
Deferred income taxes 615 247 72<br />
Non-cash currency translation gain (214) (44) (57)<br />
Non-cash investing activities (6) (67) (20)<br />
All other items – net (447) 167 138<br />
Changes in operating assets and liabilities:<br />
Trade accounts receivable (758) (2,285) (1,171)<br />
Inventories (1,420) (813) (1,719)<br />
Accounts payable 885 1,508 96<br />
Taxes payable 177 274 292<br />
Other current assets and liabilities (413) 490 19<br />
Net cash provided by operating activities 15,514 13,541 8,883<br />
Cash flows from investing activities<br />
Acquisition of licenses (25) (15) (40)<br />
Capital expenditures (8,249) (6,596) (6,483)<br />
Proceeds from sale of property, plant and equipment 156 128 91<br />
Purchases of investments (101) (137) (216)<br />
Proceeds from sale of investments 79 126 478<br />
Sale of subsidiaries and equity method affiliates, net of cash disposed 227 130 92<br />
Acquisitions of subsidiaries and equity method affiliates<br />
(including advances related to acquisitions), net of cash acquired (2,860) (932) (2,473)<br />
Net cash used in investing activities (10,773) (7,296) (8,551)<br />
Cash flows from financing activities<br />
Net movements of short-term borrowings (633) (213) (1,281)<br />
Proceeds from issuance of long-term debt 1 2,515 5,467<br />
Principal repayments of long-term debt (1,372) (2,267) (2,697)<br />
Dividends paid on Company common stock (1,714) (1,471) (1,337)<br />
Dividends paid to non-controlling interest stockholders (116) (85) (85)<br />
Financing received from non-controlling interest stockholders 3 18 20<br />
Purchase of Company’s stock (398) (3,664) –<br />
Sale of Company’s stock – 193 –<br />
Purchase of equity-linked notes – (980) –<br />
Purchases of non-controlling interest (including advances related to acquisitions) (34) (192) (372)<br />
Net cash used in financing activities (4,263) (6,146) (285)<br />
Effect of exchange rate changes on cash and cash equivalents (93) (5) (12)<br />
Net increase in cash and cash equivalents 385 94 35<br />
Cash and cash equivalents at beginning of year 2,368 2,274 2,239<br />
Cash and cash equivalents at end of year 3 2,753 2,368 2,274<br />
Supplemental disclosures of cash flow information<br />
Interest paid<br />
Income taxes paid<br />
683<br />
2,508<br />
718<br />
2,126<br />
520<br />
1,575<br />
The accompanying notes are an integral part of these consolidated financial statements.<br />
147
OAO LUKOIL Notes to Consolidated Financial Statements<br />
(Millions of US dollars, except as indicated)<br />
NOTE 1.<br />
Organization and environment<br />
The primary activities of OAO LUKOIL (the “Company”) and<br />
its subsidiaries (together, the “Group”) are oil exploration,<br />
production, refining, marketing and distribution. The<br />
Company is the ultimate parent entity of this vertically<br />
integrated group of companies.<br />
The Group was established in accordance with Presidential<br />
Decree 1403, issued on November 17, 1992. Under this<br />
decree, on April 5, 1993, the Government of the Russian<br />
Federation transferred to the Company 51% of the voting<br />
shares of fifteen enterprises. Under Government Resolution<br />
861 issued on September 1, 1995, a further nine enterprises<br />
were transferred to the Group during 1995. Since 1995, the<br />
Group has carried out a share exchange program to increase<br />
its shareholding in each of the twenty-four founding<br />
subsidiaries to 100%.<br />
From formation, the Group has expanded substantially<br />
through consolidation of its interests, acquisition of new<br />
companies and establishment of new businesses.<br />
Business and economic environment<br />
The accompanying financial statements reflect management’s<br />
assessment of the impact of the business environment<br />
in the countries in which the Group operates on the<br />
operations and the financial position of the Group. The future<br />
business environments may differ from management’s<br />
assessment.<br />
Basis of preparation<br />
These consolidated financial statements have been prepared<br />
by the Company in accordance with accounting principles<br />
generally accepted in the United States of America (“US<br />
GAAP”).<br />
NOTE 2.<br />
Summary of significant accounting<br />
policies<br />
Principles of consolidation<br />
These consolidated financial statements include the financial<br />
position and results of the Company, controlled<br />
subsidiaries of which the Company directly or indirectly<br />
owns more than 50% of the voting interest, unless minority<br />
stockholders have substantive participating rights, and<br />
variable interest entities where the Group is determined to<br />
be the primary beneficiary. Other significant investments<br />
in companies of which the Company directly or indirectly<br />
owns between 20% and 50% of the voting interest and<br />
over which it exercises significant influence but not control,<br />
are accounted for using the equity method of accounting.<br />
Investments in companies of which the Company directly<br />
or indirectly owns more than 50% of the voting interest but<br />
where minority stockholders have substantive participating<br />
rights are accounted for using the equity method of<br />
accounting. Undivided interests in oil and gas joint ventures<br />
are accounted for using the proportionate consolidation<br />
method. Investments in other companies are recorded<br />
at cost. Equity investments and investments in other<br />
companies are included in “Investments” in the consolidated<br />
balance sheet.<br />
Use of estimates<br />
The preparation of financial statements in conformity with<br />
US GAAP requires management to make estimates and<br />
assumptions that affect the reported amounts of assets<br />
and liabilities and disclosure of contingent assets and<br />
liabilities at the date of the financial statements, and the<br />
reported amounts of revenues and expenses during the reporting<br />
period. Significant items subject to such estimates<br />
and assumptions include the carrying value of oil and<br />
gas properties and other property, plant and equipment,<br />
goodwill impairment assessment, asset retirement obligations,<br />
deferred income taxes, valuation of financial instruments,<br />
and obligations related to employee benefits.<br />
Eventual actual amounts could differ from those estimates.<br />
Revenue<br />
Revenues are recognized when title passes to customers at<br />
which point the risks and rewards of ownership are assumed<br />
by the customer and the price is fixed or determinable.<br />
Revenues include excise on petroleum products sales and<br />
duties on export sales of crude oil and petroleum products.<br />
Revenues from non-cash sales are recognized at the fair<br />
market value of the crude oil and petroleum products sold.<br />
Foreign currency translation<br />
The Company maintains its accounting records in Russian<br />
rubles. The Company’s functional currency is the US dollar<br />
and the Group’s reporting currency is the US dollar.<br />
For the majority of operations in the Russian Federation and<br />
outside the Russian Federation, the US dollar is the functional<br />
currency. Where the US dollar is the functional currency,<br />
monetary assets and liabilities have been translated into<br />
US dollars at the rate prevailing at each balance sheet date.<br />
148
OAO LUKOIL Notes to Consolidated Financial Statements<br />
(Millions of US dollars, except as indicated)<br />
Non-monetary assets and liabilities have been translated<br />
into US dollars at historical rates. Revenues, expenses and<br />
cash flows have been translated into US dollars at rates which<br />
approximate actual rates at the date of the transaction.<br />
Translation differences resulting from the use of these rates<br />
are included in the consolidated statement of income.<br />
For certain other operations, where the US dollar is not<br />
the functional currency and the economy is not highly<br />
inflationary, assets and liabilities are translated into US dollars<br />
at year-end exchange rates and revenues and expenses<br />
are translated at average exchange rates for the year.<br />
Resulting translation adjustments are reflected as a separate<br />
component of comprehensive income.<br />
In all cases, foreign currency transaction gains and losses are<br />
included in the consolidated statement of income.<br />
As of December 31, 2011, 2010 and 2009, exchange rates<br />
of 32.20, 30.48 and 30.24 Russian rubles to the US dollar,<br />
respectively, have been used for translation purposes.<br />
Cash and cash equivalents<br />
Cash and cash equivalents include all highly liquid<br />
investments with an original maturity of three months<br />
or less.<br />
Cash with restrictions on immediate use<br />
Cash funds for which restrictions on immediate use exist are<br />
accounted for within other non-current assets.<br />
Accounts receivable<br />
Accounts receivable are recorded at their transaction<br />
amounts less provisions for doubtful debts. Provisions for<br />
doubtful debts are recorded to the extent that there is a<br />
likelihood that any of the amounts due will not be collected.<br />
Non-current receivables are discounted to the present value<br />
of expected cash flows in future periods using the original<br />
discount rate.<br />
Inventories<br />
The cost of finished goods and purchased products is<br />
determined using the first-in, first-out cost method (FIFO).<br />
The cost of all other inventory categories is determined using<br />
an “average cost” method.<br />
Investments<br />
Debt and equity securities are classified into one of three<br />
categories: trading, available-for-sale, or held-to-maturity.<br />
Trading securities are bought and held principally for the<br />
purpose of selling in the near term. Held-to-maturity securities<br />
are those securities in which a Group company has the<br />
ability and intent to hold until maturity. All securities not<br />
included in trading or held-to-maturity are classified as<br />
available-for-sale.<br />
Trading and available-for-sale securities are recorded at<br />
fair value. Held-to-maturity securities are recorded at cost,<br />
adjusted for the amortization or accretion of premiums or<br />
discounts. Unrealized holding gains and losses on trading<br />
securities are included in the consolidated statement of income.<br />
Unrealized holding gains and losses, net of the related<br />
tax effect, on available-for-sale securities are reported<br />
as a separate component of comprehensive income until<br />
realized. Realized gains and losses from the sale of availablefor-sale<br />
securities are determined on a specific identification<br />
basis. Dividends and interest income are recognized in the<br />
consolidated statement of income when earned.<br />
A permanent decline in the market value of any availablefor-sale<br />
or held-to-maturity security below cost is accounted<br />
for as a reduction in the carrying amount to fair value.<br />
The impairment is charged to the consolidated statement of<br />
income and a new cost base for the security is established.<br />
Premiums and discounts are amortized or accreted over<br />
the life of the related held-to-maturity or available-for-sale<br />
security as an adjustment to yield using the effective interest<br />
method and such amortization and accretion is recorded<br />
in the consolidated statement of income.<br />
Property, plant and equipment<br />
Oil and gas properties are accounted for using the successful<br />
efforts method of accounting whereby property acquisitions,<br />
successful exploratory wells, all development costs<br />
(including development dry holes and the Group’s share<br />
of operators’ expenses during the development stage of<br />
production sharing and risk service contracts), and support<br />
equipment and facilities are capitalized. Unsuccessful<br />
exploratory wells are expensed when a well is determined<br />
to be non-productive. Other exploratory expenditures, including<br />
geological and geophysical costs are expensed<br />
as incurred.<br />
The Group continues to capitalize costs of exploratory wells<br />
and exploratory-type stratigraphic wells for more than one<br />
year after the completion of drilling if the well has found<br />
a sufficient quantity of reserves to justify its completion as<br />
a producing well and the Company is making sufficient<br />
progress towards assessing the reserves and the economic<br />
and operating viability of the project. If these conditions<br />
are not met or if information that raises substantial<br />
doubt about the economic or operational viability of the<br />
149
OAO LUKOIL Notes to Consolidated Financial Statements<br />
(Millions of US dollars, except as indicated)<br />
project is obtained, the well would be assumed impaired,<br />
and its costs, net of any salvage value, would be charged to<br />
expense.<br />
Depreciation, depletion and amortization of capitalized<br />
costs of oil and gas properties is calculated using the unitof-production<br />
method based upon proved reserves for the<br />
cost of property acquisitions and proved developed reserves<br />
for exploration and development costs.<br />
Production and related overhead costs are expensed as<br />
incurred.<br />
Depreciation of assets not directly associated with oil production<br />
is calculated on a straight-line basis over the economic<br />
lives of such assets, estimated to be in the following ranges:<br />
Buildings and constructions 5–40 Years<br />
Machinery and equipment 5–20 Years<br />
In addition to production assets, certain Group companies<br />
also maintain and construct social assets for the use of local<br />
communities. Such assets are capitalized only to the extent<br />
that they are expected to result in future economic benefits<br />
to the Group. If capitalized, they are depreciated over their<br />
estimated economic lives.<br />
Significant unproved properties are assessed for impairment<br />
individually on a regular basis and any estimated impairment<br />
is charged to expense.<br />
Asset retirement obligations<br />
The Group records the fair value of liabilities related to its<br />
legal obligations to abandon, dismantle or otherwise retire<br />
tangible long-lived assets in the period in which the liability<br />
is incurred. A corresponding increase in the carrying amount<br />
of the related long-lived asset is also recorded. Subsequently,<br />
the liability is accreted for the passage of time and the related<br />
asset is depreciated using the unit-of-production method.<br />
Goodwill and other intangible assets<br />
Goodwill represents the excess of the cost of an acquired<br />
entity over the net of the fair value amounts assigned to<br />
assets acquired and liabilities assumed. It is assigned to<br />
reporting units as of the acquisition date. Goodwill is not<br />
amortized, but is tested for impairment at least on an<br />
annual basis and between annual tests if an event occurs<br />
or circumstances change that would more likely than not<br />
reduce the fair value of a reporting unit below its carrying<br />
amount. The impairment test requires estimating the fair<br />
value of a reporting unit and comparing it with its carrying<br />
amount, including goodwill assigned to the reporting unit.<br />
If the estimated fair value of the reporting unit is less than its<br />
net carrying amount, including goodwill, then the goodwill is<br />
written down to its implied fair value.<br />
Intangible assets with indefinite useful lives are tested for<br />
impairment at least annually. Intangible assets that have<br />
limited useful lives are amortized on a straight-line basis over<br />
the shorter of their useful or legal lives.<br />
Impairment of long-lived assets<br />
Long-lived assets, such as oil and gas properties (other than<br />
unproved properties), other property, plant, and equipment,<br />
and purchased intangibles subject to amortization,<br />
are assessed for impairment whenever events or changes<br />
in circumstances indicate that the carrying amount of an asset<br />
group may not be recoverable. Recoverability of assets<br />
to be held and used is measured by a comparison of the<br />
carrying amount of an asset group to the estimated undiscounted<br />
future cash flows expected to be generated by that<br />
group. If the carrying amount of an asset group exceeds its<br />
estimated undiscounted future cash flows, an impairment<br />
charge is recognized by writing down the carrying amount<br />
to the estimated fair value of the asset group, generally<br />
determined as discounted future net cash flows. Assets<br />
to be disposed of are separately presented in the balance<br />
sheet and reported at the lower of the carrying amount<br />
or fair value less costs to sell, and are no longer depreciated.<br />
The assets and liabilities of a disposed group classified as<br />
held for sale are presented separately in the appropriate asset<br />
and liability sections of the balance sheet.<br />
Income taxes<br />
Deferred income tax assets and liabilities are recognized<br />
in respect of future tax consequences attributable to<br />
temporary differences between the carrying amounts<br />
of existing assets and liabilities for the purposes of the<br />
consolidated financial statements and their respective<br />
tax bases and in respect of operating loss and tax credit<br />
carryforwards. Deferred income tax assets and liabilities<br />
are measured using enacted tax rates expected to apply<br />
to taxable income in the years in which those temporary<br />
differences are expected to reverse and the assets to be<br />
recovered and liabilities settled. The effect on deferred<br />
income tax assets and liabilities of a change in tax rates is<br />
recognized in the consolidated statement of income in the<br />
reporting period which includes the enactment date.<br />
The ultimate realization of deferred income tax assets is<br />
dependent upon the generation of future taxable income<br />
in the reporting periods in which the originating expenditure<br />
becomes deductible. In assessing the realizability<br />
150
OAO LUKOIL Notes to Consolidated Financial Statements<br />
(Millions of US dollars, except as indicated)<br />
of deferred income tax assets, management considers<br />
whether it is more likely than not that the deferred income<br />
tax assets will be realized. In making this assessment,<br />
management considers the scheduled reversal of deferred<br />
income tax liabilities, projected future taxable income,<br />
and tax planning strategies.<br />
An income tax position is recognized only if the uncertain<br />
position is more likely than not of being sustained upon<br />
examination, based on its technical merits. A recognized<br />
income tax position is measured at the largest amount<br />
that is greater than 50% likely of being realized. Changes<br />
in recognition or measurement are reflected in the period<br />
in which the change in judgment occurs. The Company<br />
records interest and penalties relating to income tax<br />
in income tax expense in the consolidated statements<br />
of income.<br />
Interest-bearing borrowings<br />
Interest-bearing borrowings from third parties (except<br />
convertible notes) are initially recorded at the value of net<br />
proceeds received. Any difference between the net proceeds<br />
and the redemption value is amortized at a constant rate<br />
over the term of the borrowing. Amortization is included in<br />
the consolidated statement of income and the carrying<br />
amounts are adjusted as amortization accumulates.<br />
For borrowings from related parties (except convertible<br />
notes) issued with an interest rate lower than the market<br />
interest rate, the Group determines book value using<br />
market interest rate. The resulting difference is allocated<br />
to additional paid-in capital and is amortized at a constant<br />
rate over the term of the borrowings. Amortization is included<br />
in the consolidated statement of income each year and<br />
the carrying amounts are adjusted as amortization<br />
accumulates.<br />
For convertible notes issued with a cash conversion option,<br />
the Group allocates the proceeds from issuance between<br />
a liability component and an equity component. The<br />
Group records the equity component at an amount equal<br />
to the difference between the proceeds received and the<br />
fair value of the liability component, measured as the fair<br />
value of a similar liability that does not have an associated<br />
equity component. The Group recognizes the interest cost<br />
in subsequent periods at its borrowing rate for nonconvertible<br />
debt.<br />
If borrowings are repurchased or settled before maturity,<br />
any difference between the amount paid and the carrying<br />
amount is recognized in the consolidated statement of<br />
income in the period in which the repurchase or settlement<br />
occurs.<br />
Pension benefits<br />
The expected costs in respect of pension obligations of<br />
Group companies are determined by an independent<br />
actuary. Obligations in respect of each employee are accrued<br />
over the reporting periods during which the employee<br />
renders service in the Group.<br />
The Group recognizes the funded status of the postretirement<br />
defined benefit plan in the consolidated balance<br />
sheet with corresponding adjustments to accumulated<br />
other comprehensive income. The adjustment to accumulated<br />
other comprehensive income represents the net unrecognized<br />
actuarial gains and unrecognized prior service<br />
costs. These amounts are subsequently recognized as<br />
net periodic benefit cost. Further, actuarial gains and losses<br />
that arise in subsequent periods and are not recognized<br />
as net periodic benefit cost in the same periods are recognized<br />
as a component of other comprehensive income. These<br />
amounts are subsequently recognized as a component<br />
of net periodic benefit cost on the same basis as the amounts<br />
recognized in accumulated other comprehensive income.<br />
Treasury stock<br />
Purchases by Group companies of the Company’s outstanding<br />
stock are recorded at cost and classified as treasury<br />
stock within Stockholders’ equity. Shares shown as<br />
Authorized and Issued include treasury stock. Shares shown<br />
as Outstanding do not include treasury stock.<br />
Earnings per share<br />
Basic earnings per share is computed by dividing net income<br />
available to common stockholders of the Company<br />
by the weighted-average number of shares of common<br />
stock outstanding during the reporting period. A calculation<br />
is carried out to establish if there is potential dilution<br />
in earnings per share if convertible securities were to be<br />
converted into shares of common stock or contracts to issue<br />
shares of common stock were to be exercised. If there is such<br />
dilution, diluted earnings per share is presented.<br />
Contingencies<br />
Certain conditions may exist as of the balance sheet date,<br />
which may result in losses to the Group but the impact of<br />
which will only be resolved when one or more future events<br />
occur or fail to occur.<br />
If a Group company’s assessment of a contingency indicates<br />
that it is probable that a material loss has been incurred<br />
and the amount of the liability can be estimated, then<br />
the estimated liability is accrued and charged to the con-<br />
151
OAO LUKOIL Notes to Consolidated Financial Statements<br />
(Millions of US dollars, except as indicated)<br />
solidated statement of income. If the assessment indicates<br />
that a potentially material loss is not probable, but is reasonably<br />
possible, or is probable, but cannot be estimated, then<br />
the nature of the contingent liability, together with an estimate<br />
of the range of possible loss, is disclosed in the notes to<br />
the consolidated financial statements. Loss contingencies<br />
considered remote or related to unasserted claims<br />
are generally not disclosed unless they involve guarantees,<br />
in which case the nature of the guarantee is disclosed.<br />
Environmental<br />
expenditures<br />
Estimated losses from environmental remediation obligations<br />
are generally recognized no later than completion<br />
of remedial feasibility studies. Group companies accrue<br />
for losses associated with environmental remediation<br />
obligations when such losses are probable and reasonably<br />
estimable. Such accruals are adjusted as further information<br />
becomes available or circumstances change. Costs<br />
of expected future expenditures for environmental remediation<br />
obligations are not discounted to their present value.<br />
Use of derivative<br />
instruments<br />
The Group’s derivative activity is limited to certain petroleum<br />
products marketing and trading operations and hedging<br />
of commodity price risks. Currently this activity involves<br />
the use of futures and swaps contracts together with purchase<br />
and sale contracts that qualify as derivative instruments.<br />
The Group accounts for these activities under the<br />
mark-to-market methodology in which the derivatives<br />
are revalued each accounting period. Resulting realized<br />
and unrealized gains or losses are presented in the consolidated<br />
statement of income on a net basis. Unrealized<br />
gains and losses are carried as assets or liabilities on the<br />
consolidated balance sheet.<br />
Share-based payments<br />
The Group accounts for liability classified share-based<br />
payment awards to employees at fair value on the date<br />
of grant and as of each reporting date. Expenses are<br />
recognized over the vesting period. Equity classified sharebased<br />
payment awards to employees are valued at fair<br />
value on the date of grant and expensed over the vesting<br />
period.<br />
Comparative amounts<br />
Certain prior period amounts have been reclassified to<br />
conform with the current period’s presentation.<br />
Changes in accounting<br />
policy<br />
In April 2011, the FASB issued Accounting Standards Update<br />
(“ASU”) No. 2011-02, “A Creditor’s Determination of Whether<br />
a Restructuring Is a Troubled Debt Restructuring,” which<br />
amends Topic 310 of the Codification. This ASU provides<br />
additional guidance in considering whether a restructuring<br />
constitutes a troubled debt restructuring and helps<br />
creditors in determining whether a creditor has granted<br />
a concession and whether a debtor is experiencing financial<br />
difficulties. ASU No. 2011-02 is effective starting from<br />
the first interim or annual period beginning on or after<br />
June 15, 2011. The Group adopted the requirements of<br />
ASU No. 2011-02 starting from the third quarter of 2011. This<br />
adoption did not have a material impact on the Group’s<br />
results of operations, financial position or cash flows and<br />
did not require additional disclosures.<br />
In January 2010, the FASB issued ASU No. 2010-06, “Improving<br />
Disclosures about Fair Value Measurements,” which<br />
requires reporting entities to make new disclosures about<br />
recurring or nonrecurring fair-value measurements including<br />
significant transfers into and out of Level 1 and Level 2<br />
fair-value measurements and to present separately<br />
information about purchases, sales, issuances, and settlements<br />
on a gross basis in the reconciliation of Level 3<br />
fair-value measurements. This ASU also clarifies existing<br />
fair-value measurement disclosure guidance about the<br />
level of disaggregation, inputs, and valuation techniques.<br />
The Group fully adopted the requirements of ASU<br />
No. 2010-06 starting from the first quarter of 2011. This<br />
adoption did not have a material impact on the Group’s<br />
results of operations, financial position or cash flows.<br />
Recent accounting<br />
pronouncements<br />
In December 2011, the FASB issued ASU No. 2011-12, “Deferral<br />
of the Effective Date for Amendments to the Presentation<br />
of Reclassifications of Items Out of Accumulated Other<br />
Comprehensive Income in Accounting Standards Update<br />
No. 2011-05.” This ASU defers changes that relate to the presentation<br />
to reclassification adjustments out of accumulated<br />
other comprehensive income in ASU No. 2011-05, “Presentation<br />
of Comprehensive Income,” until the FASB is able to<br />
reconsider those paragraphs. Entities should continue to<br />
report reclassifications out of accumulated other comprehensive<br />
income consistent with the presentation requirements<br />
in effect before ASU No. 2011-05. ASU No. 2011-12 is<br />
effective at the same time as the ASU No. 2011-05: for public<br />
entities for fiscal years, and interim periods within those<br />
years, beginning after December 15, 2011 and should be ap-<br />
152
OAO LUKOIL Notes to Consolidated Financial Statements<br />
(Millions of US dollars, except as indicated)<br />
plied retrospectively. The Group will apply the provisions of<br />
ASU No. 2011-12 starting from the first quarter of 2012 and<br />
does not expect any material impact on its results of operations,<br />
financial position or cash flows.<br />
In December 2011, the FASB issued ASU No. 2011-11,<br />
“Disclosures about Offsetting Assets and Liabilities.” This<br />
ASU requires entities to disclose information about offsetting<br />
and related arrangements to enable users of its financial<br />
statements to understand the effect of those arrangements<br />
on its financial position. The scope includes derivatives,<br />
sale and repurchase agreements and reverse sale<br />
and repurchase agreements, and securities borrowing and<br />
securities lending arrangements. ASU No. 2011-11 is effective<br />
for annual reporting periods on or after January 1, 2013,<br />
and interim periods within those annual periods, and<br />
should be applied retrospectively. The Group is evaluating<br />
the effect of the adoption of ASU No. 2011-11 and does not<br />
expect any material impact on its results of operations, financial<br />
position or cash flows.<br />
In September 2011, the FASB issued ASU No. 2011-08, “Testing<br />
Goodwill for Impairment,” which allows an entity to use a<br />
qualitative approach to test goodwill for impairment. This<br />
ASU permits an entity to first assess qualitative factors to<br />
determine whether it is more likely than not that the fair<br />
value of a reporting unit is less than its carrying amount<br />
and hence whether it is necessary to perform the two-step<br />
goodwill impairment test as required by the provisions of<br />
Topic 350 of the Codification. ASU No. 2011-08 is effective<br />
for annual and interim goodwill impairment tests performed<br />
for the fiscal years beginning after December 15, 2011.<br />
The Group will apply the provisions of ASU No. 2011-08<br />
starting from the first quarter of 2012 and does not expect<br />
any material impact on its results of operations, financial<br />
position or cash flows.<br />
In June 2011, the FASB issued ASU No. 2011-05, “Presentation<br />
of comprehensive income,” which amends Topic 220 of the<br />
Codification. This ASU increases the prominence of other<br />
comprehensive income in financial statements. Under this<br />
ASU, an entity will have the option to present the components<br />
of net income and comprehensive income in either<br />
one or two statements. The ASU eliminates the option in US<br />
GAAP to present other comprehensive income in the statement<br />
of changes in equity. ASU No. 2011-05 is effective for<br />
public entities for fiscal years, and interim periods within<br />
those years, beginning after December 15, 2011 and should<br />
be applied retrospectively. The Group will apply the provisions<br />
of ASU No. 2011-05 starting from the first quarter of<br />
2012.<br />
In May 2011, the FASB issued ASU No. 2011-04, “Amendments<br />
to Achieve Common Fair Value Measurement and Disclosure<br />
Requirements in US GAAP and IFRSs,” which amends<br />
Topic 820 of the Codification. This ASU provides guidance<br />
for fair value measurements and disclosure requirements<br />
and clarifies the Board’s intent about the application of existing<br />
fair value measurement requirements. The new standard<br />
does not extend the use of fair value but, rather, provides<br />
guidance about how fair value should be applied<br />
where it already is required or permitted under US GAAP.<br />
ASU No. 2011-04 is effective for public entities during interim<br />
and annual periods beginning after December 15, 2011<br />
and should be applied prospectively. The Group will apply<br />
the provisions of ASU No. 2011-04 starting from the first<br />
quarter of 2012 and does not expect any material impact<br />
on its results of operations, financial position or cash flows.<br />
153
OAO LUKOIL Notes to Consolidated Financial Statements<br />
(Millions of US dollars, except as indicated)<br />
NOTE 3.<br />
Cash and cash equivalents<br />
As of December<br />
31, 2011<br />
As of December<br />
31, 2010<br />
Cash held in Russian rubles 1,152 367<br />
Cash held in US dollars 1,224 1,259<br />
Cash held in other currencies 271 418<br />
Cash held in related party banks in Russian rubles 83 320<br />
Cash held in related party banks in other currencies 23 4<br />
Total cash and cash equivalents 2,753 2,368<br />
NOTE 4.<br />
non-cash transactions<br />
The consolidated statement of cash flows excludes the effect of non-cash transactions, which are described in the following<br />
table:<br />
Year ended<br />
December<br />
31, 2011<br />
Year ended<br />
December<br />
31, 2010<br />
Year ended<br />
December<br />
31, 2009<br />
Non-cash investing activity 6 67 20<br />
Non-cash acquisitions – – 100<br />
Total non-cash transactions 6 67 120<br />
The following table shows the effect of non-cash transactions on investing activity:<br />
Year ended<br />
December<br />
31, 2011<br />
Year ended<br />
December<br />
31, 2010<br />
Year ended<br />
December<br />
31, 2009<br />
Net cash used in investing activity 10,773 7,296 8,551<br />
Non-cash acquisitions – – 100<br />
Non-cash investing activity 6 67 20<br />
Total investing activity 10,779 7,363 8,671<br />
NOTE 5.<br />
Accounts receivable, net<br />
As of December<br />
31, 2011<br />
As of December<br />
31, 2010<br />
Trade accounts receivable (net of provisions of $179 million and $182 million<br />
as of December 31, 2011 and 2010, respectively) 7,209 6,748<br />
Current VAT and excise recoverable 1,333 1,149<br />
Other current accounts receivable (net of provisions of $54 million and $50 million<br />
as of December 31, 2011 and 2010, respectively) 379 322<br />
Total accounts receivable, net 8,921 8,219<br />
154
OAO LUKOIL Notes to Consolidated Financial Statements<br />
(Millions of US dollars, except as indicated)<br />
NOTE 6.<br />
Inventories<br />
As of December<br />
31, 2011<br />
As of December<br />
31, 2010<br />
Crude oil and petroleum products 6,265 5,093<br />
Materials for extraction and drilling 321 356<br />
Materials and supplies for refining 57 37<br />
Other goods, materials and supplies 890 745<br />
Total inventories 7,533 6,231<br />
NOTE 7.<br />
Investments<br />
As of December<br />
31, 2011<br />
As of December<br />
31, 2010<br />
Investments in equity method affiliates and joint ventures 4,887 4,529<br />
Long-term loans to equity method affiliates and joint ventures 1,001 990<br />
Other long-term investments 64 118<br />
Total long-term investments 5,952 5,637<br />
Investments in “equity method” affiliates and joint<br />
ventures<br />
The summarized financial information below is in respect<br />
of equity method affiliates and corporate joint ventures.<br />
The companies are primarily engaged in crude oil exploration,<br />
production, marketing and distribution operations<br />
in the Russian Federation, crude oil production and marketing<br />
in Kazakhstan, and refining operations in Europe.<br />
Year ended<br />
December 31, 2011<br />
Total<br />
Group’s<br />
share<br />
Year ended<br />
December 31, 2010<br />
Total<br />
Group’s<br />
share<br />
Year ended<br />
December 31, 2009<br />
Total<br />
Group’s<br />
share<br />
Revenues 32,770 4,777 24,348 3,672 5,139 2,275<br />
Income before income taxes 13,832 1,005 9,187 675 1,305 478<br />
Less income taxes (4,241) (315) (2,682) (203) (407) (127)<br />
Net income 9,591 690 6,505 472 898 351<br />
155
OAO LUKOIL Notes to Consolidated Financial Statements<br />
(Millions of US dollars, except as indicated)<br />
Total<br />
As of December<br />
31, 2011<br />
Group’s<br />
Share<br />
Total<br />
As of December<br />
31, 2010<br />
Group’s<br />
Share<br />
Current assets 7,379 1,406 7,462 1,359<br />
Property, plant and equipment 19,064 5,587 18,053 5,099<br />
Other non-current assets 1,454 462 989 350<br />
Total assets 27,897 7,455 26,504 6,808<br />
Short-term debt 1,100 223 701 57<br />
Other current liabilities 3,703 668 2,844 551<br />
Long-term debt 7,461 1,069 7,809 1,079<br />
Other non-current liabilities 1,581 608 1,805 592<br />
Net assets 14,052 4,887 13,345 4,529<br />
In April 2011, the Company and OAO ANK Bashneft signed an<br />
agreement to establish a joint venture and to develop two<br />
oil fields named after R.Trebs and A.Titov, located in the<br />
Nenets Autonomous District of Russia. According to the<br />
agreement, the mineral rights for the development of the<br />
fields were re-issued by OAO ANK Bashneft in favor of its<br />
100% subsidiary OOO Bashneft-Polus. In December 2011,<br />
the Company acquired 25.1% of OOO Bashneft-Polus for<br />
approximately $153 million, and OOO Bashneft-Polus<br />
acquired 29 exploration wells located on these fields from<br />
a Group company for $60 million. The parties agreed to<br />
transport oil extracted from the fields via the Group’s transportation<br />
infrastructure and to consider the exploitation<br />
of certain other nearby infrastructure owned by the Group.<br />
In April 2011, the Group acquired an additional 11% interest<br />
in the joint venture which operates the ISAB refining complex<br />
(Priolo, Italy) for approximately €241 million ($342 million).<br />
The acquisition was based on an option, which was<br />
partially executed in accordance with the initial agreement<br />
on the establishment of the joint venture signed in 2008.<br />
This agreement gave the second investor – ERG S.p.A. (“ERG”)<br />
a step-by-step put option to sell its remaining share in the<br />
joint venture to the Group. As a result the Group’s interest<br />
in the joint venture was increased from 49% to 60%. Based<br />
on the agreement, ERG and the Company still have equal<br />
participation rights. Therefore the Group continues to use<br />
the equity method of accounting for this joint venture. In<br />
January 2012, the Group received a notice that the Board<br />
of Directors of ERG decided to exercise its option to sell to<br />
the Group a further 20% interest in the joint venture. The<br />
transaction is expected to be finalized in the second quarter<br />
of 2012 in the amount of €400 million ($526 million), excluding<br />
inventory. Thus, the Group’s stake in the joint venture<br />
will be increased from 60% to 80% and the Group will then<br />
obtain control.<br />
156
OAO LUKOIL Notes to Consolidated Financial Statements<br />
(Millions of US dollars, except as indicated)<br />
NOTE 8.<br />
Property, plant and equipment and asset retirement obligations<br />
Exploration and Production:<br />
As of December<br />
31, 2011<br />
At cost<br />
As of December<br />
31, 2010<br />
As of December<br />
31, 2011<br />
Net<br />
As of December<br />
31, 2010<br />
Russia 54,269 51,797 34,415 32,973<br />
International 8,138 7,114 6,376 5,624<br />
Total 62,407 58,911 40,791 38,597<br />
Refining, Marketing, Distribution<br />
and Chemicals:<br />
Russia 12,133 11,062 7,395 7,208<br />
International 6,903 6,883 4,282 4,511<br />
Total 19,036 17,945 11,677 11,719<br />
Power generation and other:<br />
Russia 4,890 4,589 4,026 3,970<br />
International 406 440 309 343<br />
Total 5,296 5,029 4,335 4,313<br />
Total property, plant and equipment 86,739 81,885 56,803 54,629<br />
The Company performs a regular annual impairment test<br />
of its assets. The test is based on geological models and<br />
development programs, which are revised on a regular<br />
basis at least annually. The fair value of tested assets is determined<br />
using the present value of the expected cash flows.<br />
Fair value measurements models used in the impairment<br />
tests were Level 3 (unobservable inputs) fair value<br />
measurements.<br />
In 2005, the Company and ConocoPhillips formed a joint<br />
venture on the basis of OOO Narianmarneftegaz (“NMNG”),<br />
a Group subsidiary. The purpose of the joint venture is<br />
to develop oil reserves in the Timan-Pechora region of<br />
the Russian Federation (refer to Note 17. Consolidation<br />
of Variable Interest Entity). In 2008, NMNG started crude oil<br />
production on the Yuzhnoye Khylchuyu oil field, the major<br />
field of the joint venture. As of December 31, 2008, proved<br />
oil reserves on this oil field were estimated to be approximately<br />
505 million barrels. During 2010, oil production start-<br />
ed to fall below expected levels due to a number of unanticipated<br />
geological reasons. As of December 31, 2011, proved<br />
oil reserves were estimated to be approximately<br />
142 million barrels. During the year ended December 31,<br />
2011, the Company recognized an impairment loss on<br />
NMNG’s exploration and production assets in the total<br />
amount of $1,175 million.<br />
Additionally during the year ended December 31, 2011,<br />
the Company recognized an impairment loss of $175 million<br />
for assets related to international refining, marketing and<br />
distribution segment.<br />
During the year ended December 31, 2010, the Company<br />
recognized an impairment loss of $164 million for its exploration<br />
and production assets in the Western Siberia,<br />
Timan-Pechora and Central European regions of Russia<br />
and $29 million for international marketing and distribution<br />
assets.<br />
157
OAO LUKOIL Notes to Consolidated Financial Statements<br />
(Millions of US dollars, except as indicated)<br />
The following tables set out values of property, plant and equipment measured at fair value on a nonrecurring basis in periods<br />
subsequent to their initial recognition:<br />
Fair value<br />
Level 3<br />
fair value measurements Before-tax loss<br />
Year ended December 31, 2011<br />
Property, plant and equipment 1,195 1,195 1,350<br />
Year ended December 31, 2010<br />
Property, plant and equipment 120 120 193<br />
As of December 31, 2011 and 2010, the asset retirement obligations amounted to $2,126 million and $1,798 million, respectively,<br />
of which $6 million and $10 million was included in “Other current liabilities” in the consolidated balance sheets<br />
as of each balance sheet date.<br />
During 2011 and 2010, asset retirement obligations changed as follows:<br />
2011 2010<br />
Asset retirement obligations as of January 1 1,798 1,199<br />
Accretion expense 158 124<br />
New obligations 172 190<br />
Changes in estimates of existing obligations 173 314<br />
Spending on existing obligations (5) (6)<br />
Property dispositions (5) (4)<br />
Foreign currency translation and other adjustments (165) (19)<br />
Asset retirement obligations as of December 31 2,126 1,798<br />
The asset retirement obligations incurred during 2011 and 2010 were Level 3 (unobservable inputs) fair value measurements.<br />
NOTE 9.<br />
Suspended wells<br />
Net changes in capitalized exploratory suspended wells during 2011, 2010 and 2009 were as follows:<br />
2011 2010 2009<br />
Balance as of January 1 405 406 337<br />
Additions pending the determination<br />
of proved reserves 97 156 124<br />
Charged to expenses – (94) (36)<br />
Reclassification to proved properties (33) (63) (19)<br />
Balance as of December 31 469 405 406<br />
158
OAO LUKOIL Notes to Consolidated Financial Statements<br />
(Millions of US dollars, except as indicated)<br />
Aging of capitalized suspended exploratory well costs were as follows:<br />
Exploratory well costs capitalized<br />
As of<br />
December<br />
31, 2011<br />
As of<br />
December<br />
31, 2010<br />
As of<br />
December<br />
31, 2009<br />
for a period of one year or less 78 148 124<br />
for two years 144 72 122<br />
for three years 72 89 86<br />
for four years 82 82 58<br />
for five years or more 93 14 16<br />
for a period of greater than one year 391 257 282<br />
Total exploratory well costs capitalized 469 405 406<br />
Number of projects that have exploratory well costs capitalized<br />
for a period greater than one year 14 11 15<br />
Aging of the exploratory wells that have been capitalized for more than one year since completion of drilling as<br />
of December 31, 2011:<br />
Project name (field name)<br />
Location<br />
As of December<br />
31, 2011 Years wells drilled<br />
Block A Saudi Arabia 255 2007-2010<br />
Cape Three Points Deep Water Ghana 92 2010<br />
Aral Uzbekistan 5 2010<br />
Vinnikovskoe European Russia 7 2008-2010<br />
Centralno-Astrakhanskoe European Russia 6 2008-2009<br />
Gabishevskoe European Russia 5 2008-2009<br />
8 projects of less than $4 million each European Russia 21 2004-2010<br />
Total of 14 projects 391<br />
Capitalized exploratory well costs of $255 million are related<br />
to two fields in the Block A area in Saudi Arabia, represented<br />
by four wells drilled in 2007-2010. The wells were suspended<br />
pending final assessment of the operational and economic<br />
viability of the project. During 2011, to assess the required<br />
technology for the development and extraction of the tight<br />
gas reservoirs, the Group engaged an international engineering<br />
survey company to evaluate recompletion options<br />
for the wells, to prove the commercialization potential<br />
of the appraisal area and to optimize the stimulation technology<br />
for its development. These evaluations were completed<br />
in December 2011. As a result of these evaluations,<br />
the Group will submit an implementation plan for conside-<br />
ration and approval by the Saudi Arabian Government.<br />
A decision is expected during 2012.<br />
Capitalized exploratory well costs of $92 million related<br />
to block “Cape Three Points Deep Water” in Ghana are represented<br />
by one exploratory well. During 2011, an appraisal<br />
well was drilled, but it was found unsuccessful and was<br />
written off. Currently the Group plans to continue evaluating<br />
the development plan for this project and the second<br />
appraisal well will be drilled in 2012.<br />
The Company is evaluating the development plans for other<br />
projects.<br />
159
OAO LUKOIL Notes to Consolidated Financial Statements<br />
(Millions of US dollars, except as indicated)<br />
NOTE 10.<br />
Goodwill and other intangible assets<br />
The carrying value of goodwill and other intangible assets as of December 31, 2011 and 2010 was as follows:<br />
Amortized intangible assets<br />
As of December<br />
31, 2011<br />
As of December<br />
31, 2010<br />
Software 389 391<br />
Licenses and other assets 343 409<br />
Goodwill 612 646<br />
Total goodwill and other intangible assets 1,344 1,446<br />
During the year ended December 31, 2011, the Company recognized an impairment of goodwill related to the refining,<br />
marketing and distribution segment.<br />
NOTE 11.<br />
Short-term borrowings and current portion of long-term debt<br />
As of December<br />
31, 2011<br />
As of December<br />
31, 2010<br />
Short-term borrowings from third parties 118 728<br />
Short-term borrowings from related parties 30 66<br />
Current portion of long-term debt 1,644 1,331<br />
Total short-term borrowings and current portion of long-term debt 1,792 2,125<br />
Short-term borrowings from third parties are unsecured and<br />
include amounts repayable in US dollars of $56 million and<br />
$609 million, amounts repayable in Euros of $17 million and<br />
$29 million, amounts repayable in other currencies of $45<br />
million and $90 million as of December 31, 2011 and 2010,<br />
respectively. The weighted-average interest rate on shortterm<br />
borrowings from third parties was 4.93% and 1.87% per<br />
annum as of December 31, 2011 and 2010, respectively.<br />
160
OAO LUKOIL Notes to Consolidated Financial Statements<br />
(Millions of US dollars, except as indicated)<br />
NOTE 12.<br />
Long-term debt<br />
As of December<br />
31, 2011<br />
As of December<br />
31, 2010<br />
Long-term loans and borrowings from third parties<br />
(including loans from banks in the amount of $1,120 million<br />
and $2,071 million as of December 31, 2011 and 2010, respectively) 2,652 3,764<br />
6.375% non-convertible US dollar bonds, maturing 2014 897 896<br />
2.625% convertible US dollar bonds, maturing 2015 1,412 1,388<br />
6.356% non-convertible US dollar bonds, maturing 2017 500 500<br />
7.250% non-convertible US dollar bonds, maturing 2019 596 595<br />
6.125% non-convertible US dollar bonds, maturing 2020 998 998<br />
6.656% non-convertible US dollar bonds, maturing 2022 500 500<br />
7.10% Russian ruble bonds, maturing 2011 – 262<br />
13.35% Russian ruble bonds, maturing 2012 776 820<br />
9.20% Russian ruble bonds, maturing 2012 311 328<br />
7.40% Russian ruble bonds, maturing 2013 186 197<br />
Capital lease obligations 116 152<br />
Total long-term debt 8,944 10,400<br />
Current portion of long-term debt (1,644) (1,331)<br />
Total non-current portion of long-term debt 7,300 9,069<br />
Long-term loans and borrowings<br />
Long-term loans and borrowings from third parties include<br />
amounts repayable in US dollars of $834 million and $1,707<br />
million, amounts repayable in Euros of $284 million and<br />
$369 million, amounts repayable in Russian rubles of $1,514<br />
million and $1,667 million, and amounts repayable in other<br />
currencies of $20 million and $21 million as of December 31,<br />
2011 and 2010, respectively. This debt has maturity dates<br />
from 2012 through 2038. The weighted-average interest rate<br />
on long-term loans and borrowings from third parties was<br />
5.39% and 4.50% per annum as of December 31, 2011 and<br />
2010, respectively. A number of long-term loan agreements<br />
contain certain financial covenants which are being met by<br />
the Group. Approximately 10% of total long-term loans and<br />
borrowings from third parties are secured by export sales<br />
and property, plant and equipment.<br />
A Group company has an unsecured syndicated loan agreement<br />
with an outstanding amount of $315 million as of<br />
December 31, 2011, with maturity dates up to 2013. The loan<br />
was arranged by ABN AMRO Bank, Banco Bilbao Vizcaya<br />
Argentaria, BNP Paribas, The Bank of Tokyo-Mitsubishi UFJ,<br />
ING Bank, Mizuho Corporate Bank and WestLB. Borrowings<br />
under this agreement bear interest from three month LIBOR<br />
plus 0.85% to three month LIBOR plus 0.95% per annum.<br />
The Company has an unsecured syndicated loan agreement<br />
with the European Bank for Reconstruction and Development<br />
with an outstanding amount of $173 million as of<br />
December 31, 2011, maturing up to 2017. Borrowings under<br />
this agreement bear interest from six month LIBOR plus<br />
0.45% to six month LIBOR plus 0.65% per annum.<br />
A Group company has a secured loan agreement, arranged<br />
by Credit Suisse, supported by an Overseas Private Investment<br />
Corporation guarantee, with an outstanding amount<br />
of $136 million as of December 31, 2011. Borrowings under<br />
this agreement bear interest at six month LIBOR plus 4.8%<br />
per annum and have maturity dates up to 2015.<br />
A Group company has an unsecured loan agreement with<br />
Citibank with an outstanding amount of $102 million as of<br />
December 31, 2011, maturing up to 2019. Borrowings under<br />
this agreement bear interest at euribor plus 0.125% per<br />
annum.<br />
Group companies have a number of loan agreements<br />
denominated in Russian rubles with ConocoPhillips, the<br />
Group’s former related party, with an outstanding amount<br />
of $1,508 million as of December 31, 2011. This amount includes<br />
$1,335 million loaned by ConocoPhillips to NMNG<br />
(refer to Note 17. Consolidation of Variable Interest Entity).<br />
161
OAO LUKOIL Notes to Consolidated Financial Statements<br />
(Millions of US dollars, except as indicated)<br />
Borrowings under these agreements bear interest at fixed<br />
rates ranging from 6.8% to 8.0% per annum and have maturity<br />
dates up to 2038. Financing under these agreements<br />
is used to develop oil production and distribution infrastructure<br />
in the Timan-Pechora region of the Russian Federation.<br />
As of December 31, 2011, the Group has a number of other<br />
loan agreements with fixed rates with a number of banks<br />
and other organizations totaling $78 million, maturing from<br />
2012 to 2017. The weighted average interest rate under these<br />
loans was 4.17% per annum.<br />
As of December 31, 2011, the Group has a number of other<br />
floating rate loan agreements with a number of banks and<br />
other organizations totaling $340 million, maturing from<br />
2012 to 2018. The weighted average interest rate under these<br />
loans was 1.78% per annum.<br />
US dollar convertible bonds<br />
In December 2010, a Group company issued unsecured convertible<br />
bonds totaling $1.5 billion with a coupon yield of<br />
2.625% and maturity in June 2015. The bonds were placed at<br />
face value. The bonds are convertible into LUKOIL ADRs (each<br />
representing one ordinary share of the Company) and have<br />
a conversion price of $73.3912 per ADR. Bondholders have<br />
the right to convert the bonds into LUKOIL ADRs during the<br />
period starting from 40 days after the issue date and ending<br />
6 dealing days before the maturity date. The issuer has the<br />
right to redeem the bonds after December 31, 2013.<br />
US dollar non-convertible bonds<br />
In November 2010, a Group company issued two tranches<br />
of non-convertible bonds totaling $1.0 billion with a coupon<br />
yield of 6.125% and maturity in 2020. The first tranche<br />
totaling $800 million was placed at a price of 99.081% of the<br />
bond’s face value with a resulting yield to maturity of 6.250%.<br />
The second tranche totaling $200 million was placed at a<br />
price of 102.44% of the bond’s face value with a resulting<br />
yield to maturity of 5.80%. These tranches have a half year<br />
coupon period.<br />
In November 2009, a Group company issued two tranches<br />
of non-convertible bonds totaling $1.5 billion. The first<br />
tranche totaling $900 million with a coupon yield of 6.375%<br />
per annum was placed with a maturity of 5 years at a price<br />
of 99.474% of the bond’s face value with a resulting yield to<br />
maturity of 6.500%. The second tranche totaling $600 million<br />
with a coupon yield of 7.250% per annum was placed<br />
with a maturity of 10 years at a price of 99.127% of the bond’s<br />
face value with a resulting yield to maturity of 7.375%. These<br />
tranches have a half year coupon period.<br />
In June 2007, a Group company issued non-convertible<br />
bonds totaling $1 billion. $500 million were placed with a maturity<br />
of 10 years and a coupon yield of 6.356% per annum.<br />
Another $500 million were placed with a maturity of 15 years<br />
and a coupon yield of 6.656% per annum. All bonds were<br />
placed at their face value and have a half year coupon period.<br />
Russian ruble bonds<br />
In December 2009, the Company issued 10 million stock<br />
exchange bonds with a face value of 1,000 Russian rubles<br />
each. The bonds were placed at face value with a maturity<br />
of 1,092 days. The bonds have a 182 days’ coupon period and<br />
bear interest at 9.20% per annum.<br />
In August 2009, the Company issued 25 million stock exchange<br />
bonds with a face value of 1,000 Russian rubles each.<br />
The bonds were placed at face value with a maturity of 1,092<br />
days. The bonds have a 182 days’ coupon period and bear interest<br />
at 13.35% per annum.<br />
In December 2006, the Company issued 14 million nonconvertible<br />
bonds with a face value of 1,000 Russian rubles<br />
each. Eight million bonds were placed with a maturity<br />
of 5 years and a coupon yield of 7.10% per annum and six<br />
million bonds were placed with a maturity of 7 years and<br />
a coupon yield of 7.40% per annum. All bonds were placed<br />
at their face value and have a half year coupon period.<br />
In December 2011, the Company redeemed all issued bonds<br />
with a maturity of five years in accordance with the conditions<br />
of bond issue.<br />
Maturities of long-term debt<br />
Annual maturities of total long-term debt during the next<br />
five years, including the portion classified as current, are<br />
$1,644 million in 2012, $512 million in 2013, $1,092 million in<br />
2014, $1,551 million in 2015, $95 million in 2016 and $4,050<br />
million thereafter.<br />
NOTE 13.<br />
Taxes<br />
The Group is taxable in a number of jurisdictions within<br />
and outside of the Russian Federation and, as a result, is subject<br />
to a variety of taxes as established under the statutory<br />
provisions of each jurisdiction.<br />
The total cost of taxation to the Group is reported in the consolidated<br />
statement of income as “Total income tax expense”<br />
for income taxes, as “Excise and export tariffs” for excise<br />
taxes, export tariffs and petroleum products sales taxes and<br />
162
OAO LUKOIL Notes to Consolidated Financial Statements<br />
(Millions of US dollars, except as indicated)<br />
as “Taxes other than income taxes” for other types of taxation.<br />
In each category taxation is made up of taxes levied at<br />
various rates in different jurisdictions.<br />
Starting on January 1, 2009, operations in the Russian<br />
Federation are subject to a Federal income tax rate of 2.0%<br />
and a regional income tax rate that varies from 13.5% to<br />
18.0% at the discretion of the individual regional administration.<br />
The Group’s foreign operations are subject to taxes<br />
at the tax rates applicable to the jurisdictions in which<br />
they operate.<br />
As of January 1, 2011 and 2010, and during 2011, 2010 and<br />
2009, the Group did not have any unrecognized tax benefits<br />
and thus, no interest and penalties related to unrecognized<br />
tax benefits were accrued. The Group’s policy is to record<br />
interest and penalties related to unrecognized tax benefits<br />
as components of income tax expense. In addition, the<br />
Group does not expect that the amount of unrecognized tax<br />
benefits will change significantly within the next 12 months.<br />
The Company and its Russian subsidiaries file standalone<br />
income tax returns in Russia. With a few exceptions, income<br />
tax returns in Russia are open to examination by the Russian<br />
tax authorities for tax years beginning in 2009.<br />
Until January 1, 2012, there were no provisions in the tax<br />
legislation of the Russian Federation to permit the Group<br />
to reduce taxable profits of a Group company by offsetting<br />
tax losses of another Group company against such profits.<br />
Tax losses may be fully or partially used to offset taxable<br />
profits in the same company in any of the ten years following<br />
the year of loss.<br />
Starting from January 1, 2012, if certain conditions are met,<br />
taxpayers will be able to pay income tax as a consolidated<br />
taxpayers’ group (“CTG”). This allows taxpayers to offset<br />
taxable losses generated by certain participants of a CTG<br />
against taxable profits of other participants of the CTG.<br />
During 2012, certain Group companies are going to meet<br />
the legislative requirements and pay income tax as a CTG.<br />
Losses generated by a taxpayer before joining a CTG are<br />
not available for offset against taxable profits of other participants<br />
of the CTG. However, if a taxpayer leaves a CTG,<br />
such losses again become available for offset against future<br />
profits generated by the same taxpayer. The expiration period<br />
of the losses is extended to take account of any time spent<br />
within a CTG when the losses were unavailable for use.<br />
Domestic and foreign components of income before income taxes were:<br />
Year ended<br />
December<br />
31, 2011<br />
Year ended<br />
December<br />
31, 2010<br />
Year ended<br />
December<br />
31, 2009<br />
Domestic 12,561 10,569 9,013<br />
Foreign 558 901 50<br />
Income before income taxes 13,119 11,470 9,063<br />
Domestic and foreign components of income taxes were:<br />
Year ended<br />
December<br />
31, 2011<br />
Year ended<br />
December<br />
31, 2010<br />
Year ended<br />
December<br />
31, 2009<br />
Current<br />
Domestic 2,159 1,693 1,677<br />
Foreign 519 411 245<br />
Current income tax expense 2,678 2,104 1,922<br />
Deferred<br />
Domestic 581 299 98<br />
Foreign 34 (52) (26)<br />
Deferred income tax expense 615 247 72<br />
Total income tax expense 3,293 2,351 1,994<br />
163
OAO LUKOIL Notes to Consolidated Financial Statements<br />
(Millions of US dollars, except as indicated)<br />
The following table is a reconciliation of the amount of income tax expense that would result from applying the Russian<br />
combined statutory income tax rate of 20% applicable to the Company to income before income taxes to total income taxes:<br />
Year ended<br />
December<br />
31, 2011<br />
Year ended<br />
December<br />
31, 2010<br />
Year ended<br />
December<br />
31, 2009<br />
Income before income taxes 13,119 11,470 9,063<br />
Notional income tax at the Russian statutory rate 2,624 2,294 1,813<br />
Increase (reduction) in income tax due to:<br />
Non-deductible items, net 693 266 252<br />
Foreign rate differences 169 (4) 68<br />
Domestic regional rate differences (328) (226) (251)<br />
Change in valuation allowance 135 21 112<br />
Total income tax expense 3,293 2,351 1,994<br />
Taxes other than income taxes were:<br />
Year ended<br />
December<br />
31, 2011<br />
Year ended<br />
December<br />
31, 2010<br />
Year ended<br />
December<br />
31, 2009<br />
Mineral extraction tax 11,594 7,864 5,452<br />
Social taxes and contributions 587 429 399<br />
Property tax 573 518 470<br />
Other taxes and contributions 164 167 153<br />
Taxes other than income taxes 12,918 8,978 6,474<br />
Deferred income taxes are included in the consolidated balance sheets as follows:<br />
As of<br />
December<br />
31, 2011<br />
As of<br />
December<br />
31, 2010<br />
Other current assets 127 77<br />
Deferred income tax assets – non-current 591 676<br />
Other current liabilities (216) (85)<br />
Deferred income tax liabilities – non-current (2,790) (2,417)<br />
Net deferred income tax liability (2,288) (1,749)<br />
164
OAO LUKOIL Notes to Consolidated Financial Statements<br />
(Millions of US dollars, except as indicated)<br />
The following tables set out the tax effects of each type of temporary differences which give rise to deferred income tax assets<br />
and liabilities:<br />
As of<br />
December<br />
31, 2011<br />
As of<br />
December<br />
31, 2010<br />
Accounts receivable 5 42<br />
Long-term liabilities 398 387<br />
Inventories 13 1<br />
Property, plant and equipment 207 263<br />
Accounts payable 5 14<br />
Operating loss carry forwards 646 527<br />
Other 229 161<br />
Total gross deferred income tax assets 1,503 1,395<br />
Less valuation allowance (553) (418)<br />
Deferred income tax assets 950 977<br />
Property, plant and equipment (2,870) (2,513)<br />
Accounts payable (39) (2)<br />
Accounts receivable (91) (30)<br />
Long-term liabilities (38) (61)<br />
Inventories (63) (57)<br />
Investments (33) (15)<br />
Other (104) (48)<br />
Deferred income tax liabilities (3,238) (2,726)<br />
Net deferred income tax liability (2,288) (1,749)<br />
As a result of acquisitions during 2011 the Group recognized<br />
a net deferred tax liability of $34 million.<br />
As of December 31, 2011, retained earnings of foreign subsidiaries<br />
included $17,398 million for which deferred taxation<br />
has not been provided because remittance of the earnings<br />
has been indefinitely postponed through reinvestment<br />
and, as a result, such amounts are considered to be indefinitely<br />
invested. It is not practicable to estimate the amount<br />
of additional taxes that might be payable on such undistributed<br />
earnings.<br />
In accordance with Topic 830, “Foreign currency matters”<br />
of the Codification and Topic 740, “Income Taxes” of the<br />
Codification deferred tax assets and liabilities are not recognized<br />
for the changes in exchange rate effects resulting<br />
from the translation of transactions and balances from the<br />
Russian ruble to the US dollar using historical exchange rates.<br />
Also, in accordance with Topic 740 of the Codification, no<br />
deferred tax assets or liabilities are recognized for the<br />
effects of the related statutory indexation of property, plant<br />
and equipment.<br />
Based upon the levels of historical taxable income and projections<br />
for future taxable income over the periods in which<br />
the deferred income tax assets are deductible, management<br />
believes it is more likely than not that Group companies<br />
will realize the benefits of the deductible temporary<br />
differences and loss carry forwards, net of existing valuation<br />
allowances as of December 31, 2011 and 2010.<br />
As of December 31, 2011, the Group had operating loss carry<br />
forwards of $2,189 million of which $24 million expire during<br />
2012, $124 million expire during 2013, $2 million expire<br />
during 2014, $3 million expire during 2015, $250 million<br />
expire during 2016, $22 million expire during 2017, $80<br />
million expire during 2018, $3 million expire during<br />
2019, $3 million expire during 2020, $682 million expire during<br />
2021, $882 million expire during 2035 and $114 million<br />
have an indefinite carry forward.<br />
165
OAO LUKOIL Notes to Consolidated Financial Statements<br />
(Millions of US dollars, except as indicated)<br />
NOTE 14.<br />
Pension benefits<br />
The Company sponsors a postretirement benefits program.<br />
The primary component of the post employment and post<br />
retirement benefits program is a defined benefit pension<br />
plan that covers the majority of the Group’s employees. This<br />
plan is administered by a non-state pension fund, LUKOIL-<br />
GARANT, and provides pension benefits primarily based on<br />
years of service and final remuneration levels. The Company<br />
also provides several long-term employee benefits such as<br />
a death-in-service benefit and lump-sum payments upon<br />
retirement of a defined benefit nature and other defined<br />
benefits to certain old age and disabled pensioners who have<br />
not vested any pensions under the pension plan.<br />
The Company’s pension plan primarily consists of a defined<br />
benefit plan enabling employees to contribute a portion<br />
of their salary to the plan and at retirement to receive a lump<br />
sum amount from the Company equal to all past contributions<br />
made by the employee (up to 2% of annual salary up<br />
to October 1, 2010 and up to 4% of annual salary in further<br />
periods). Employees also have the right to receive upon<br />
retirement the benefits accumulated under the previous<br />
pension plan that was replaced in December 2003. These<br />
benefits have been fixed and included in the benefit obligation<br />
as of December 31, 2011 and 2010. The amount was<br />
determined primarily based on a formula including past pensionable<br />
service and relative salaries as of December 31, 2003.<br />
The Company uses December 31 as the measurement<br />
date for its post employment and post retirement benefits<br />
program. An independent actuary has assessed the benefit<br />
obligations as of December 31, 2011 and 2010.<br />
The following table provides information about the benefit obligations and plan assets as of December 31, 2011 and 2010.<br />
The benefit obligations below represent the projected benefit obligation of the pension plan.<br />
2011 2010<br />
Benefit obligations<br />
Benefit obligations as of January 1 296 291<br />
Effect of exchange rate changes (14) (2)<br />
Service cost 15 16<br />
Interest cost 22 23<br />
Plan amendments (4) 6<br />
Actuarial loss – 2<br />
Acquisitions – 3<br />
Benefits paid (52) (40)<br />
Curtailment gain (3) (3)<br />
Benefit obligations as of December 31 260 296<br />
166
OAO LUKOIL Notes to Consolidated Financial Statements<br />
(Millions of US dollars, except as indicated)<br />
2011 2010<br />
Plan assets<br />
Fair value of plan assets as of January 1 112 108<br />
Effect of exchange rate changes (6) (1)<br />
Return on plan assets 2 6<br />
Employer contributions 49 39<br />
Benefits paid (52) (40)<br />
Fair value of plan assets as of December 31 105 112<br />
Funded status (155) (184)<br />
Amounts recognized in the consolidated balance sheet as of December 31,<br />
2011 and 2010<br />
Accrued benefit liabilities included in “Other long-term liabilities” (128) (144)<br />
Accrued benefit liabilities included in “Other current liabilities” (27) (40)<br />
Weighted average assumptions used to determine benefit obligations as of December 31, 2011 and 2010:<br />
2011 2010<br />
Discount rate 7.80% 7.80%<br />
Rate of compensation increase 7.30% 7.70%<br />
Weighted average assumptions used to determine net periodic benefit costs for the year ended December 31, 2011 and 2010:<br />
2011 2010<br />
Discount rate 7.80% 8.70%<br />
Rate of compensation increase 7.70% 8.10%<br />
Expected rate of return on plan assets 8.95% 10.07%<br />
Included in accumulated other comprehensive loss as of December 31, 2011 and 2010, are the following before-tax amounts<br />
that have not yet been recognized in net periodic benefit cost:<br />
2011 2010<br />
Unamortized prior service cost 61 84<br />
Unrecognized actuarial gain 4 (6)<br />
Total costs 65 78<br />
Amounts recognized in other comprehensive loss during the year ended December 31, 2011 and 2010:<br />
2011 2010<br />
Additional loss arising during the period 9 4<br />
Additional prior service cost from plan amendment (4) 6<br />
Re-classified prior service cost amortization (18) (18)<br />
Net amount recognized for the period (13) (8)<br />
167
OAO LUKOIL Notes to Consolidated Financial Statements<br />
(Millions of US dollars, except as indicated)<br />
The real returns on bonds and equities are based on what is<br />
observed in the international markets over extended periods<br />
of time. In the calculation of the expected return on assets<br />
no use is made of the historical returns LUKOIL-GARANT has<br />
achieved.<br />
In addition to the plan assets, LUKOIL-GARANT holds assets<br />
in the form of an insurance reserve. The purpose of this<br />
insurance reserve is to satisfy pension obligations should<br />
the plan assets not be sufficient to meet pension obligations.<br />
The Group’s contributions to the pension plan are<br />
determined without considering the assets in the insurance<br />
reserve.<br />
The plans are funded on a discretionary basis through<br />
a solidarity account, which is held in trust with LUKOIL-<br />
GARANT. LUKOIL-GARANT does not allocate separately<br />
identifiable assets to the Group or its other third party clients.<br />
All funds of plan assets and other individual pension accounts<br />
are managed as a pool of investments.<br />
The asset allocation of the investment portfolio maintained by LUKOIL-GARANT for the Group and its clients was as follows:<br />
Type of assets<br />
As of December<br />
31, 2011<br />
As of December<br />
31, 2010<br />
Eurobonds 4% –<br />
Russian corporate bonds 28% 37%<br />
Russian municipal bonds – 2%<br />
Bank deposits 44% 41%<br />
Equity securities of Russian issuers 6% 5%<br />
Shares of OAO LUKOIL 2% 1%<br />
Shares in investment funds 13% 13%<br />
Other assets 3% 1%<br />
100% 100%<br />
The investment strategy employed by LUKOIL-GARANT<br />
includes an overall goal to attain a maximum investment<br />
return, while guaranteeing the principal amount invested.<br />
The strategy is to invest with a medium-term perspective<br />
while maintaining a level of liquidity through proper allocation<br />
of investment assets. Investment policies include rules<br />
and limitations to avoid concentrations of investments.<br />
The investment portfolio is primarily comprised of investments:<br />
bank deposits, securities with fixed yield and<br />
equity securities. The securities with fixed yield include<br />
mainly high yield corporate bonds with low and medium risk<br />
ratings. Maturities range from one to three years.<br />
Components of net periodic benefit cost were as follows:<br />
Year ended<br />
December<br />
31, 2011<br />
Year ended<br />
December<br />
31, 2010<br />
Year ended<br />
December<br />
31, 2009<br />
Service cost 15 16 17<br />
Interest cost 22 23 23<br />
Less expected return on plan assets (10) (11) (10)<br />
Amortization of prior service cost 17 18 2<br />
Curtailment gain (2) (3) (11)<br />
Total net periodic benefit cost 42 43 21<br />
Total employer contributions for 2012 are expected to be $38 million. An amount of $13 million before-tax is included in other<br />
comprehensive income and expected to be recognized in the net periodic benefit cost in 2012.<br />
168
OAO LUKOIL Notes to Consolidated Financial Statements<br />
(Millions of US dollars, except as indicated)<br />
The following benefit payments, which reflect expected future services, as appropriate, are expected to be paid:<br />
2012 2013 2014 2015 2016<br />
5-year<br />
period<br />
2012-2016<br />
5-year<br />
period<br />
2017-2021<br />
Pension benefits 56 13 14 15 13 111 53<br />
Other long-term employee benefits 26 14 14 14 14 82 62<br />
Total expected benefits to be paid 82 27 28 29 27 193 115<br />
NOTE 15.<br />
Stockholders’ equity<br />
Common stock<br />
As of December<br />
31, 2011<br />
(thousands of<br />
shares)<br />
As of December<br />
31, 2010<br />
(thousands of<br />
shares)<br />
Authorized and issued common stock,<br />
par value of 0.025 Russian rubles each 850,563 850,563<br />
Treasury stock (76,101) (69,208)<br />
Outstanding common stock 774,462 781,355<br />
Dividends and dividend limitations<br />
Profits available for distribution to common stockholders<br />
in respect of any reporting period are determined by reference<br />
to the statutory financial statements of the Company<br />
prepared in accordance with the laws of the Russian<br />
Federation and denominated in Russian rubles. Under<br />
Russian Law, dividends are limited to the net profits of<br />
the reporting year as set out in the statutory financial statements<br />
of the Company. These laws and other legislative<br />
acts governing the rights of shareholders to receive<br />
dividends are subject to various interpretations.<br />
The Company’s net profits were 139,853 million Russian<br />
rubles, 45,148 million Russian rubles and 66,926 million<br />
Russian rubles respectively for 2010, 2009 and 2008, pursuant<br />
to the statutory financial statements, which at the US<br />
dollar exchange rates as of December 31, 2010, 2009 and<br />
2008, amounted to $4,589 million, $1,493 million and<br />
$2,278 million, respectively.<br />
At the annual stockholders’ meeting on June 23, 2011,<br />
dividends were declared for 2010 in the amount of 59.00<br />
Russian rubles per common share, which at the date of<br />
the meeting was equivalent to $2.11. Dividends payable of<br />
$10 million and $13 million are included in “Other current<br />
liabilities” in the consolidated balance sheets as of December<br />
31, 2011 and 2010, respectively.<br />
At the annual stockholders’ meeting on June 24, 2010,<br />
dividends were declared for 2009 in the amount of 52.00<br />
Russian rubles per common share, which at the date of the<br />
meeting was equivalent to $1.68.<br />
At the annual stockholders’ meeting on June 25, 2009,<br />
dividends were declared for 2008 in the amount of 50.00<br />
Russian rubles per common share, which at the date of the<br />
meeting was equivalent to $1.61.<br />
169
OAO LUKOIL Notes to Consolidated Financial Statements<br />
(Millions of US dollars, except as indicated)<br />
Earnings per share<br />
The calculation of diluted earnings per share for these years was as follows:<br />
Year ended<br />
December<br />
31, 2011<br />
Year ended<br />
December<br />
31, 2010<br />
Year ended<br />
December<br />
31, 2009<br />
Net income 10,357 9,006 7,011<br />
Add back interest and accretion on 2.625% convertible<br />
US dollar bonds, maturing 2015 (net of tax at effective rate) 63 3 –<br />
Total diluted net income 10,420 9,009 7,011<br />
Weighted average number of outstanding common shares<br />
(thousands of shares) 778,964 822,359 846,645<br />
Add back treasury shares held in respect of convertible debt<br />
(thousands of shares) 20,383 892 –<br />
Weighted average number of outstanding common shares,<br />
after dilution (thousands of shares) 799,347 823,251 846,645<br />
Earnings per share of common stock attributable to<br />
OAO LUKOIL (US dollars):<br />
Basic 13.30 10.95 8.28<br />
Diluted 13.04 10.94 8.28<br />
NOTE 16.<br />
Financial and derivative instruments<br />
Fair value<br />
The fair values of cash and cash equivalents, current accounts<br />
receivable, long-term receivables and liquid securities<br />
are approximately equal to their value as disclosed in the<br />
consolidated financial statements. The fair value of longterm<br />
receivables was determined by discounting with estimated<br />
market interest rates for similar financing arrangements.<br />
The fair value of long-term debt differs from the amount<br />
disclosed in the consolidated financial statements. The estimated<br />
fair value of long-term debt as of December 31, 2011<br />
and 2010 was $8,666 million and $10,225 million, respectively,<br />
as a result of discounting using estimated market interest<br />
rates for similar financing arrangements. These amounts<br />
include all future cash outflows associated with the longterm<br />
debt repayments, including the current portion and<br />
interest. Market interest rates mean the rates of raising<br />
long-term debt by companies with a similar credit rating<br />
for similar tenors, repayment schedules and similar other<br />
main terms. During the year ended December 31, 2011,<br />
the Group did not have significant transactions or events that<br />
would result in nonfinancial assets and liabilities measured<br />
at fair value on a nonrecurring basis.<br />
Derivative instruments<br />
The Group uses financial and commodity-based derivative<br />
contracts to manage exposures to fluctuations in foreign currency<br />
exchange rates, commodity prices, or to exploit market<br />
opportunities. Since the Group is not currently using hedge<br />
accounting, defined by Topic 815, “Derivative and hedging,”<br />
of the Codification, all gains and losses, realized or unrealized,<br />
from derivative contracts have been recognized in the<br />
consolidated income statement.<br />
Topic 815 of the Codification requires purchase and sales<br />
contracts for commodities that are readily convertible to<br />
cash (e.g., crude oil, natural gas and gasoline) to be recorded<br />
on the balance sheet as derivatives unless the contracts are<br />
for quantities the Group expects to use or sell over a reasonable<br />
period in the normal course of business (i.e., contracts<br />
eligible for the normal purchases and normal sales exception).<br />
The Group does apply the normal purchases and normal<br />
sales exception to certain long-term contracts to sell oil<br />
products. This normal purchases and normal sales exception<br />
is applied to eligible crude oil and refined product commodity<br />
purchase and sales contracts; however, the Group<br />
170
OAO LUKOIL Notes to Consolidated Financial Statements<br />
(Millions of US dollars, except as indicated)<br />
may elect not to apply this exception (e.g., when another<br />
derivative instrument will be used to mitigate the risk of the<br />
purchase or sale contract but hedge accounting will not be<br />
applied, in which case both the purchase or sales contract<br />
and the derivative contract mitigating the resulting risk will<br />
be recorded on the balance sheet at fair value).<br />
The fair value hierarchy for the Group’s derivative assets and liabilities accounted for at fair value on a recurring basis was:<br />
As of December<br />
31, 2011<br />
As of December<br />
31, 2010<br />
Level 1 Level 2 Level 3 Total Level 1 Level 2 Level 3 Total<br />
Assets<br />
Commodity derivatives – 575 – 575 – 226 – 226<br />
Total assets – 575 – 575 – 226 – 226<br />
Liabilities<br />
Commodity derivatives – (599) – (599) – (264) – (264)<br />
Total liabilities – (599) – (599) – (264) – (264)<br />
Net liabilities – (24) – (24) – (38) – (38)<br />
The derivative values above are based on an analysis of each<br />
contract as the fundamental unit of account as required by<br />
Topic 820, “Fair Value Measurements and Disclosures,” of the<br />
Codification; therefore, derivative assets and liabilities with<br />
the same counterparty are not reflected net where the legal<br />
right of offset exists. Gains or losses from contracts in one<br />
level may be offset by gains or losses on contracts in another<br />
level or by changes in values of physical contracts or positions<br />
that are not reflected in the table above.<br />
Commodity derivative contracts<br />
exposed to fluctuations in the prices for these commodities.<br />
These fluctuations can affect the Group’s revenues as<br />
well as the cost of operating, investing and financing activities.<br />
Generally, the Group’s policy is to remain exposed to<br />
the market prices of commodities. However, the Group uses<br />
futures, forwards, swaps and options in various markets to<br />
balance physical systems, meet customer needs, manage<br />
price exposures on specific transactions, and do a limited,<br />
immaterial amount of trading not directly related to the<br />
Group’s physical business. These activities may move the<br />
Group’s profile away from market average prices.<br />
The Group operates in the worldwide crude oil, refined<br />
product, natural gas and natural gas liquids markets and is<br />
The fair value of commodity derivative assets and liabilities as of December 31, 2011 was:<br />
As of December<br />
31, 2011<br />
Assets<br />
Accounts receivable 575<br />
Liabilities<br />
Accounts payable (599)<br />
Hedge accounting has not been used for items in the table.<br />
171
OAO LUKOIL Notes to Consolidated Financial Statements<br />
(Millions of US dollars, except as indicated)<br />
As required under Topic 815 of the Codification the amounts<br />
shown in the preceding table are presented gross (i.e.,<br />
without netting assets and liabilities with the same counterparty<br />
where the right of offset and intent to net exist).<br />
Derivative assets and liabilities resulting from eligible commodity<br />
contracts have been netted in the consolidated<br />
balance sheet and are recorded as accounts receivable in<br />
the amount of $39 million and accounts payable in the<br />
amount of $63 million.<br />
Financial results from commodity derivatives were included<br />
in the consolidated income statements in “Cost of purchased<br />
crude oil, gas and products”. Realized losses were<br />
$667 million and unrealized gains were $10 million for<br />
the year ended December 31, 2011 and realized losses were<br />
$235 million and unrealized gains were $3 million for the year<br />
ended December 31, 2010.<br />
As of December 31, 2011, the net position of outstanding<br />
commodity derivative contracts, primarily to manage<br />
price exposure on underlying operations, was not significant.<br />
Currency exchange rate derivative contracts<br />
The Group has foreign currency exchange rate risk resulting<br />
from its international operations. The Group does not comprehensively<br />
hedge the exposure to currency rate changes,<br />
although the Group selectively hedges certain foreign<br />
currency exchange rate exposures, such as firm commitments<br />
for capital projects or local currency tax payments and<br />
dividends.<br />
The fair value of foreign currency derivatives assets and<br />
liabilities open at December 31, 2011 was not significant.<br />
The impact from foreign currency derivatives during the<br />
year ended December 31, 2011 on the consolidated income<br />
statement was not significant. The net position of outstanding<br />
foreign currency swap contracts as of December 31, 2011<br />
also was not significant.<br />
Credit risk<br />
The Group’s financial instruments that are potentially<br />
exposed to concentrations of credit risk consist primarily<br />
of cash equivalents, over-the-counter derivative contracts<br />
and trade receivables. Cash equivalents are placed in highquality<br />
commercial paper, money market funds and time<br />
deposits with major international banks and financial institutions.<br />
The credit risk from the Group’s over-the-counter derivative<br />
contracts, such as forwards and swaps, derives from the<br />
counterparty to the transaction, typically a major bank or<br />
financial institution. Individual counterparty exposure is<br />
managed within predetermined credit limits and includes the<br />
use of cash-call margins when appropriate, thereby reducing<br />
the risk of significant non-performance. The Group also uses<br />
futures contracts, but futures have a negligible credit risk<br />
because they are traded on the New York Mercantile<br />
Exchange or the ICE Futures.<br />
Certain of the Group’s derivative instruments contain provisions<br />
that require the Group to post collateral if the derivative<br />
exposure exceeds a threshold amount. The Group<br />
has contracts with fixed threshold amounts and other contracts<br />
with variable threshold amounts that are contingent<br />
on the Group’s credit rating. The variable threshold amounts<br />
typically decline for lower credit ratings, while both the variable<br />
and fixed threshold amounts typically revert to zero<br />
if the Group falls below investment grade. Cash is the primary<br />
collateral in all contracts; however, many contracts also<br />
permit the Group to post letters of credit as collateral.<br />
There were no derivative instruments with such credit-riskrelated<br />
contingent features that were in a liability position<br />
on December 31, 2011. The Group posted $35 million in collateral<br />
in the normal course of business for the over-the-counter<br />
derivatives. If the Group’s credit rating were lowered one<br />
level from its "BBB-" rating (per Standard and Poors) on<br />
December 31, 2011, and it would be below investment grade,<br />
the Group would be required to post additional collateral<br />
of $5 million to the Group’s counterparties for the overthe-counter<br />
derivatives, either with cash or letters of credit.<br />
The maximum additional collateral based on the lowest<br />
downgrade would be $14 million in total.<br />
NOTE 17.<br />
Consolidation of Variable Interest<br />
Entity<br />
The Group and ConocoPhillips have a joint venture NMNG<br />
which develops oil reserves in the Timan-Pechora region<br />
of the Russian Federation. The Group and ConocoPhillips<br />
have equal voting rights over the joint venture’s activity<br />
and effective ownership interests of 70% and 30%, respectively.<br />
The Group originally determined that NMNG is a variable<br />
interest entity (“VIE”) as the Group’s voting rights are not<br />
proportionate to its ownership rights and all of NMNG’s<br />
activities are conducted on behalf of the Group and<br />
ConocoPhillips, its former related party. Based on the requirements<br />
of Topic 810, “Consolidation,” of the Codification,<br />
the Group performs a regular qualitative analysis as to<br />
172
OAO LUKOIL Notes to Consolidated Financial Statements<br />
(Millions of US dollars, except as indicated)<br />
whether it is the primary beneficiary of this VIE. As a result<br />
the Group is still considered to be the primary beneficiary of<br />
NMNG and consolidated it.<br />
NMNG’s total assets were approximately $3.3 billion and<br />
$5.5 billion as of December 31, 2011 and 2010, respectively.<br />
NOTE 18.<br />
Commitments and contingencies<br />
Capital expenditure, exploration<br />
and investment programs<br />
Under the terms of existing exploration and production<br />
license agreements in Russia the Group has to fulfill certain<br />
obligations: oil and gas exploration, wells drilling, fields<br />
development, etc., and the Group also has commitments<br />
to reach a defined level of extraction on the fields.<br />
Management believes that the Group’s approved annual<br />
capital expenditure budgets fully cover all the requirements<br />
of the described license obligations.<br />
Group companies have commitments for capital<br />
expenditure contributions in the amount of $406 million<br />
related to various production sharing agreements over<br />
the next 26 years.<br />
The Company signed a three-year agreement for the years<br />
2010-2012 for drilling services with OOO Eurasia Drilling<br />
Company. The volume of these services is based on the<br />
Group’s capital construction program, which is re-evaluated<br />
on an annual basis. The Group estimates the amount<br />
of capital commitment under this agreement for 2012 to be<br />
approximately $1,521 million.<br />
The Company signed a strategic agreement for the ongoing<br />
provision of construction, engineering and technical<br />
services with ZAO Globalstroy-Engineering. The volume<br />
of these services is based on the Group’s capital construction<br />
program, which is re-evaluated on an annual basis.<br />
The Group estimates the amount of capital commitment<br />
under this agreement for 2012 to be approximately $225<br />
million.<br />
The Group signed a number of agreements for the years<br />
2012-2015 for construction of offshore platforms in the<br />
Caspian region. The Group estimates the amount of this<br />
capital commitment to be approximately $866 million.<br />
The Group has a commitment to execute the capital<br />
construction program of its power generation segment<br />
and under the terms of this program power plants with<br />
a total capacity of 890 MW should be constructed. Currently<br />
the Group is approving certain amendments to the capital<br />
construction program, including its extension to the<br />
end of 2014. As of December 31, 2011, the Group estimates<br />
the amount of this commitment to be approximately<br />
$594 million.<br />
Operating lease<br />
obligations<br />
Group companies have commitments of $507 million<br />
primarily for the lease of vessels and petroleum distribution<br />
outlets. Operating lease expenses were $175 million and<br />
$155 million during the years ended December 31, 2011<br />
and 2010, respectively. Commitments for minimum rentals<br />
under these leases as of December 31, 2011 are as follows:<br />
As of December<br />
31, 2011<br />
2012 145<br />
2013 83<br />
2014 74<br />
2015 46<br />
2016 54<br />
beyond 105<br />
Insurance<br />
The insurance industry in the Russian Federation and certain<br />
other areas where the Group has operations is in the course<br />
of development. Management believes that the Group has<br />
adequate property damage coverage for its main production<br />
assets. In respect of third party liability for property and<br />
environmental damage arising from accidents on Group<br />
property or relating to Group operations, the Group has<br />
insurance coverage that is generally higher than insurance<br />
limits set by the local legal requirements. Management<br />
believes that the Group has adequate insurance coverage of<br />
the risks, which could have a material effect on the Group’s<br />
operations and financial position.<br />
Environmental liabilities<br />
Group companies and their predecessor entities have<br />
operated in the Russian Federation and other countries for<br />
many years and, within certain parts of the operations, environmental<br />
related problems have developed. Environmental<br />
regulations are currently under consideration in the<br />
Russian Federation and other areas where the Group has<br />
173
OAO LUKOIL Notes to Consolidated Financial Statements<br />
(Millions of US dollars, except as indicated)<br />
operations. Group companies routinely assess and evaluate<br />
their obligations in response to new and changing<br />
legislation.<br />
As liabilities in respect of the Group’s environmental obligations<br />
are able to be determined, they are charged against<br />
income. The likelihood and amount of liabilities relating<br />
to environmental obligations under proposed or any<br />
future legislation cannot be reasonably estimated at present<br />
and could become material. Under existing legislation,<br />
however, management believes that there are no significant<br />
unrecorded liabilities or contingencies, which could<br />
have a materially adverse effect on the operating results<br />
or financial position of the Group.<br />
Social assets<br />
Certain Group companies contribute to Government<br />
sponsored programs, the maintenance of local infrastructure<br />
and the welfare of their employees within the<br />
Russian Federation and elsewhere. Such contributions<br />
include assistance with the construction, development<br />
and maintenance of housing, hospitals and transport<br />
services, recreation and other social needs. The funding<br />
of such assistance is periodically determined by management<br />
and is appropriately capitalized or expensed as<br />
incurred.<br />
Taxation environment<br />
The taxation systems in the Russian Federation and other<br />
emerging markets where Group companies operate are<br />
relatively new and are characterized by numerous taxes<br />
and frequently changing legislation, which is often unclear,<br />
contradictory, and subject to interpretation. Often, differing<br />
interpretations exist among different tax authorities<br />
within the same jurisdictions and among taxing authorities<br />
in different jurisdictions. Taxes are subject to review and<br />
investigation by a number of authorities, which are enabled<br />
by law to impose severe fines, penalties and interest<br />
charges. In the Russian Federation a tax year remains open<br />
for review by the tax authorities during the three subsequent<br />
calendar years; however, under certain circumstances<br />
a tax year may remain open longer. Recent events within<br />
the Russian Federation suggest that the tax authorities<br />
are taking a more assertive position in their interpretation<br />
and enforcement of tax legislation. Such factors may create<br />
taxation risks in the Russian Federation and other emerging<br />
markets where Group companies operate substantially<br />
more significant than those in other countries where<br />
taxation regimes have been subject to development and<br />
clarification over long periods.<br />
The tax authorities in each region may have a different interpretation<br />
of similar taxation issues which may result in<br />
taxation issues successfully defended by the Group in one<br />
region being unsuccessful in another region. There is some<br />
direction provided from the central authority based in<br />
Moscow on particular taxation issues.<br />
The Group has implemented tax planning and management<br />
strategies based on existing legislation at the time of implementation.<br />
The Group is subject to tax authority audits on<br />
an ongoing basis, as is normal in the Russian environment<br />
and other republics of the former Soviet Union, and, at times,<br />
the authorities have attempted to impose additional significant<br />
taxes on the Group. Management believes that it has<br />
adequately met and provided for tax liabilities based on<br />
its interpretation of existing tax legislation. However,<br />
the relevant tax authorities may have differing interpretations<br />
and the effects on the financial statements, if the<br />
authorities were successful in enforcing their interpretations,<br />
could be significant.<br />
Litigation and claims<br />
On November 27, 2001, Archangel Diamond Corporation<br />
(“ADC”), a Canadian diamond development company, filed<br />
a lawsuit in the Denver District Court, Colorado against<br />
OAO Arkhangelskgeoldobycha (“AGD”), a Group company,<br />
and the Company (together the “Defendants”). ADC<br />
alleged that the Defendants interfered with the transfer<br />
of a diamond exploration license to Almazny Bereg, a joint<br />
venture between ADC and AGD. ADC claimed compensatory<br />
damages of $1.2 billion and punitive damages of $3.6 billion.<br />
On October 15, 2002, the District Court dismissed the lawsuit<br />
for lack of personal jurisdiction. This ruling was upheld<br />
by the Colorado Court of Appeals on March 25, 2004.<br />
On November 21, 2005, the Colorado Supreme Court affirmed<br />
the lower courts’ ruling that no specific jurisdiction<br />
exists over the Defendants.<br />
By virtue of this finding, AGD (the holder of the diamond<br />
exploration license) was dismissed from the lawsuit.<br />
The Colorado Supreme Court found, however, that the trial<br />
court made a procedural error by failing to hold an evidentiary<br />
hearing before making its ruling concerning general<br />
jurisdiction regarding the Company and remanded the case<br />
to the Colorado Court of Appeals to consider whether<br />
the lawsuit should have been dismissed on alternative<br />
grounds (i.e., forum non conveniens). The Colorado Court<br />
of Appeals declined to dismiss the case based on forum<br />
non conveniens and the case was remanded to the<br />
District Court. In June 2009, three creditors of ADC filed<br />
an Involuntary Bankruptcy Petition putting ADC into<br />
bankruptcy. In November 2009, after adding a claim,<br />
174
OAO LUKOIL Notes to Consolidated Financial Statements<br />
(Millions of US dollars, except as indicated)<br />
ADC removed the case from the District Court to the US<br />
Bankruptcy Court. On October 28, 2010, the Bankruptcy<br />
Court granted the Company’s Motion for Remand and<br />
Abstention and remanded the case to the Denver District<br />
Court. On October 20, 2011, the Denver District Court dismissed<br />
all claims in the lawsuit against the Company.<br />
ADC has filed a notice of appeal. No briefing schedule<br />
has been established. Management does not believe that<br />
the ultimate resolution of this matter will have a material<br />
adverse effect on the Group’s financial condition.<br />
On January 6, 2012, ADC filed a lawsuit in the US District Court<br />
for the District of Colorado (federal court) reasserting almost<br />
identical claims asserted in the aforementioned lawsuit<br />
and dismissed by the Denver District Court (state court)<br />
notwithstanding ADC’s appeal of the state court’s decision.<br />
The time within which the Company is required to respond<br />
has not expired. The Company plans to seek dismissal of<br />
the case and vigorously defend the matter. Management<br />
does not believe that the ultimate resolution of this matter<br />
will have a material adverse effect on the Group’s financial<br />
condition.<br />
As of the date the financial statements were available to be<br />
issued approximately 100 claims in relation to a violation<br />
of the anti-monopoly regulation were initiated against several<br />
Group companies in Russia and abroad. The Group companies<br />
were accused of violations primarily involving abuse<br />
of their dominant market position and execution of coordinated<br />
actions in oil products retail markets.<br />
On February 9, 2011, the Federal Anti-monopoly Service of<br />
the Russian Federation (“FAS of Russia”) filed a case against<br />
the three largest Russian oil companies, including the<br />
Company, accusing them of abuse of their dominant position<br />
in the oil products market. The decision accusing the<br />
Company in establishing monopolistically high prices on<br />
diesel fuel during the period October 2010 – December<br />
2010 was issued on August 9, 2011. The case in establishing<br />
monopolistically high prices on jet fuel was separated into<br />
an individual proceeding and its hearing is scheduled for<br />
March 20, 2012. On December 28, 2011, FAS of Russia defined<br />
fines against the Company and the Group’s refinery plants<br />
in the amount of $19 million. The decision was not contested<br />
and the fines were paid on February 17, 2012. The Group<br />
accrued a provision for this amount in the consolidated<br />
financial statements as of December 31, 2011.<br />
The Group is involved in cost recovery disputes with the<br />
Republic of Kazakhstan. The Group’s share of the claim is<br />
approximately $295 million. Management is of the view that<br />
substantially all of the amounts subject to dispute are in<br />
fact recoverable under the Final Production Sharing Agreement.<br />
Management believes that the ultimate resolution<br />
of the claim will not have a material adverse impact<br />
on the Group’s operating results or financial condition.<br />
The Group is involved in various other claims and legal<br />
proceedings arising in the normal course of business. While<br />
these claims may seek substantial damages against the<br />
Group and are subject to uncertainty inherent in any litigation,<br />
management does not believe that the ultimate resolution<br />
of such matters will have a material adverse impact<br />
on the Group’s operating results or financial condition.<br />
NOTE 19.<br />
Related party transactions<br />
In the rapidly developing business environment in the<br />
Russian Federation, companies and individuals have frequently<br />
used nominees and other forms of intermediary<br />
companies in transactions. The senior management of the<br />
Company believes that the Group has appropriate procedures<br />
in place to identify and properly disclose transactions<br />
with related parties in this environment and has disclosed<br />
all of the relationships identified which it deemed to be<br />
significant. Related party sales and purchases of oil and oil<br />
products were primarily to and from affiliated companies and<br />
the Company’s shareholder ConocoPhillips. Related party<br />
processing services were provided by affiliated refineries.<br />
As a result of the purchase of the Company’s shares by<br />
a Group company from ConocoPhillips in September 2010,<br />
ConocoPhillips ceased to be a related party of the Group by<br />
the end of the third quarter of 2010.<br />
Below are related party transactions not disclosed elsewhere<br />
in the financial statements. Refer also to Notes 3, 7, 11,<br />
14, 17 and 20 for other transactions with related parties.<br />
Sales of oil and oil products to related parties were<br />
$1,298 million, $2,383 million and $1,152 million for the years<br />
ended December 31, 2011, 2010 and 2009, respectively.<br />
Other sales to related parties were $54 million, $134 million<br />
and $69 million for the years ended December 31, 2011, 2010<br />
and 2009, respectively.<br />
Purchases of oil and oil products from related parties<br />
were $374 million, $521 million and $862 million for the years<br />
ended December 31, 2011, 2010 and 2009, respectively.<br />
Purchases of processing services from related parties<br />
were $901 million, $719 million and $539 million for the years<br />
ended December 31, 2011, 2010 and 2009, respectively.<br />
175
OAO LUKOIL Notes to Consolidated Financial Statements<br />
(Millions of US dollars, except as indicated)<br />
Other purchases from related parties were $73 million, $39<br />
million and $28 million for the years ended December 31,<br />
2011, 2010 and 2009, respectively.<br />
Amounts receivable from related parties, including<br />
advances, were $415 million and $419 million as of December<br />
31, 2011 and 2010, respectively. Amounts payable to related<br />
parties were $115 million and $114 million as of December 31,<br />
2011 and 2010, respectively.<br />
NOTE 20.<br />
Compensation plan<br />
Since December 2009, the Company has a compensation<br />
plan to certain members of management for the period from<br />
2010 to 2012, which is based on assigned shares and provides<br />
compensation consisting of two parts. The first part<br />
represents annual bonuses that are based on the number<br />
of assigned shares and the amount of dividend per share.<br />
The payment of these bonuses is contingent on the Group<br />
meeting certain financial KPIs in each financial year. The second<br />
part is based upon the Company’s common stock appreciation<br />
from 2010 to 2012, with rights vesting after the date<br />
of the compensation plan’s termination. The number of assigned<br />
shares is approximately 17.3 million.<br />
For the first part of the share plan the Group recognizes<br />
a liability based on expected dividends and the number of<br />
assigned shares.<br />
The second part of the share plan is classified as equity<br />
settled. The grant date fair value of the plan was estimated<br />
at $295 million using the Black-Scholes-Merton optionpricing<br />
model, assuming a risk-free interest rate of 8.0% per<br />
annum, an expected dividend yield of 3.09% per annum,<br />
an expected term of three years and a volatility factor of<br />
34.86%. The expected volatility factor was estimated based<br />
on the historical volatility of the Company’s shares for the<br />
previous five year period up to January 2010.<br />
As of December 31, 2011, there was $98 million of total<br />
unrecognized compensation cost related to unvested benefits.<br />
This cost is expected to be recognized periodically by<br />
the Group up to December 2012.<br />
During the period from 2007 to 2009, the Company had<br />
a compensation plan available to certain members of management.<br />
Its conditions were similar to the conditions of<br />
the new compensation plan introduced in December 2009.<br />
The number of assigned shares was approximately 15.5 million<br />
shares. Because of an unfavorable market situation the<br />
conditions for exercising the second part of this share plan<br />
were not met and therefore no payments or share transfers to<br />
employees took place by the end of the compensation plan.<br />
Related to these plans the Group recorded $137 million,<br />
$129 million and $105 million of compensation expenses<br />
during 2011, 2010 and 2009, respectively, of which $98 million,<br />
$98 million and $20 million, respectively, are recognized<br />
as an increase in additional paid-in capital. As of December<br />
31, 2011 and 2010, $28 million and $33 million related to<br />
these plans are included in “Other current liabilities” of the<br />
consolidated balance sheets, respectively. The total recognized<br />
tax benefits related to these accruals were $20 million,<br />
$21 million and $21 million during the years ended December<br />
31, 2011, 2010 and 2009.<br />
NOTE 21.<br />
Segment information<br />
Presented below is information about the Group’s operating<br />
and geographical segments for the years ended December<br />
31, 2011, 2010 and 2009, in accordance with Topic 280,<br />
“Segment reporting,” of the Codification.<br />
The Group has the following operating segments –<br />
exploration and production; refining, marketing and<br />
distribution; chemicals; power generation and other business<br />
segments. These segments have been determined based<br />
on the nature of their operations. Management on a regular<br />
basis assesses the performance of these operating segments.<br />
The exploration and production segment explores<br />
for, develops and produces primarily crude oil. The refining,<br />
marketing and distribution segment processes crude oil<br />
into refined products and purchases, sells and transports<br />
crude oil and refined petroleum products. The chemicals<br />
segment refines and sells chemical products. The power<br />
generation segment produces steam and electricity,<br />
distributes them and provides related services. The activities<br />
of the other business operating segment include businesses<br />
beyond the Group’s traditional operations.<br />
Geographical segments are based on the area of operations<br />
and include two segments: Russia and International.<br />
Geographical segments presentation has been changed<br />
starting from the three-month period ended March 31, 2011,<br />
due to a change in the Company’s management reporting<br />
system.<br />
176
OAO LUKOIL Notes to Consolidated Financial Statements<br />
(Millions of US dollars, except as indicated)<br />
Operating segments<br />
2011<br />
Sales<br />
Exploration<br />
and<br />
production<br />
Refining,<br />
marketing and<br />
distribution<br />
Chemicals<br />
Power<br />
generation Other Elimination<br />
Third parties 3,449 126,665 1,944 1,472 120 – 133,650<br />
Inter-segment 41,409 1,884 500 1,520 2,467 (47,780) –<br />
Total sales 44,858 128,549 2,444 2,992 2,587 (47,780) 133,650<br />
Operating expenses 4,347 3,975 459 2,098 2,029 (3,853) 9,055<br />
Depreciation, depletion<br />
and amortization 2,865 1,248 63 224 129 (56) 4,473<br />
Interest expense 732 709 20 47 505 (1,319) 694<br />
Income tax expense 2,106 1,060 43 (5) 10 79 3,293<br />
Net income (net loss) 6,665 3,687 (27) (127) (370) 529 10,357<br />
Total assets 60,311 62,173 1,488 4,220 21,201 (58,201) 91,192<br />
Capital expenditures 6,629 1,354 89 196 224 – 8,492<br />
Consolidated<br />
2010<br />
Exploration<br />
and<br />
production<br />
Refining,<br />
marketing and<br />
distribution Chemicals<br />
Power<br />
generation Other Elimination<br />
Consolidated<br />
Sales<br />
Third parties 3,012 99,064 1,331 1,416 133 – 104,956<br />
Inter-segment 33,511 1,182 271 1,277 1,937 (38,178) –<br />
Total sales 36,523 100,246 1,602 2,693 2,070 (38,178) 104,956<br />
Operating expenses 3,965 3,771 294 1,901 1,628 (3,261) 8,298<br />
Depreciation, depletion<br />
and amortization 2,773 1,033 40 183 126 (1) 4,154<br />
Interest expense 806 859 26 38 405 (1,422) 712<br />
Income tax expense 1,449 874 37 (14) 4 1 2,351<br />
Net income (net loss) 6,139 3,330 101 (167) (317) (80) 9,006<br />
Total assets 57,280 56,908 1,249 4,338 15,390 (51,148) 84,017<br />
Capital expenditures 4,908 1,320 76 420 120 – 6,844<br />
177
OAO LUKOIL Notes to Consolidated Financial Statements<br />
(Millions of US dollars, except as indicated)<br />
2009<br />
Sales<br />
Exploration<br />
and<br />
production<br />
Refining,<br />
marketing and<br />
distribution<br />
Chemicals<br />
Power<br />
generation Other Elimination<br />
Consolidated<br />
Third parties 2,257 76,096 1,576 1,087 67 – 81,083<br />
Inter-segment 22,096 955 162 1,065 725 (25,003) –<br />
Total sales 24,353 77,051 1,738 2,152 792 (25,003) 81,083<br />
Operating expenses 3,266 3,472 515 1,475 452 (1,840) 7,340<br />
Depreciation, depletion<br />
and amortization 2,612 936 41 198 150 – 3,937<br />
Interest expense 886 1,205 14 52 381 (1,871) 667<br />
Income tax expense 1,221 821 12 (7) 6 (59) 1,994<br />
Net income (net loss) 5,456 2,268 (74) (162) (147) (330) 7,011<br />
Total assets 55,033 56,286 1,371 4,041 14,250 (51,962) 79,019<br />
Capital expenditures 4,626 1,316 113 283 196 – 6,534<br />
Geographical segments<br />
2011 2010 2009<br />
Sales of crude oil within Russia 1,571 956 735<br />
Export of crude oil and sales of crude oil by foreign subsidiaries 32,522 26,342 19,914<br />
Sales of petroleum products within Russia 15,242 10,928 8,101<br />
Export of petroleum products and sales of petroleum products<br />
by foreign subsidiaries 76,335 60,018 46,888<br />
Sales of chemicals within Russia 914 728 514<br />
Export of chemicals and sales of chemicals by foreign subsidiaries 1,095 642 574<br />
Other sales within Russia 3,213 2,881 2,235<br />
Other export sales and other sales by foreign subsidiaries 2,758 2,461 2,122<br />
Total sales 133,650 104,956 81,083<br />
2011 Russia International Elimination Consolidated<br />
Sales<br />
Third parties 24,674 108,976 – 133,650<br />
Inter-segment 39,567 143 (39,710) –<br />
Total sales 64,241 109,119 (39,710) 133,650<br />
Operating expenses 6,999 2,094 (38) 9,055<br />
Depletion, depreciation and amortization 3,692 781 – 4,473<br />
Interest expense 338 477 (121) 694<br />
Income taxes 2,715 554 24 3,293<br />
Net income 9,769 4 584 10,357<br />
Total assets 73,150 34,384 (16,342) 91,192<br />
Capital expenditures 6,516 1,976 – 8,492<br />
178
OAO LUKOIL Notes to Consolidated Financial Statements<br />
(Millions of US dollars, except as indicated)<br />
2010 Russia International Elimination Consolidated<br />
Sales<br />
Third parties 17,615 87,341 – 104,956<br />
Inter-segment 34,599 37 (34,636) –<br />
Total sales 52,214 87,378 (34,636) 104,956<br />
Operating expenses 6,334 2,005 (41) 8,298<br />
Depletion, depreciation and amortization 3,393 761 – 4,154<br />
Interest expense 415 427 (130) 712<br />
Income taxes 1,993 359 (1) 2,351<br />
Net income 8,542 542 (78) 9,006<br />
Total assets 74,033 30,225 (20,241) 84,017<br />
Capital expenditures 5,333 1,511 – 6,844<br />
2009 Russia International Elimination Consolidated<br />
Sales<br />
Third parties 13,880 67,203 – 81,083<br />
Inter-segment 26,897 18 (26,915) –<br />
Total sales 40,777 67,221 (26,915) 81,083<br />
Operating expenses 5,434 1,952 (46) 7,340<br />
Depletion, depreciation and amortization 3,186 751 – 3,937<br />
Interest expense 448 406 (187) 667<br />
Income taxes 1,834 219 (59) 1,994<br />
Net income 7,511 (168) (332) 7,011<br />
Total assets 58,461 28,038 (7,480) 79,019<br />
Capital expenditures 5,064 1,470 – 6,534<br />
The Group’s international sales to third parties include sales<br />
in Switzerland of $66,884 million, $53,245 million and $37,724<br />
million for the years ended December 31, 2011, 2010 and 2009,<br />
respectively. The Group’s international sales to third parties<br />
include sales in the USA of $9,496 million, $8,595 million and<br />
$8,144 million for the years ended December 31, 2011, 2010<br />
and 2009, respectively. These amounts are attributed to<br />
individual countries based on the jurisdiction of subsidiaries<br />
making the sale.<br />
NOTE 22.<br />
Subsequent events<br />
In accordance with the requirements of Topic 855, “Subsequent<br />
events,” of the Codification, the Group evaluated<br />
subsequent events through the date the financial statements<br />
were available to be issued. Therefore subsequent events<br />
were evaluated by the Group up to February 24, 2012.<br />
179
OAO LUKOIL Supplementary Information on Oil and Gas Exploration and Production Activities (Unaudited)<br />
(Millions of US dollars, except as indicated)<br />
This section provides unaudited supplemental information on oil and gas exploration and production activities in accordance<br />
with Topic 932, “Disclosures About Oil and Gas Producing Activities,” of the Codification in six separate tables:<br />
I. Capitalized costs relating to oil and gas producing activities<br />
II.<br />
III.<br />
IV.<br />
Costs incurred in oil and gas property acquisition, exploration, and development activities<br />
Results of operations for oil and gas producing activities<br />
Reserve quantity information<br />
V. Standardized measure of discounted future net cash flows<br />
VI.<br />
Principal sources of changes in the standardized measure of discounted future net cash flows<br />
Amounts shown for equity companies represent the Group’s share in its exploration and production affiliates, which are<br />
accounted for using the equity method of accounting.<br />
I. Capitalized costs relating to oil and gas producing activities<br />
As of December 31, 2011 International Russia<br />
Total consolidated<br />
companies<br />
Group’s share in<br />
equity companies<br />
Unproved oil and gas properties 659 583 1,242 166<br />
Proved oil and gas properties 7,479 52,939 60,418 2,315<br />
Accumulated depreciation, depletion,<br />
and amortization (1,762) (19,527) (21,289) (718)<br />
Net capitalized costs 6,376 33,995 40,371 1,763<br />
As of December 31, 2010 International Russia<br />
Total consolidated<br />
companies<br />
Group’s share in<br />
equity companies<br />
Unproved oil and gas properties 536 302 838 274<br />
Proved oil and gas properties 6,578 50,662 57,240 2,111<br />
Accumulated depreciation, depletion,<br />
and amortization (1,490) (18,530) (20,020) (597)<br />
Net capitalized costs 5,624 32,434 38,058 1,788<br />
180
OAO LUKOIL Supplementary Information on Oil and Gas Exploration and Production Activities (Unaudited)<br />
(Millions of US dollars, except as indicated)<br />
As of December 31, 2009 International Russia<br />
Total consolidated<br />
companies<br />
Group’s share in<br />
equity companies<br />
Unproved oil and gas properties 545 305 850 285<br />
Proved oil and gas properties 5,826 47,237 53,063 1,998<br />
Accumulated depreciation, depletion,<br />
and amortization (1,201) (16,460) (17,661) (454)<br />
Net capitalized costs 5,170 31,082 36,252 1,829<br />
II. Costs incurred in oil and gas property acquisition, exploration, and development<br />
activities<br />
Year ended December 31, 2011 International Russia<br />
Total consolidated<br />
companies<br />
Group’s share in<br />
equity companies<br />
Acquisition of properties – proved – 41 41 –<br />
Acquisition of properties – unproved 70 164 234 –<br />
Exploration costs 507 358 865 8<br />
Development costs 968 4,726 5,694 123<br />
Total costs incurred 1,545 5,289 6,834 131<br />
Year ended December 31, 2010 International Russia<br />
Total consolidated<br />
companies<br />
Group’s share in<br />
equity companies<br />
Acquisition of properties – proved 113 – 113 –<br />
Acquisition of properties – unproved – 15 15 122<br />
Exploration costs 199 220 419 16<br />
Development costs 685 3,686 4,371 115<br />
Total costs incurred 997 3,921 4,918 253<br />
Year ended December 31, 2009 International Russia<br />
Total consolidated<br />
companies<br />
Group’s share in<br />
equity companies<br />
Acquisition of properties – proved – 17 17 1,154<br />
Acquisition of properties – unproved – 23 23 97<br />
Exploration costs 221 162 383 11<br />
Development costs 549 3,726 4,275 146<br />
Total costs incurred 770 3,928 4,698 1,408<br />
181
OAO LUKOIL Supplementary Information on Oil and Gas Exploration and Production Activities (Unaudited)<br />
(Millions of US dollars, except as indicated)<br />
III. Results of operations for oil and gas producing activities<br />
The Group’s results of operations for oil and gas producing activities are presented below. In accordance with Topic 932<br />
of the Codification, sales and transfers to Group companies are based on market prices. Income taxes are based on statutory<br />
rates. The results of operations exclude corporate overhead and interest costs.<br />
Year ended December 31, 2011 International Russia<br />
Total consolidated<br />
companies<br />
Group’s share in<br />
equity companies<br />
Revenue<br />
Sales 2,656 25,232 27,888 1,924<br />
Transfers – 13,981 13,981 14<br />
Total revenues 2,656 39,213 41,869 1,938<br />
Production costs<br />
(excluding production taxes) (242) (3,298) (3,540) (93)<br />
Exploration expense (439) (93) (532) (2)<br />
Depreciation, depletion, and amortization,<br />
and valuation provision (324) (2,511) (2,835) (125)<br />
Taxes other than income taxes (460) (23,817) (24,277) (640)<br />
Related income taxes (531) (1,817) (2,348) (407)<br />
Total results of operations for producing<br />
activities 660 7,677 8,337 671<br />
Year ended December 31, 2010 International Russia<br />
Total consolidated<br />
companies<br />
Group’s share in<br />
equity companies<br />
Revenue<br />
Sales 1,926 19,956 21,882 1,350<br />
Transfers – 12,278 12,278 13<br />
Total revenues 1,926 32,234 34,160 1,363<br />
Production costs<br />
(excluding production taxes) (218) (3,023) (3,241) (113)<br />
Exploration expense (240) (96) (336) (2)<br />
Depreciation, depletion, and amortization,<br />
and valuation provision (306) (2,504) (2,810) (127)<br />
Taxes other than income taxes (257) (17,872) (18,129) (321)<br />
Related income taxes (314) (1,813) (2,127) (275)<br />
Total results of operations for producing<br />
activities 591 6,926 7,517 525<br />
182
OAO LUKOIL Supplementary Information on Oil and Gas Exploration and Production Activities (Unaudited)<br />
(Millions of US dollars, except as indicated)<br />
Year ended December 31, 2009 International Russia<br />
Revenue<br />
Total consolidated<br />
companies<br />
Group’s share in<br />
equity companies<br />
Sales 1,472 13,870 15,342 824<br />
Transfers – 11,850 11,850 17<br />
Total revenues 1,472 25,720 27,192 841<br />
Production costs<br />
(excluding production taxes) (195) (2,592) (2,787) (98)<br />
Exploration expense (147) (71) (218) (10)<br />
Depreciation, depletion, and amortization,<br />
and valuation provision (323) (2,278) (2,601) (105)<br />
Taxes other than income taxes (206) (12,830) (13,036) (186)<br />
Related income taxes (198) (1,399) (1,597) (203)<br />
Total results of operations for producing<br />
activities 403 6,550 6,953 239<br />
IV. Reserve quantity information<br />
Proved reserves are the estimated quantities of oil and gas<br />
reserves which geological and engineering data demonstrate<br />
will be recoverable with reasonable certainty in future<br />
years from known reservoirs under existing economic<br />
and operating conditions. In accordance with Topic 932 of<br />
the Codification existing economic and operating conditions<br />
are based on the 12-months average price and the yearend<br />
costs. Proved reserves do not include additional quantities<br />
of oil and gas reserves that may result from applying<br />
secondary or tertiary recovery techniques not yet tested<br />
and determined to be economic.<br />
Proved developed reserves are the quantities of proved<br />
reserves expected to be recovered through existing wells<br />
with existing equipment and operating methods.<br />
Due to the inherent uncertainties and the necessarily limited<br />
nature of reservoir data, estimates of reserves are inherently<br />
imprecise, require the application of judgment and<br />
are subject to change as additional information becomes<br />
available.<br />
Management has included within proved reserves significant<br />
quantities which the Group expects to produce after<br />
the expiry dates of certain of its current production licenses<br />
in the Russian Federation. The Subsoil Law of the Russian<br />
Federation states that, upon expiration, a license is subject<br />
to renewal at the initiative of the license holder provided<br />
that further exploration, appraisal, production or remediation<br />
activities are necessary and provided that the license<br />
holder has not violated the terms of the license. Since<br />
the law applies both to newly issued and old licenses and<br />
the Group has currently renewed nearly 50% of its licenses,<br />
management believes that licenses will be renewed upon<br />
their expiration for the remainder of the economic life of each<br />
respective field.<br />
183
OAO LUKOIL Supplementary Information on Oil and Gas Exploration and Production Activities (Unaudited)<br />
(Millions of US dollars, except as indicated)<br />
Estimated net proved oil and gas reserves and changes thereto for the years ended December 31, 2011, 2010 and 2009,<br />
are shown in the tables set out below.<br />
Millions of barrels<br />
Crude oil<br />
Consolidated subsidiaries<br />
International Russia Total<br />
Group’s share<br />
in equity<br />
companies<br />
January 1, 2009 404 13,838 14,242 216<br />
Revisions of previous estimates (85) (636) (721) 15<br />
Purchase of hydrocarbons in place – 39 39 102<br />
Extensions and discoveries 37 503 540 –<br />
Production (27) (673) (700) (20)<br />
Sales of reserves – (17) (17) –<br />
December 31, 2009 329 13,054 13,383 313<br />
Revisions of previous estimates (4) (292) (296) (5)<br />
Purchase of hydrocarbons in place 62 – 62 –<br />
Extensions and discoveries 10 550 560 10<br />
Production (26) (658) (684) (24)<br />
December 31, 2010 371 12,654 13,025 294<br />
Revisions of previous estimates (12) 233 221 7<br />
Purchase of hydrocarbons in place – 7 7 –<br />
Extensions and discoveries 4 515 519 1<br />
Production (26) (623) (649) (22)<br />
December 31, 2011 337 12,786 13,123 280<br />
Proved developed reserves<br />
December 31, 2009 186 8,442 8,628 199<br />
December 31, 2010 207 8,401 8,608 182<br />
December 31, 2011 197 8,397 8,594 178<br />
The minority interest share included in the above total<br />
proved reserves was 163 million barrels, 187 million barrels<br />
and 242 million barrels as of December 31, 2011, 2010 and<br />
2009, respectively. The minority interest share included in<br />
the above proved developed reserves was 96 million barrels,<br />
132 million barrels and135 million barrels as of December 31,<br />
2011, 2010 and 2009, respectively. Substantially all minority<br />
interests relate to the reserves in the Russian Federation.<br />
184
OAO LUKOIL Supplementary Information on Oil and Gas Exploration and Production Activities (Unaudited)<br />
(Millions of US dollars, except as indicated)<br />
Billions of cubic feet<br />
Natural gas<br />
Consolidated subsidiaries<br />
International Russia Total<br />
Group’s share<br />
in equity<br />
companies<br />
January 1, 2009 6,806 22,273 29,079 174<br />
Revisions of previous estimates (294) (6,081) (6,375) (3)<br />
Purchase of hydrocarbons in place – 13 13 130<br />
Extensions and discoveries 294 164 458 –<br />
Production (175) (436) (611) (15)<br />
December 31, 2009 6,631 15,933 22,564 286<br />
Revisions of previous estimates (35) 1,214 1,179 11<br />
Extensions and discoveries 98 226 324 4<br />
Production (187) (540) (727) (26)<br />
December 31, 2010 6,507 16,833 23,340 275<br />
Revisions of previous estimates (487) 273 (214) 25<br />
Purchase of hydrocarbons in place – 1 1 –<br />
Extensions and discoveries 240 309 549 1<br />
Production (189) (565) (754) (27)<br />
December 31, 2011 6,071 16,851 22,922 274<br />
Proved developed reserves<br />
December 31, 2009 2,002 5,636 7,638 157<br />
December 31, 2010 2,715 6,024 8,739 143<br />
December 31, 2011 3,250 6,065 9,315 163<br />
The minority interest share included in the above total<br />
proved reserves was 32 billion cubic feet, 31 billion cubic feet<br />
and 36 billion cubic feet as of December 31, 2011, 2010 and<br />
2009, respectively. The minority interest share included in the<br />
above proved developed reserves was 22 billion cubic feet,<br />
21 billion cubic feet and 23 billion cubic feet as of December<br />
31, 2011, 2010 and 2009, respectively. Substantially all minority<br />
interests relate to the reserves in the Russian Federation.<br />
185
OAO LUKOIL Supplementary Information on Oil and Gas Exploration and Production Activities (Unaudited)<br />
(Millions of US dollars, except as indicated)<br />
V. Standardized measure of discounted future net cash flows<br />
The standardized measure of discounted future net cash<br />
flows, related to the above oil and gas reserves, is calculated<br />
in accordance with the requirements of Topic 932 of the<br />
Codification. Estimated future cash inflows from production<br />
are computed by applying the 12-months average price<br />
for oil and gas to year-end quantities of estimated net<br />
proved reserves. Adjustments in this calculation for future<br />
price changes are limited to those required by contractual<br />
arrangements in existence at the end of each reporting year.<br />
Future development and production costs are those estimated<br />
future expenditures necessary to develop and produce<br />
year-end estimated proved reserves based on year-end<br />
cost indices, assuming continuation of year-end economic<br />
conditions. Estimated future income taxes are calculated<br />
by applying appropriate year-end statutory tax rates. These<br />
rates reflect allowable deductions and tax credits and are<br />
applied to estimated future pre-tax net cash flows, less the<br />
tax bases of related assets. Discounted future net cash flows<br />
have been calculated using a ten percent discount factor.<br />
Discounting requires a year-by-year estimate of when future<br />
expenditures will be incurred and when reserves will be produced.<br />
The information provided in the tables set out below does<br />
not represent management’s estimate of the Group’s expected<br />
future cash flows or of the value of the Group’s proved<br />
oil and gas reserves. Estimates of proved reserve quantities<br />
are imprecise and change over time as new information<br />
becomes available. Moreover, probable and possible<br />
reserves, which may become proved in the future, are excluded<br />
from the calculations. The arbitrary valuation, prescribed<br />
under Topic 932 of the Codification, requires assumptions<br />
as to the timing and amount of future development<br />
and production costs. The calculations should not<br />
be relied upon as an indication of the Group’s future cash<br />
flows or of the value of its oil and gas reserves.<br />
Group’s share<br />
As of December 31, 2011 International Russia<br />
Total consolidated<br />
companies<br />
in equity<br />
companies<br />
Future cash inflows 51,665 616,290 667,955 25,773<br />
Future production and development<br />
costs (26,242) (416,403) (442,645) (12,897)<br />
Future income tax expenses (6,056) (35,768) (41,824) (2,896)<br />
Future net cash flows 19,367 164,119 183,486 9,980<br />
Discount for estimated timing<br />
of cash flows (10% p.a.) (10,930) (97,394) (108,324) (5,145)<br />
Discounted future net cash flows 8,437 66,725 75,162 4,835<br />
Minority share in discounted future<br />
net cash flows – 937 937 –<br />
186
OAO LUKOIL Supplementary Information on Oil and Gas Exploration and Production Activities (Unaudited)<br />
(Millions of US dollars, except as indicated)<br />
As of December 31, 2010 International Russia<br />
Total consolidated<br />
companies<br />
Group’s share<br />
in equity<br />
companies<br />
Future cash inflows 40,871 432,401 473,272 18,629<br />
Future production and development costs (23,193) (313,375) (336,568) (9,503)<br />
Future income tax expenses (3,843) (19,775) (23,618) (2,107)<br />
Future net cash flows 13,835 99,251 113,086 7,019<br />
Discount for estimated timing<br />
of cash flows (10% p.a.) (8,641) (60,808) (69,449) (3,656)<br />
Discounted future net cash flows 5,194 38,443 43,637 3,363<br />
Minority share in discounted future<br />
net cash flows – 963 963 –<br />
Group’s share<br />
As of December 31, 2009 International Russia<br />
Total consolidated<br />
companies<br />
in equity<br />
companies<br />
Future cash inflows 31,025 385,266 416,291 14,816<br />
Future production and development costs (18,778) (254,811) (273,589) (7,692)<br />
Future income tax expenses (2,337) (22,285) (24,622) (1,489)<br />
Future net cash flows 9,910 108,170 118,080 5,635<br />
Discount for estimated timing<br />
of cash flows (10% p.a.) (6,468) (66,015) (72,483) (3,013)<br />
Discounted future net cash flows 3,442 42,155 45,597 2,622<br />
Minority share in discounted future<br />
net cash flows – 1,370 1,370 –<br />
187
OAO LUKOIL Supplementary Information on Oil and Gas Exploration and Production Activities (Unaudited)<br />
(Millions of US dollars, except as indicated)<br />
VI. Principal sources of changes in the standardized measure<br />
of discounted future net cash flows<br />
Consolidated companies 2011 2010 2009<br />
Discounted present value as at January 1 43,637 45,597 42,570<br />
Net changes due to purchases and sales of minerals<br />
in place 39 (193) 86<br />
Sales and transfers of oil and gas produced,<br />
net of production costs (13,520) (12,454) (11,151)<br />
Net changes in prices and production costs estimates 69,089 22,241 36,633<br />
Net changes in mineral extraction taxes (32,678) (23,976) (27,376)<br />
Extensions and discoveries, less related costs 3,492 1,886 1,878<br />
Previously estimated development cost incurred<br />
during the period 6,182 5,565 3,201<br />
Revisions of previous quantity estimates 620 (433) (4,495)<br />
Net change in income taxes (7,467) 407 (1,104)<br />
Other changes 229 (141) 70<br />
Accretion of discount 5,539 5,138 5,285<br />
Discounted present value at December 31 75,162 43,637 45,597<br />
Group’s share in equity companies 2011 2010 2009<br />
Discounted present value as at January 1 3,363 2,622 1,006<br />
Net changes due to purchases and sales of minerals<br />
in place – – 1,182<br />
Sales and transfers of oil and gas produced,<br />
net of production costs (1,203) (927) (547)<br />
Net changes in prices and production costs estimates 3,820 2,296 2,129<br />
Net changes in mineral extraction taxes (1,720) (985) (1,086)<br />
Extensions and discoveries, less related costs 8 53 3<br />
Previously estimated development cost incurred<br />
during the period 66 120 31<br />
Revisions of previous quantity estimates 179 (56) 137<br />
Net change in income taxes (365) (294) (442)<br />
Other changes 267 234 95<br />
Accretion of discount 420 300 114<br />
Discounted present value at December 31 4,835 3,363 2,622<br />
188
Management’s discussion<br />
and analysis of financial<br />
condition and results<br />
of operations
The following report contains a discussion and analysis of the<br />
financial condition of OAO LUKOIL as of December 31, 2011<br />
and the results of it’s operations for each of the years ended<br />
December 31, 2011, 2010 and 2009, and significant factors<br />
that may affect its future performance. It should be read in<br />
conjunction with our US GAAP consolidated financial statements<br />
and notes and supplemental oil and gas disclosure.<br />
References to “LUKOIL,” “the Company,” “the Group,” “we”<br />
or “us” are references to OAO LUKOIL and its subsidiaries<br />
and equity affiliates. All dollar amounts are in millions of<br />
US dollars, unless otherwise indicated. Tonnes of crude oil<br />
produced are translated into barrels using conversion rates<br />
characterizing the density of oil from each of our oilfields.<br />
Tonnes of crude oil purchased as well as other operational<br />
indicators expressed in barrels were translated into barrels<br />
using an average conversion rate of 7.33 barrels per tonne.<br />
Translations of cubic meters to cubic feet were made at the<br />
rate of 35.31 cubic feet per cubic meter. Translations of barrels<br />
of crude oil into barrels of oil equivalent (“BOE”) were made<br />
at the rate of 1 barrel per BOE and of cubic feet into BOE at<br />
the rate of 6 thousand cubic feet per BOE.<br />
This report includes forward-looking statements – words<br />
such as “believes,” “anticipates,” “expects,” “estimates,”<br />
“intends,” “plans,” etc. – that reflect management’s current<br />
estimates and beliefs, but are not guarantees of future<br />
results. Please see “Forward-looking statement” on page<br />
229 for a discussion of some factors that could cause actual<br />
results to differ materially.<br />
Key financial and operational results<br />
2011<br />
Change to<br />
2010, % 2010<br />
Change to<br />
2009, % 2009<br />
Sales (millions of US dollars) 133,650 27.3 104,956 29.4 81,083<br />
Net income attributable to OAO LUKOIL<br />
(millions of US dollars) 10,357 15.0 9,006 28.5 7,011<br />
Adjusted net income attributable to OAO LUKOIL<br />
(millions of US dollars) (1) 11,312 25.6 9,006 28.5 7,011<br />
EBITDA (millions of US dollars) 18,606 15.9 16,049 19.1 13,475<br />
Adjusted EBITDA (millions of US dollars) (1) 19,489 21.4 16,049 19.1 13,475<br />
Taxes other than income taxes, excise and export tariffs<br />
(millions of US dollars) (35,135) 26.1 (27,856) 42.6 (19,532)<br />
Earning per share of common stock attributable to<br />
OAO LUKOIL (US dollars):<br />
Basic 13.30 21.4 10,95 32.2 8.28<br />
Diluted 13.04 19.1 10,94 32.1 8.28<br />
Hydrocarbon production by the Group including<br />
our share in equity affiliates (thousands of BOE) 780,980 (4.4) 817,335 1.2 807,301<br />
Crude oil production by the Group including<br />
our share in equity affiliates (thousands of tonnes) 90,917 (5.3) 95,992 (1.7) 97,615<br />
Gas available for sale produced by the Group including<br />
our share in equity affiliates (millions of cubic meters) 18,621 0.4 18,554 24.5 14,898<br />
Refined products produced by the Group including<br />
our share in equity affiliates (thousands of tonnes) 62,667 (1.7) 63,770 6.2 60,057<br />
Hydrocarbon proved reserves including<br />
our share in equity affiliates (millions of BOE) 17,269 0.1 17,255 (1.4) 17,504<br />
(1)<br />
Adjusted for the impairment loss in OOO Narianmarneftegaz (see page 192 for details).<br />
190
In 2011, our net income was $10,357 million, which is $1,351<br />
million, or 15.0%, more than in 2010. At the same time,<br />
our net income for the fourth quarter of 2011 amounted<br />
to $1,345 million, which is $841 million, or 38.5%, less than in<br />
the fourth quarter of 2010.<br />
The increase in our net income was mainly due to an increase<br />
in hydrocarbon prices in 2011, compared to the previous<br />
year. At the same time, our results were influenced<br />
by an increasing tax burden and the appreciation of the<br />
Russian ruble. Moreover, our net income for 2011 was<br />
materially affected by impairment loss in OOO Narianmarneftegaz<br />
in amount of $955 million net of tax and noncontrolling<br />
interest effect, recognized in the fourth quarter<br />
of 2011. On the contrary, in 2010, our net income included<br />
non-routine gains and losses in the net amount of<br />
$132 million gain.<br />
Business overview<br />
The primary activities of OAO LUKOIL and its subsidiaries<br />
are oil exploration, production, refining, marketing and<br />
distribution. The Company is the ultimate parent entity of<br />
a vertically integrated group of companies.<br />
OAO LUKOIL was established in accordance with Presidential<br />
Decree 1403, issued on November 17, 1992. Under this decree,<br />
on April 5, 1993, the Government of the Russian Federation<br />
transferred to the Company 51% of the voting shares of<br />
fifteen enterprises. Under Government Resolution 861<br />
issued on September 1, 1995, a further nine enterprises<br />
were transferred to the Group during 1995. Since 1995, the<br />
Group has carried out a share exchange program to increase<br />
its shareholding in each of 24 founding subsidiaries to 100%.<br />
From formation, the Group has expanded substantially<br />
through consolidation of interests, acquisition of new companies<br />
and establishment of new businesses. Now LUKOIL<br />
is a global energy company operating through its subsidiaries<br />
in 37 countries on four continents.<br />
LUKOIL is one of the world’s largest energy companies in<br />
terms of hydrocarbon reserves that amounted to 17.3 billion<br />
BOE as of January 1, 2012 and comprised of 13.4 billion<br />
barrels of crude oil and 23.2 trillion cubic feet of gas.<br />
Our operations are divided into four main business segments:<br />
• Exploration and Production — which includes our<br />
exploration, development and production operations<br />
relating to crude oil and gas. These activities are primarily<br />
located within Russia, with additional activities in<br />
Azerbaijan, Kazakhstan, Uzbekistan, the Middle East,<br />
South America, Northern and Western Africa and South-<br />
East Asia.<br />
• Refining, Marketing and Distribution – which includes<br />
refining and transport operations, marketing and trading<br />
of crude oil, natural gas and refined products.<br />
• Chemicals – which includes processing and trading<br />
of petrochemical products.<br />
• Power generation – which includes generation,<br />
transportation and sales of electricity, heat and related<br />
services.<br />
Each of our four main segments is dependent on the other,<br />
with a portion of the revenues of one segment being a part<br />
of the costs of the other. In particular, our Refining, Marketing<br />
and Distribution segment purchases crude oil from our<br />
Exploration and Production segment. As a result of certain<br />
factors considered in the “Domestic crude oil and refined<br />
products prices” section on page 200, benchmarking crude oil<br />
market prices in Russia cannot be determined with certainty.<br />
Therefore, the prices set for inter-segment purchases of crude<br />
oil reflect a combination of market factors, primarily international<br />
crude oil market prices, transportation costs, regional<br />
market conditions, the cost of crude oil refining and other<br />
factors. Accordingly, an analysis of either of these segments<br />
on a stand-alone basis could give a misleading impression<br />
of those segments’ underlying financial position and results<br />
of operations. For this reason, we do not analyze either of<br />
our main segments separately in the discussion that<br />
follows. However, we present the financial data for each in<br />
Note 21 “Segment information” to the consolidated financial<br />
statements.<br />
Recent developments<br />
and outlook<br />
The following has been achieved in 2011:<br />
Exploration and production<br />
4 new oil and gas fields were brought into production<br />
(2010: 11 oil and gas fields).<br />
At the end of the year, we commenced gas production<br />
within the Gissar project in Uzbekistan, where the annual<br />
natural gas production is expected to reach 1.1 billion cubic<br />
meters.<br />
191
In December, we purchased a 25.1% interest in OOO<br />
“Bashneft-Polus”, a subsidiary of OAO “ANK Bashneft”<br />
(“Bashneft”), owning license and mineral rights for R.<br />
Trebs and A. Titov fields with recoverable oil reserves of<br />
140.1 million tonnes.<br />
Refining<br />
In April, the Group increased its stake in the joint venture<br />
operating the ISAB refining complex (“ISAB”) from 49% to<br />
60%.<br />
In December, the construction of a delayed-coking unit<br />
with annual capacity of 1 million tonnes was completed<br />
at our Volgograd refinery. This increased refining depth<br />
at the refinery to 88%.<br />
Power generation<br />
In April, a 110 MW combined cycle gas turbine (“ССGT”)<br />
unit powered by natural gas was put into operation in<br />
Astrakhan.<br />
These and other achievements in 2011 are described in detail<br />
further in this report.<br />
Changes in the Group<br />
structure<br />
In April 2011, LUKOIL and Bashneft signed an agreement to<br />
establish a joint venture and to stipulate conditions for the<br />
development of two fields named after R. Trebs and A. Titov<br />
located in Northern Timan-Pechora region. According to the<br />
agreement, in the end of December 2011, the Company purchased<br />
a 25.1% interest in OOO “Bashneft-Polus”, a Bashneft<br />
subsidiary, in favor of which the license and mineral rights<br />
for R. Trebs and A. Titov fields were re-issued, for approximately<br />
$153 million. In its turn, the joint venture purchased<br />
from a Group company 29 exploration wells located in the<br />
license area for $60 million. The agreement also envisages<br />
the exploitation of the Group’s infrastructure, including<br />
the oil export terminal in Varandey and the energy centre<br />
of the Yuzhnoye Khylchuyu field. The total recoverable oil<br />
reserves located within the license areas of R. Trebs and<br />
A. Titov fields are 140.1 million tonnes.<br />
In April 2011, the Group acquired an 11% stake in the joint<br />
venture operating the ISAB for €241 million (approximately<br />
$342 million) and thus increased the Group’s ownership in<br />
it from 49% to 60%. This was a partial exercise of ERG S.p.A.<br />
(“ERG”) option to sell its stake in the joint venture, established<br />
in 2008. According to the agreement ERG has a put option<br />
to sell its stake in full. In January 2012, we were offered<br />
to acquire another 20% stake in the refining complex.<br />
The transaction is expected to be completed in the<br />
second quarter of 2012 in the amount of €400 million<br />
(approximately $526 million), except for inventory cost.<br />
The transaction is subject to approval by the European<br />
regulating authorities.<br />
In January 2010, the Company signed an agreement to<br />
develop the West Qurna-2 field located in the south of<br />
Iraq. The parties to the agreement are the Iraqi state-owned<br />
South Oil Company and the contracting consortium formed<br />
by the Iraqi state-owned North Oil Company, the<br />
Company and Norway’s Statoil ASA. The Company’s share<br />
in the project is 56.25%. The West Qurna-2 field has recoverable<br />
crude oil reserves of about 12.9 billion barrels.<br />
As a part of the expansion of its presence in Kazakhstan,<br />
in December 2009, the Group acquired the remaining<br />
46.0% interest in its equity affiliate LUKARCO B.V.<br />
(“LUKARCO”) for $1.6 billion, thereby increasing the ownership<br />
stake to 100%. LUKARCO is a holding company, which<br />
owns a 5.0% share in Tengizchevroil, a joint venture which<br />
develops the Tengiz and Korolevskoe fields in Kazakhstan,<br />
and a 12.5% share in Caspian Pipeline Consortium (“CPC”),<br />
which carries Kazakhstani and Russian oil to Novorossiysk<br />
marine terminal. Therefore, the Group increased the ownership<br />
in Tengizchevroil from 2.7% to 5.0% and the ownership<br />
in CPC from 6.75% to 12.5%. The first installment in<br />
the amount of $300 million was paid in December 2009.<br />
$800 million were paid in December 2010 and the remaining<br />
amount – in December 2011.<br />
Impairment of assets in<br />
OOO Narianmarneftegaz<br />
In 2005, the Company and ConocoPhillips, within their<br />
strategic partnership, established a joined venture based<br />
on a Group subsidiary OOO Narianmarneftegaz (“NMNG”)<br />
to develop oilfields located in Northern Timan-Pechora<br />
region of Russia. The Group’s share in joint venture is 70%,<br />
LUKOIL and ConocoPhillips run NMNG on a 50/50 basis.<br />
In 2008, NMNG commenced commercial production at the<br />
Yuzhnoye Khylchuyu oilfield, joint venture’s major oilfield.<br />
As of December 31, 2008, proved reserves of the oilfield<br />
were estimated to be approximately 505 million barrels.<br />
In 2009 and 2010, the crude oil production from the field<br />
amounted to 7.0 and 6.9 million tonnes, respectively.<br />
In 2010, the production from the oilfield began to decline<br />
due to some unexpected geological reasons and it only<br />
192
eached 3.3 million tonnes in 2011. As of December 31, 2011,<br />
crude oil reserves decreased significantly and amounted<br />
to approximately 142 million barrels. In 2011, as a result of<br />
respective analysis the Company recognized an impairment<br />
loss regarding upstream and other assets of NMNG in<br />
amount of $1,261 million. An impact on our net income net<br />
of ConocoPhillip’s share in the impairment loss and deferred<br />
tax assets write-off amounted to $955 million and an impact<br />
on our EBITDA amounted to $883 million.<br />
Resource base<br />
The table below summarizes the net oil-equivalent proved<br />
reserves of consolidated subsidiaries and our share in<br />
equity affiliates under SEC standards (until the economic<br />
limit of commercial production is reached) that have been<br />
derived or extracted from our reserve reports audited by<br />
Miller and Lents, Ltd., our independent reservoir engineers,<br />
as of January 1, 2012 and 2011.<br />
Changes in 2011<br />
2012 Production (1) (millions of BOE)<br />
changes in structure estimates<br />
2011<br />
Extensions, Revision<br />
January 1,<br />
discoveries and of previous January 1,<br />
Western Siberia 9,711 (439) 307 (18) 9,861<br />
Timan-Pechora 2,550 (134) 97 54 2,533<br />
Ural region 2,169 (100) 22 214 2,033<br />
Volga region 974 (33) 140 22 845<br />
Other in Russia 224 (15) 9 7 223<br />
Outside Russia 1,641 (81) 44 (82) 1,760<br />
Proved oil and gas<br />
reserves 17,269 (802) 619 197 17,255<br />
Probable oil and gas<br />
reserves 8,415 8,455<br />
Possible oil and gas<br />
reserves 3,939 3,167<br />
(1)<br />
Gas production shown before own consumption.<br />
The Company’s proved reserves as of January 1, 2012 amount<br />
to 17,269 million BOE and comprise of 13,403 million barrels<br />
of crude oil and 23,196 billion cubic feet of gas.<br />
In 2011, proved reserves growth as a result of geological<br />
exploration, production drilling and acquisitions, totaled<br />
619 million BOE. Revision of previous estimates contributed<br />
197 million BOE to the increase.<br />
Significant progress was achieved in 2011 in the preparation<br />
and commissioning of a number of new fields of<br />
the Company, which allowed the Group to transfer<br />
170 million BOE from the contingent resources category to<br />
the category of proved reserves. At the same time, rapid<br />
production drop at the Yuzhnoye Khylchuyu oilfield, as<br />
compared to the earlier forecasts, led to a decrease in the<br />
proved reserves by 147 million BOE.<br />
193
Operational highlights<br />
Hydrocarbon production<br />
We undertake exploration for, and production of, crude oil<br />
and natural gas in Russia and internationally. In Russia our<br />
major oil producing subsidiaries are OOO LUKOIL-Western<br />
Siberia, OOO LUKOIL-Komi and OOO LUKOIL-Perm. Also<br />
we have a consolidated joint venture with ConocoPhillips,<br />
OOO Narianmarneftegaz, in the Northern Timan-Pechora<br />
region. Exploration and production outside of Russia is<br />
performed by our 100% subsidiary LUKOIL-Overseas, that<br />
has stakes in PSA’s and other projects in Kazakhstan,<br />
Azerbaijan, Uzbekistan, Iraq, Saudi Arabia, Columbia, Ghana,<br />
Vietnam and Cote d’Ivoire.<br />
The table below summarizes the results of our exploration and production activities.<br />
2011 2010 2009<br />
(thousand BOE per day)<br />
Daily production of hydrocarbons, including the Company’s<br />
share in equity affiliates, including: 2,140 2,239 2,212<br />
- crude oil 1,840 1,940 1,972<br />
- natural and petroleum gas (1) 300 299 240<br />
(US dollar per BOE)<br />
Hydrocarbon extraction expenses 4.71 4.12 3.56<br />
- in Russia 4.70 4.11 3.53<br />
- outside Russia 4.85 4.29 3.99<br />
(millions of US dollars)<br />
Hydrocarbon extraction expenses 3,540 3,241 2,787<br />
- in Russia 3,298 3,023 2,592<br />
- outside Russia 242 218 195<br />
Exploration expenses 532 336 218<br />
- in Russia 93 96 71<br />
- outside Russia 439 240 147<br />
Mineral extraction tax 11,594 7,864 5,452<br />
- in Russia 11,502 7,795 5,399<br />
- outside Russia 92 69 53<br />
(1)<br />
Gas available for sale (excluding gas produced for our own consumption).<br />
Crude oil production. In 2011, our daily crude oil production<br />
decreased to 1,840 thousand barrels, or by 5.2%, compared<br />
to 2010. We produced (including the Company’s<br />
share in equity affiliates) 671.4 million barrels, or 90.9 million<br />
tonnes of crude oil.<br />
194
The following table represents our crude oil production in 2011 and 2010 by major regions.<br />
Change to 2010<br />
(thousands of tonnes) 2011 Total, % Change in structure Organic change 2010<br />
Western Siberia 49,102 (3.6) – (1,832) 50,934<br />
Timan-Pechora 17,547 (17.1) – (3,628) 21,175<br />
Ural region 12,805 3.4 – 420 12,385<br />
Volga region 3,203 9.8 – 287 2,916<br />
Other in Russia 1,952 (3.4) – (69) 2,021<br />
Crude oil produced in Russia 84,609 (5.4) – (4,822) 89,431<br />
Crude oil produced<br />
internationally 3,413 (1.4) – (47) 3,460<br />
Total crude oil produced by<br />
consolidated subsidiaries 88,022 (5.2) – (4,869) 92,891<br />
Our share in crude oil produced<br />
by equity affiliates:<br />
in Russia 357 6.3 – 21 336<br />
outside Russia 2,538 (8.2) – (227) 2 765<br />
Total crude oil produced 90,917 (5.3) – (5,075) 95,992<br />
The main oil producing region for the Company is<br />
Western Siberia where we produced 55.8% of our crude oil<br />
in 2011 (54.8% in 2010 and 55.7% in 2009). In 2011, the<br />
Western Siberian producing assets continued to mature<br />
resulting in a production decline and water cut increase.<br />
The Company undertakes efforts to stabilize production<br />
in the region.<br />
The main reason for the production decrease in Timan-<br />
Pechora was a decrease in wells’ flow rates as a result<br />
of the water cut growth and the decrease of recoverable<br />
reserves related to reconsideration of the geological model<br />
of the Yuzhnoye Khylchuyu oilfield.<br />
In addition to our production, we purchase crude oil in<br />
Russia and on international markets. In Russia we primarily<br />
purchase crude oil from affiliated producing companies<br />
and other producers. Then we either refine or export<br />
purchased crude oil. Crude oil purchased on international<br />
markets is normally used for trading activities, for supplying<br />
our international refineries or for processing at third<br />
party refineries.<br />
2011 2010 2009<br />
(thousand<br />
of barrels)<br />
(thousand<br />
of tonnes)<br />
(thousand<br />
of barrels)<br />
(thousand<br />
of tonnes)<br />
(thousand<br />
of barrels)<br />
(thousand<br />
of tonnes)<br />
Crude oil purchases in Russia 4 010 547 2 243 306 4 442 606<br />
Crude oil purchases<br />
internationally 151 753 20 703 156 759 21 386 150 258 20 499<br />
Total crude oil purchased 155 763 21 250 159 002 21 692 154 700 21 105<br />
Significant part of our crude oil purchases is for processing.<br />
In 2011, we purchased 12,969 thousand tonnes of crude oil<br />
to process at our and at third party refineries, compared<br />
to 12,516 thousand tonnes in 2010.<br />
195
Gas production. In 2011, we produced 18,621 million<br />
cubic meters of gas available for sale (including our share in<br />
equity affiliates), that is approximately on the same level as<br />
in 2010.<br />
Our major gas production field is the Nakhodkinskoe field,<br />
where we produced 8,273 million cubic meters of natural<br />
gas in 2011 (8,146 million cubic meters in 2010). Our<br />
international natural gas production decreased by 1.9%.<br />
Refining, marketing<br />
and trading<br />
Refining. We own and operate four refineries located in<br />
European Russia and three refineries located outside of<br />
Russia – in Bulgaria, Ukraine and Romania. Moreover, we<br />
have a 60% stake in the ISAB refinery complex in Italy<br />
(49% before April 1, 2011) and a 45% interest in the TRN<br />
refinery in the Netherlands.<br />
Compared to 2010, production at our consolidated refineries<br />
decreased by 3.2%. Russian refineries decreased their<br />
production by 0.2%, while international refineries’ production<br />
decreased by 17.1% mainly as a result of the shutdown<br />
of the Odessa refinery. The production of our affiliated<br />
refineries ISAB and TRN increased by 5.5% resulting from<br />
the increase of Group’s share in the ISAB refinery.<br />
We invested, and continue to invest, significant resources<br />
in our refineries aiming at taking the leading position<br />
in Russia in producing ecological fuel of high quality<br />
standards. Thus, in December 2010, we launched a catalytic<br />
cracking complex at our refinery in Nizhny Novgorod that<br />
enabled us to start production of gasoline fully compliant<br />
to the Euro-4 quality standard. Related investments<br />
amounted to approximately $1 billion. In December 2011,<br />
we completed construction of a delayed-coking unit with<br />
annual capacity of 1 million tonnes at our Volgograd refinery<br />
increasing refining depth to 88%.<br />
In Russia, LUKOIL holds the leading position in production<br />
and sales of European standards motor fuel being ahead<br />
of the official terms of their obligatory implementation<br />
in the country. At our Russian refineries we produced<br />
8,701, 8,429 and 7,266 thousand tonnes of Euro-4 and -5<br />
diesel fuel and 6,416, 5,373, and 4,746 thousand tonnes<br />
of Euro-3, -4 and -5 gasoline in 2011, 2010 and 2009, respectively.<br />
We commenced production of Euro-5 gasoline<br />
in the end of 2010.<br />
The share of Euro-3 and Euro-4 gasoline exceeds 90% and<br />
the share of Euro-4 and Euro-5 diesel exceeds 70% of our<br />
total domestic production. We have technological capacity<br />
to produce all our gasoline in compliance with the Euro-4<br />
standards. Production of lower quality gasoline is stipulated<br />
by the necessity to supply the federal customers. We will<br />
be able to increase the share of Euro-4 and Euro-5 diesel<br />
to 97% of our total domestic diesel production after the<br />
launch of the new fuel hydrorefining unit at Volgograd<br />
refinery scheduled for the second half of 2012.<br />
Along with our own production of refined products we<br />
can refine crude oil at third party refineries depending on<br />
market conditions and other factors. Before 2010, we<br />
processed crude oil at third party refineries in Russia,<br />
Belarus and Serbia primarily to supply our networks in the<br />
Ural region of Russia and in Eastern Europe, as well as for<br />
export sales. Starting from 2010, we sell our crude oil to<br />
the refineries in Ural region and purchase refined products<br />
from them. In the end of 2009, we also ceased crude oil refining<br />
in Belarus due to certain amendments in the customs<br />
legislation. In the third quarter of 2010, we began refining<br />
our crude oil at a third party refinery in Kazakhstan.<br />
196
The following table summarizes key figures for our refining activities.<br />
2011 2010 2009<br />
(millions of US dollars)<br />
Refining expenses at the Group refineries 1,444 1,121 923<br />
- in Russia 1,112 806 671<br />
- outside Russia 332 315 252<br />
Refining expenses at ISAB and TRN 890 719 543<br />
Refining expenses at third party refineries 7 5 170<br />
Capital expenditures 783 702 828<br />
- in Russia 586 542 520<br />
- outside Russia 197 160 308<br />
(thousand barrels per day)<br />
Refinery throughput at the Group refineries 1,073 1,107 1,103<br />
- in Russia 909 908 893<br />
- outside Russia 164 199 210<br />
Refinery throughput at ISAB and TRN (1) (2) 230 222 155<br />
Refinery throughput at third party refineries 5 2 77<br />
Total refinery throughput 1,308 1,331 1,335<br />
(thousands of tonnes)<br />
Refined products produced at the Group refineries 51,055 52,762 52,376<br />
- in Russia 43,248 43,346 42,586<br />
- outside Russia 7,807 9,416 9,790<br />
Production of ISAB and TRN (1) 11,612 11,008 7,681<br />
Refined products produced at third party refineries 256 107 3,485<br />
Total refined products produced 62,923 63,877 63,542<br />
(1)<br />
Group’s share.<br />
(2)<br />
Including refined product processed.<br />
Marketing and trading. Our marketing and trading activities<br />
mainly include wholesale and bunkering operations in<br />
Western Europe, South-East Asia, Central America and retail<br />
operations in the USA, Central and Eastern Europe, the Baltic<br />
States and other regions. In Russia we purchase refined<br />
products on occasion, primarily to manage supply chain<br />
bottlenecks.<br />
The Group retails its refined products in 26 countries through<br />
nearly 5.7 thousand petrol stations. Most of the stations<br />
operate under the LUKOIL brand. Due to the restructuring<br />
of our retail network in the USA, the number of petrol<br />
stations decreased compared to the beginning of the year<br />
(over 6 thousand stations).<br />
197
The table below summarizes figures for our trading activities.<br />
2011 2010 2009<br />
(thousands of tonnes)<br />
Retail sales 15,249 14,336 14,613<br />
Wholesale sales 87,337 91,020 86,147<br />
Total refined products sales 102,586 105,356 100,760<br />
Refined products purchased in Russia 2,026 1,853 625<br />
Refined products purchased internationally 45,655 45,816 41,445<br />
Total refined products purchased 47,681 47,669 42,070<br />
The decrease in wholesale volumes compared to 2010 was<br />
substantially outside of Russia and resulted from the shutdown<br />
of the Odessa refinery. Moreover, the increase in retail<br />
sales on domestic market and increase in Russian refineries’<br />
inventory stock resulted in a decrease in refined<br />
products export from Russia.<br />
Exports of crude oil and refined products from Russia. The volumes of crude oil exported from Russia by our subsidiaries<br />
are summarized as follows:<br />
2011 2010 2009<br />
(thousands<br />
of barrels)<br />
(thousands<br />
of tonnes<br />
(thousands<br />
of barrels)<br />
(thousands<br />
of tonnes<br />
(thousands<br />
of barrels)<br />
(thousands<br />
of tonnes<br />
Exports of crude oil using Transneft<br />
export routes 215,605 29,414 231,525 31,586 241,890 33,000<br />
Exports of crude oil bypassing Transneft 38,739 5,285 65,999 9,004 66,109 9,019<br />
Total crude oil exports 254,344 34,699 297,524 40,590 307,999 42,019<br />
In 2011, our export of crude oil from Russia decreased by<br />
14.5%, compared to 2010, and we exported 41.0% of our<br />
total domestic crude oil production (45.4% in 2010).<br />
The reduction of our export was largely caused by a decline<br />
in production (mainly from Yuzhnoye Khylchuyu oilfield).<br />
In 2011 and 2010, almost all of the volume of crude oil exported<br />
bypassing Transneft was routed through our own export<br />
infrastructure.<br />
In 2011, we exported from Russia 24.0 million tonnes of<br />
refined products, a decrease of 6.9%, compared to 2010,<br />
mostly due to the increase of domestic sales volumes.<br />
Primarily, we export from Russia diesel fuel, fuel oil and gasoil.<br />
These products account for approximately 89% of our<br />
refined products export volumes.<br />
In 2011, our revenue from export of crude oil and refined<br />
products from Russia both to Group companies and third<br />
parties amounted to $25,022 million and $17,725 million,<br />
respectively ($22,178 million for crude oil and $14,088 million<br />
for refined products in 2010).<br />
Power generation<br />
In 2011, we continued to develop the new power generation<br />
sector of our business as part of our strategic<br />
development program. This new sector encompasses all<br />
aspects of the power generation business, from generation<br />
to transmission and sale of heat and electrical power.<br />
Our power generation business sector now includes<br />
OOO LUKOIL-Volgogradenergo, OOO LUKOIL-Volgogradteploenergo,<br />
OOO LUKOIL-Kubanenergo, OOO LUKOIL-<br />
Astrakhanenergo, OOO LUKOIL-Rostovenergo, OOO LUKOIL-<br />
Stavropolenergo, OOO LUKOIL-TTK (all spun off from<br />
OOO UGK TGK-8), ООО LUKOIL-Ecoenergo (former OOO<br />
UGK TGK-8), our own power generating facilities at our<br />
198
oil and gas fields and power generators in Bulgaria,<br />
Romania and Ukraine. Our total output of electrical energy<br />
was 12.6 billion kW-h in 2011 and 13.2 billion kW-h in 2010.<br />
Our total output of heat energy was approximately<br />
15.2 million Gcal in 2011 (15.3 million Gcal in 2010).<br />
In April 2011, we commissioned the ССGT unit with<br />
a capacity of 110 MW in Astrakhan.The CCGT unit utilizes<br />
natural gas as primary and backup fuel. LUKOIL invested over<br />
$150 million in the project.<br />
In 2011, we completed the construction of the CCGT unit<br />
with a capacity of 410 MW in Krasnodar. The turbine is in<br />
standby mode. The new unit increases the installed electric<br />
capacity of power plant in Krasnodar to 1,090 MW.<br />
In 2012, we began construction of another two CCGT units<br />
in Astrakhan with a combined capacity of 235 MW.<br />
The completion is scheduled for the third quarter of 2013.<br />
Main macroeconomic factors affecting our results of operations<br />
Changes in the price of crude oil<br />
and refined products<br />
The price at which we sell crude oil and refined products<br />
is the primary driver of the Group’s revenues. During 2011,<br />
the Brent crude oil price fluctuated between $93 and<br />
$126 per barrel and reached its peak of $126.7 in the beginning<br />
of April of 2011.<br />
by speculative factors as a consequence of political instability<br />
in the Middle East and Northern Africa. In the third quarter<br />
of 2011, crude oil prices stabilized, however financial tensions<br />
in Europe and the USA caused some price correction.<br />
Substantially all the crude oil the Group exports is Urals<br />
blend. The following table shows the average crude oil and<br />
refined product prices in 2011, 2010 and 2009.<br />
The crude oil price growth that started in December 2010<br />
and continued during the first half of 2011 was caused mainly<br />
2011<br />
Change to<br />
2010, % 2010<br />
Change to<br />
2009, % 2009<br />
(in US dollars per barrel, except for figures in percent)<br />
Brent crude 111.26 39.9 79.50 28.9 61.67<br />
Urals crude<br />
(CIF Mediterranean) (1) 109.10 39.4 78.29 27.9 61.22<br />
Urals crude<br />
(CIF Rotterdam) (1) 109.08 39.4 78.26 28.0 61.15<br />
(in US dollars per metric tonne, except for figures in percent)<br />
Fuel oil 3.5%<br />
(FOB Rotterdam) 609.51 37.8 442.35 28.0 345.72<br />
Diesel fuel 10 ppm<br />
(FOB Rotterdam) 958.73 39.3 688.46 28.7 534.84<br />
High-octane gasoline<br />
(FOB Rotterdam) 984.12 33.9 735.24 27.0 579.01<br />
Source: Platts.<br />
(1)<br />
The Company sells crude oil on foreign markets on various delivery terms. Thus, our average realized sale price of oil on international<br />
markets differs from the average prices of Urals blend on Mediterranean and Northern Europe markets.<br />
199
Domestic crude oil and refined<br />
products prices<br />
Substantially all crude oil produced in Russia is produced<br />
by vertically integrated oil companies such as ours. As a<br />
result, most transactions are between affiliated entities<br />
within vertically integrated groups. Thus, there is no concept<br />
of a benchmark domestic market price for crude oil. The<br />
price of crude oil that is produced but not refined or<br />
exported by one of the vertically integrated oil companies is<br />
generally determined on a transaction-by-transaction basis<br />
against a background of world market prices, but with no<br />
direct reference or correlation. At any time there may exist<br />
significant price differences between regions for similar<br />
quality crude oil as a result of the competition and economic<br />
conditions in those regions.<br />
Domestic prices for refined products are determined to<br />
some extent by world market prices, but they are also<br />
directly affected by local demand and competition.<br />
The table below represents average domestic wholesale prices of refined products in 2011, 2010 and 2009.<br />
2011<br />
Change to<br />
2010, % 2010<br />
Change to<br />
2009, % 2009<br />
(in US dollars per metric tonne, except for figures in percent)<br />
Fuel oil 318.99 30.1 245.27 51.3 162.12<br />
Diesel fuel 760.53 36.5 557.36 20.5 462.65<br />
High-octane gasoline (Regular) 857.70 20.1 714.26 22.1 584.87<br />
High-octane gasoline (Premium) 897.81 20.8 743.17 16.8 636.24<br />
Source: InfoTEK (excluding VAT).<br />
Changes in the US dollar-ruble exchange<br />
rate and inflation<br />
A substantial part of our revenue is either denominated<br />
in US dollars or is correlated to some extent with US dollar<br />
crude oil prices, while most of our costs in the Russian<br />
Federation are settled in Russian rubles. Therefore, ruble<br />
inflation and movements of exchange rates can significantly<br />
affect the results of our operations. In particular, the<br />
appreciation of the ruble against the US dollar generally<br />
causes our costs to increase in US dollar terms, and vice<br />
versa. The devaluation of the purchasing power of the<br />
US dollar in the Russian Federation calculated on the basis<br />
of the ruble-dollar exchange rates and the level of inflation<br />
in Russia was 12.0% in 2011, compared to 2010.<br />
The following table gives data on inflation in Russia and the change in the ruble-dollar exchange rate.<br />
2011 2010 2009<br />
Ruble inflation (CPI), % 6.1 8.7 8.9<br />
Change of the ruble-dollar exchange rate, % 5.6 0.8 2.9<br />
Average exchange rate for the period<br />
(ruble to US dollar) 29.39 30.37 31.72<br />
Exchange rate at the end of the period<br />
(ruble to US dollar) 32.20 30.48 30.24<br />
200
Tax burden<br />
Given the relative size of our activities in Russia, our tax<br />
profile is largely determined by the taxes payable in Russia<br />
(based on records maintained under Russian legislation –<br />
not US GAAP). In 2011, 2010 and 2009, the tax charge on the<br />
operations in Russia was approximately 88%, 85% and 81%<br />
of our total tax charge, respectively.<br />
Apart of income tax, fundamental taxes specific to the oil<br />
industry in Russia are mineral extraction tax, excise and<br />
export tariffs. In addition to above mentioned taxes, we are<br />
subject to a number of other taxes in Russia, including social<br />
taxes, property tax, VAT and other local and regional taxes.<br />
The effective rates of total taxes and tariffs (total taxes,<br />
including income taxes, taxes other than on income and<br />
excise and export tariffs, divided by income before taxes<br />
and tariffs) for 2011, 2010 and 2009, respectively, were 77%,<br />
77% and 75%. In 2011, tax expenses in Russia were about<br />
52% of the domestic and export sales revenue of Russian<br />
companies of the Group.<br />
The measures that we use for tax planning and management<br />
strategies have been based on our understanding<br />
of tax legislation existing at the time of implementation<br />
of these measures. We are subject to tax authority audits on<br />
an ongoing basis, as is normal in the Russian environment,<br />
and, at times, the authorities have attempted to impose<br />
significant additional taxes on us. We believe that we have<br />
adequately met and provided for tax liabilities based on<br />
our interpretation of existing tax legislation. However, the<br />
relevant authorities may have differing interpretations and<br />
the effects could be significant.<br />
The following table represents average enacted rates for taxes specific to the oil industry in Russia for the respective periods.<br />
2011 (1) 2010, % 2010 (1) 2009, % 2009 (1)<br />
Change to<br />
Change to<br />
Export tariffs on crude oil $/tonne 409.19 49.6 273.55 52.0 179.93<br />
Export tariffs on refined products<br />
Middle distillates (jet fuel), diesel fuel<br />
$/tonne 274.27 39.5 196.60 47.2 133.54<br />
and gasoils<br />
Light distillates<br />
gasoline $/tonne 341.94 73.9 196.60 47.2 133.54<br />
straight-run gasoline $/tonne 333.08 69.4 196.60 47.2 133.54<br />
Liquid fuels (fuel oil) $/tonne 208.46 96.8 105.91 47.2 71.93<br />
Mineral extraction tax<br />
Crude oil RUR/tonne 4,456.54 44.9 3,075,76 33.6 2,302.85<br />
Natural gas RUR/1,000 m 3 237.00 61.2 147.00 – 147.00<br />
(1)<br />
Average values.<br />
Tax rates set in rubles and translated at the average exchange rates are as follows:<br />
2011 (1) 2010, % 2010 (1) 2009, % 2009 (1)<br />
Change to<br />
Change to<br />
Mineral extraction tax<br />
Crude oil $/tonne 151.65 49.7 101.28 39.5 72.59<br />
Natural gas $/1,000 m 3 8.06 66.5 4.84 4.5 4.63<br />
(1)<br />
Average values.<br />
The rates of taxes specific to the oil industry in Russia are linked to international crude oil prices and are changed in line with<br />
them. The methods to determine the rates for such taxes are presented below.<br />
201
Crude oil extraction tax rate. The base rate is 419 rubles<br />
per metric tonne extracted and it is adjusted depending on<br />
the international market price of Urals blend and the ruble<br />
exchange rate. The tax rate is zero when the average Urals<br />
blend international market price for a tax period is less than<br />
or equal to $15.00 per barrel. Each $1.00 per barrel increase<br />
in the international Urals blend price over the threshold<br />
($15.00 per barrel) results in an increase of the tax rate by<br />
$1.61 per tonne extracted (or $0.22 per barrel extracted using<br />
a conversion factor of 7.33).<br />
The base rate for 2012 and 2013 is currently set at<br />
446 rubles and 470 rubles per metric tonne extracted,<br />
respectively. However, the rate may be amended by the authorities<br />
later on.<br />
The crude oil extraction tax rate varies depending on the<br />
development and depletion of a particular oilfield. The<br />
tax rate is zero for extra-heavy crude oil and for crude oil<br />
produced in certain regions of Eastern Siberia, the Caspian<br />
Sea and the Nenetsky Autonomous District, depending on<br />
the period and volume of production.<br />
The Group benefited from the application of zero tax rate<br />
to crude oil produced from certain greenfields in the<br />
Nenetsky Autonomous District, the major of which was the<br />
Yuzhnoye Khylchuyu oilfield. However, in early December<br />
2010, we exceeded the accumulated production limit of<br />
15 million tonnes at this field eligible for the incentive.<br />
Thus, starting from December 2010, we pay mineral extraction<br />
tax at a regular rate at the Yuzhnoye Khylchuyu oilfield.<br />
The Group also produces crude oil from several greenfields<br />
in the Caspian Sea. In 2011, the amount of incentive was<br />
relatively insignificant, but we expect it to become sizable as<br />
the production volumes grow.<br />
Natural gas extraction tax rate. The mineral extraction<br />
tax on natural gas production is calculated using a flat rate.<br />
In 2009, the rate per thousand cubic meters of natural gas<br />
extracted was 147 rubles. In 2010 and 2011, the rate was<br />
237 rubles. On January 1, 2012, the rate was raised to<br />
251 rubles per thousand cubic meters.<br />
Crude oil export duty rate is calculated on a progressive<br />
scale. The rate is zero when the average Urals blend<br />
international market price is less than or equal to<br />
approximately $15.00 per barrel ($109.50 per metric tonne).<br />
If the Urals blend price is between $15.00 and $20.00 per<br />
barrel ($146.00 per metric tonne), each $1.00 per barrel<br />
increase in the Urals blend price over $15.00 results in an<br />
increase of the crude oil export duty rate by $0.35 per barrel<br />
exported. If the Urals blend price is between $20.00 and<br />
$25.00 per barrel ($182.50 per metric tonne), each $1.00 per<br />
barrel increase in the Urals blend price over $20.00 results<br />
in an increase of the crude oil export duty rate by $0.45 per<br />
barrel exported. Each $1.00 per barrel increase in the Urals<br />
blend price over $25.00 per barrel results in an increase of<br />
the crude oil export duty rate no more than by $0.65 per<br />
barrel exported. Starting from October 1, 2011, the maximum<br />
increase of export duty rate is $0.60 per barrel for each $1.00<br />
per barrel increase in the Urals blend price.<br />
The crude oil export duty rate is revised monthly on the basis<br />
of the immediately preceding one-month period of crude oil<br />
price monitoring.<br />
A special export duty regime is in place for certain greenfields.<br />
Effective from December 2010, the list of the oilfields<br />
where the reduced rate applies also includes our Yu.<br />
Korchagin and V. Filanovsky oilfields located in the Caspian<br />
Sea.<br />
Export duty rates on refined products prior to 2011 were<br />
set by the Russian government. The rate of export duty<br />
depended on internal demand for refined products and<br />
international crude oil market conditions. Starting from<br />
2011, export duty rates on refined products are calculated<br />
by multiplying the current crude oil export duty rate by<br />
a coefficient according to the table below.<br />
202
Before October<br />
1 st , 2011<br />
After October<br />
1 st , 2011<br />
Multiplier for:<br />
Light distillates (except for gasolines), middle distillates (jet fuel), diesel fuel and<br />
gasoils 0.670 0.660<br />
Gasolines (1) 0.467 0.900<br />
Liquid fuels (fuel oil) 0.467 0.660<br />
Motor and other oils 0.467 0.660<br />
Other products 0.467 0.660<br />
(1)<br />
Starting from May 2011, a coefficient for gasoline export duty rate is set at 0.9.<br />
Crude oil and refined products exported to CIS countries,<br />
other than Ukraine, are not subject to export duties.<br />
Excise on refined products. The responsibility to pay excises<br />
on refined products in Russia is imposed on refined product<br />
producers (except for straight-run gasoline). In other countries<br />
where the Group operates, excises are paid either by<br />
producers or retailers depending on the local legislation.<br />
Starting from 2011, excise rates on refined products in Russia<br />
were increased and tied to the ecological class of fuel.<br />
Excise tax rates for 2011, 2010 and 2009 are listed below:<br />
Change to<br />
2010, % 2010<br />
Change to<br />
2009, % 2009<br />
2011<br />
Gasoline<br />
Low-octane gasoline not<br />
compliant to Euro-3 RUR/tonne 5,995.00 105.1 2,923.00 10.0 2,657.00<br />
High-octane gasoline not<br />
compliant to Euro-3 RUR/tonne 5,995.00 50.2 3,992.00 10.0 3,629.00<br />
Euro-3 RUR/tonne 5,672.00 42.1 3,992.00 10.0 3,629.00<br />
Euro-4 and -5 RUR/tonne 5,143.00 28.8 3,992.00 10.0 3,629.00<br />
Diesel fuel<br />
Below Euro-3 RUR/tonne 2,753.00 131.7 1,188.00 10.0 1,080.00<br />
Euro-3 RUR/tonne 2,485.00 109.2 1,188.00 10.0 1,080.00<br />
Euro-4 and -5 RUR/tonne 2,247.00 89.1 1,188.00 10.0 1,080.00<br />
Motor oils RUR/tonne 4,681.00 44.2 3,246.10 10.0 2,951.00<br />
Straight-run gasoline RUR/tonne 6,089.00 41.9 4,290.00 10.0 3,900.00<br />
203
Change to<br />
2010, % 2010<br />
Change to<br />
к 2009, % 2009<br />
2011<br />
Gasoline<br />
Low-octane gasoline not<br />
compliant to Euro-3 RUR/tonne 204.00 111.9 96.25 14.9 83.76<br />
High-octane gasoline not<br />
RUR/tonne 204.00 55.2 131.45 14.9 114.40<br />
compliant to Euro-3<br />
Euro-3 RUR/tonne 193.01 46.8 131.45 14.9 114.40<br />
Euro-4 and -5 RUR/tonne 175.01 33.1 131.45 14.9 114.40<br />
Diesel fuel<br />
Below Euro-3 RUR/tonne 93.68 139.5 39.12 14.9 34.04<br />
Euro-3 RUR/tonne 84.56 116.2 39.12 14.9 34.04<br />
Euro-4 and -5 RUR/tonne 76.46 95.5 39.12 14.9 34.04<br />
Motor oils RUR/tonne 159.29 49.0 106.89 14.9 93.02<br />
Straight-run gasoline RUR/tonne 207.20 46.7 141.26 14.9 122.94<br />
Income tax. Starting from January 1, 2009, the Federal<br />
income tax rate is 2.0% and the regional income tax rate<br />
varies between 13.5% and 18.0%. The Group’s foreign<br />
operations are subject to taxes at the tax rates applicable to<br />
the jurisdictions in which they operate.<br />
Until January 1, 2012, there were no provisions in the taxation<br />
legislation of the Russian Federation to permit the<br />
Group to reduce taxable profits of a Group company by offsetting<br />
tax losses of another Group company against such<br />
profits. Tax losses may be fully or partially used to offset<br />
taxable profits in the same company in any of the ten years<br />
following the year of loss.<br />
Starting from January 1, 2012, if certain conditions are<br />
met, taxpayers will be able to pay income tax as a consolidated<br />
taxpayers’ group (“CTG”). This allows taxpayers to<br />
offset taxable losses generated by certain participants of<br />
a CTG against taxable profits of other participants of the<br />
CTG. During 2012, certain Group companies are going<br />
to meet legislation requirements and pay income tax as<br />
the CTG.<br />
Losses generated by a taxpayer before joining a CTG are<br />
not available for offset against taxable profits of other participants<br />
of the CTG. However, if a taxpayer leaves a CTG,<br />
such losses again become available for offset against future<br />
profits generated by the same taxpayer. The expiration<br />
period of the losses is extended to take account of<br />
any time spent within a CTG when the losses were unavailable<br />
for use.<br />
Transportation of crude oil and refined<br />
products in Russia<br />
The main Russian crude oil production regions are remote<br />
from the main crude oil and refined products markets.<br />
Therefore, access by crude oil production companies to the<br />
markets is dependent on the extent of diversification of the<br />
transport infrastructure and access to it. As a result, transportation<br />
cost is an important macroeconomic factor affecting<br />
our net income.<br />
Transportation of crude oil produced in Russia to refineries<br />
and export destinations is performed primarily through the<br />
trunk oil pipeline system of state-owned OAO AK Transneft<br />
or by railway transport.<br />
Transportation of refined products in Russia is performed<br />
by railway transport and the pipeline system of<br />
OAO AK Transnefteproduct. The Russian railway infrastructure<br />
is owned and operated by OAO Russian Railways. Both<br />
these companies are state-owned. We transport the major<br />
part of our refined products by railway transport.<br />
In Russia, the gas is mostly sold at the wellhead and then<br />
transported through the Unified Gas Supply System<br />
(“UGSS”). The UGSS is responsible for gathering, transporting,<br />
dispatching and delivering substantially all natural gas<br />
supplies in Russia and is owned and operated by OAO<br />
Gazprom (“Gazprom”). The Federal Service for Tariffs of the<br />
Russian Federation regulates natural gas transportation<br />
tariffs. We are not able to sell our gas other than through<br />
UGSS.<br />
204
Year ended December 31, 2011, compared to years ended December 31, 2010 and December 31, 2009.<br />
The table below presents our consolidated statements of income for the periods indicated.<br />
2011 2010 2009<br />
(millions of US dollars)<br />
Revenues<br />
Sales (including excise and export tariffs) 133,650 104,956 81,083<br />
Costs and other deductions<br />
Operating expenses (9,055) (8,298) (7,340)<br />
Cost of purchased crude oil, gas and products (59,694) (43,250) (31,761)<br />
Transportation expenses (6,121) (5,608) (4,830)<br />
Selling, general and administrative expenses (3,822) (3,558) (3,306)<br />
Depreciation, depletion and amortization (4,473) (4,154) (3,937)<br />
Taxes other than income taxes (12,918) (8,978) (6,474)<br />
Excise and export tariffs (22,217) (18,878) (13,058)<br />
Exploration expense (532) (336) (218)<br />
Loss on disposals and impairments of assets (1,663) (363) (381)<br />
Income from operating activities 13,155 11,533 9,778<br />
Interest expense (694) (712) (667)<br />
Interest and dividend income 211 174 134<br />
Equity share in income of affiliates 690 472 351<br />
Currency translation loss (301) (122) (520)<br />
Other non-operating income (expense) 58 125 (13)<br />
Income before income taxes 13,119 11,470 9,063<br />
Current income taxes (2,678) (2,104) (1,922)<br />
Deferred income taxes (615) (247) (72)<br />
Total income tax expense (3,293) (2,351) (1,994)<br />
Net income 9,826 9,119 7,069<br />
Net loss (income) attributable to noncontrolling interests 531 (113) (58)<br />
Net income attributable to OAO LUKOIL 10,357 9,006 7,011<br />
Earning per share of common stock attributable to OAO LUKOIL<br />
(in US dollars):<br />
Basic 13.30 10.95 8.28<br />
Diluted 13.04 10.94 8.28<br />
The analysis of the main financial indicators of the financial statements is provided below.<br />
205
Sales revenues<br />
Sales breakdown 2011 2010 2009<br />
(millions of US dollars)<br />
Crude oil<br />
Export and sales on international markets other than CIS 30,132 25,251 18,276<br />
Export and sales to CIS 2,390 1,091 1,638<br />
Domestic sales 1,571 956 735<br />
34,093 27,298 20,649<br />
Refined products<br />
Export and sales on international markets<br />
Wholesale 65,060 50,340 37,716<br />
Retail 11,275 9,678 9,172<br />
Domestic sales<br />
Wholesale 7,349 5,427 3,820<br />
Retail 7,893 5,501 4,281<br />
91,577 70,946 54,989<br />
Petrochemicals<br />
Export and sales on international markets 1,095 642 574<br />
Domestic sales 914 728 514<br />
2,009 1,370 1,088<br />
Gas and gas products<br />
Export and sales on international markets 1,878 1,565 1,091<br />
Domestic sales 1,001 786 548<br />
2,879 2,351 1,639<br />
Domestic sales of energy and related services 1,472 1,416 1,087<br />
Other<br />
Sales on international markets 880 890 1,030<br />
Domestic sales 740 685 601<br />
1,620 1,575 1,631<br />
Total sales 133,650 104,956 81,083<br />
206
Sales volumes 2011 2010 2009<br />
Crude oil<br />
(thousands of barrels)<br />
Export and sales on international markets other than CIS 275,696 326,669 305,273<br />
Export and sales to CIS 45,329 23,280 39,106<br />
Domestic sales 32,699 26,637 21,909<br />
353,724 376,586 366,288<br />
Crude oil<br />
(thousands of tonnes)<br />
Export and sales on international markets other than CIS 37,612 44,566 41,647<br />
Export and sales to CIS 6,184 3,176 5,335<br />
Domestic sales 4,461 3,634 2,989<br />
48,257 51,376 49,971<br />
Refined products<br />
(thousands of tonnes)<br />
Export and sales on international markets<br />
Wholesale 76,313 80,043 76,351<br />
Retail 6,945 7,314 8,397<br />
Domestic sales<br />
Wholesale 11,024 10,977 9,796<br />
Retail 8,304 7,022 6,216<br />
102,586 105,356 100,760<br />
Total sales volume of crude oil and refined products 150,843 156,732 150,731<br />
Realized average sales prices 2011 2010 2009<br />
Average realized price international<br />
Oil (excluding CIS) ($/barrel) 109.30 77.30 59.87<br />
Oil (CIS) ($/barrel) 52.71 46.84 41.89<br />
Refined products<br />
Wholesale ($/tonne) 852.55 628.91 493.98<br />
Retail ($/tonne) 1,623.53 1,323.31 1,092.29<br />
Average realized price within Russia<br />
Oil ($/barrel) 48.06 35.90 33.56<br />
Refined products<br />
Wholesale ($/tonne) 666.62 494.37 389.92<br />
Retail ($/tonne) 950.51 783.49 688.74<br />
207
During 2011, our revenues increased by $28,694 million, or<br />
by 27.3%, compared to 2010 (in 2010 increased by $23,873<br />
million, or by 29.4%, compared to 2009). Our revenues from<br />
crude oil sales increased by $6,795 million, or by 24.9%<br />
(in 2010 increased by $6,649 million, or by 32.2%, compared<br />
to 2009). Our revenues from sales of refined products<br />
increased by $20,631 million, or by 29.1% (in 2010 increased<br />
by $15,957 million, or by 29.0%, compared to 2009). In 2011,<br />
the increase in sales revenue was due to sharp increase<br />
in hydrocarbon prices, compared to 2010.<br />
The appreciation of the ruble against the US dollar also<br />
supported our average realized prices in Russia.<br />
Sales of crude oil<br />
2011 vs. 2010<br />
Our total crude oil sales revenues increased by<br />
$6,795 million, or by 24.9%, due to growth of crude oil prices.<br />
At the same time, due to a decrease of production our sales<br />
volumes decreased by 6.1%, or by 3,119 thousand tonnes.<br />
Compared to 2010, we significantly increased crude oil<br />
supplies to Belarus, while sales to outside the CIS decreased<br />
correspondingly.<br />
In 2011, revenue from export of crude oil from Russia both<br />
to the Group companies and third parties amounted<br />
to $25,022 million.<br />
2010 vs. 2009<br />
Our total crude oil sales revenues increased by<br />
$6,649 million, or by 32.2%, mainly due to growth of crude<br />
oil prices. Cease in crude oil refining at third party refineries<br />
in Russia and Belarus released crude oil volumes for marketing.<br />
As a result, our crude oil sales raised by 2.8% in terms<br />
of volumes.<br />
In 2010, revenue from export of crude oil from Russia both<br />
to the Group companies and third parties amounted to<br />
$22,178 million.<br />
Sales of refined products<br />
2011 vs. 2010<br />
Our revenue from the wholesale of refined products outside<br />
of Russia increased by $14,720 million, or by 29.2%, due to<br />
an increase in the average realized price by 35.6% in 2011.<br />
At the same time, the wholesales volumes decreased by<br />
3,730 thousand tonnes, or by 4.7%, mainly as a result of<br />
decrease in export from Russia and the shutdown of the<br />
Odessa refinery.<br />
Our revenue from international retail sales increased by<br />
$1,597 million, or by 16.5%, also due to an increase in<br />
average prices by 22.7%. Retail sales volumes decreased<br />
by 369 thousand tonnes, or by 5.0%, following restructuring<br />
of our retail network in the USA. At the same time, this<br />
was partially compensated by increased retail sales volumes<br />
in Europe.<br />
Our revenue from the wholesale of refined products on<br />
the domestic market increased by $1,922 million, or by<br />
35.4%, mainly due to an increase in the average realized<br />
price by 34.8%. The increase of sales volumes was not<br />
significant.<br />
Our revenue from retail sales in Russia increased by<br />
$2,392 million, or by 43.5%, due to an increase in prices and<br />
sales volumes. Our retail volumes in Russia increased by<br />
18.3% following significant increase of domestic demand.<br />
In 2011, our revenue from the export of refined products<br />
from Russia both to Group companies and third parties<br />
amounted to $17,725 million.<br />
2010 vs. 2009<br />
In 2010, our revenue from the wholesale of refined<br />
products outside of Russia increased by $12,624 million,<br />
or by 33.5%, due to increased average realized price<br />
by 27.3%. The decrease in output at our refineries in Bulgaria<br />
due to overhaul and in Ukraine due to refinery stand-by<br />
and termination of processing activities in Russia were<br />
almost fully compensated by commencement of crude oil<br />
refining at TRN in September 2009. At the same time,<br />
expansion of trading activities led to an increase in wholesales<br />
volumes by 4.8%.<br />
In 2010, our revenue from international retail sales increased<br />
by $506 million, or by 5.5%. Positive effect from the increase<br />
of average retail prices by 21.2% was partially offset<br />
by 12.9% sales volumes decrease, that reflects restructuring<br />
of our retail network in the USA.<br />
In 2010, our revenue from the wholesale of refined<br />
products on the domestic market increased by<br />
$1,607 million, or by 42.1%, mainly due to an increase in the<br />
average realized price by 26.8%. Sales volumes increased<br />
by 1,181 thousand tonnes, or by 12.1%. This was primarily<br />
due to a decrease in refined products export to Belarus.<br />
208
In 2010, our revenue from retail sales in Russia increased<br />
by $1,220 million, or by 28.5%, due to an increase both<br />
in volumes, being a result of higher average daily sales<br />
per petrol station, and in prices. In 2010, our retail sales<br />
revenue was 50.3% of total refined products sales in Russia<br />
(in 2009 – 52.8%).<br />
In 2010, our revenue from export of refined products from<br />
Russia both to Group companies and third parties amounted<br />
to $14,088 million.<br />
Sales of petrochemical products<br />
2011 vs. 2010<br />
In 2011, our revenue from sales of petrochemical products<br />
increased by $639 million, or by 46.6%, mainly as a result<br />
of an increase in international sales volumes. In the fourth<br />
quarter of 2010, we commenced production at our petrochemical<br />
plant Karpatnaftochim Ltd. in Ukraine after<br />
modernization and construction of a chlorine and caustic<br />
production line. Our realized prices increased by 11.8%.<br />
2010 vs. 2009<br />
In 2010, our revenue from sales of petrochemical products<br />
increased by $282 million, or by 25.9%. Outside of Russia,<br />
decrease in sales volumes due to decreased refining and<br />
trading was compensated by price growth. The growth<br />
of domestic sales revenue was largely a result of increase<br />
in realized prices and the effect of the real ruble appreciation<br />
against the US dollar.<br />
Sales of gas and gas products<br />
2011 vs. 2010<br />
Sales of gas and gas refined products increased by<br />
$528 million, or by 22.5%, in 2011. Wholesale gas refined<br />
products sales revenue increased by $364 million, or by<br />
43.6%, primarily as a result of an increase in sales prices.<br />
Retail gas products revenue increased by $112 million, or by<br />
22.1%, also due to price growth.<br />
Natural gas sales revenue increased by $30 million, or by<br />
3.6%.<br />
2010 vs. 2009<br />
In 2010, sales of gas and gas refined products increased by<br />
$712 million, or by 43.4%. Gas refined products sales revenue<br />
increased by $424 million, or by 40.8%, primarily as a result<br />
of an increase in sales prices. Retail gas product revenue increased<br />
up to $506 million, or by 22.2%, due to price growth.<br />
Retail revenue represented 37.8% and 44.0% of our total gas<br />
product revenue in 2010 and 2009, respectively.<br />
Natural gas sales revenue amounted to $835 million –<br />
an increase of 46.2%, compared to 2009. Our domestic<br />
natural gas sales revenue significantly increased as a result<br />
of increased sales to Gazprom, the major purchaser of our<br />
natural gas produced in the Russian Federation. In 2010, we<br />
sold 8,146 million cubic meters of natural gas to Gazprom<br />
(5,936 million cubic meters in 2009). The average realized<br />
price increased by 4.5% to $34.9 per 1,000 cubic meters<br />
as a result of the ruble appreciation.<br />
In 2010, natural gas sales revenue outside of Russia increased<br />
by $174 million mostly as a result of a revision of sale<br />
prices related to the Shakh-Deniz field for 2008-2010 which<br />
led to additional revenue of $101 million, recognized in<br />
the third quarter of 2010.<br />
Domestic sales of energy<br />
and related services<br />
We sell substantially all our energy and related services<br />
domestically. International sales are relatively insignificant.<br />
2011 vs. 2010<br />
In 2011, our revenue from sales of electricity, heat and related<br />
services increased by $56 million, or by 4.0%. This growth<br />
was a result of an increase in tariff rates and the ruble appreciation.<br />
At the same time, in the second half 2011, the revenue<br />
of our energy segment decreased significantly due to<br />
the reduction of resale operations.<br />
2010 vs. 2009<br />
In 2010, our revenue from sales of electricity, heat and related<br />
services increased by $329 million, or by 30.3%, as we<br />
continued to develop the new power generation segment as<br />
part of our strategic development program. The ruble appreciation<br />
also contributed to the increase of this revenue.<br />
Sales of other products<br />
Other sales include non-petroleum sales through our retail<br />
network, transportation services, rental revenue, crude oil<br />
extraction services, and other revenue of our production<br />
and marketing companies from sales of goods and services<br />
not related to our primary activities.<br />
209
2011 vs. 2010<br />
In 2011, other sales increased by $45 million, or by 2.9%. The<br />
sales of goods and other products from our retail stations<br />
increased to $700 million, or by 15.5%. At the same time,<br />
transportation services provided to third parties decreased<br />
compared to 2010.<br />
2010 vs. 2009<br />
In 2010, our other sales decreased by $56 million, or by 3.4%.<br />
A decrease of transportation services provided abroad was<br />
partially compensated by higher non-petroleum retail<br />
revenue. During 2010, sales of goods and other products<br />
from our retail stations amounted to $606 million, an<br />
increase of $38 million compared to 2009.<br />
Operating expenses<br />
Operating expenses include the following:<br />
2011 2010 2009<br />
(millions of US dollars)<br />
Hydrocarbon extraction expenses 3,540 3,241 2,787<br />
Own refining expenses 1,444 1,121 923<br />
Refining expenses at third parties and affiliated refineries 897 724 713<br />
Expenses for crude oil transportation to refineries 1,060 1,048 955<br />
Power generation and distribution expenses 617 654 450<br />
Petrochemical expenses 317 221 127<br />
Other operating expenses 1,180 1,289 1,385<br />
Total operating expenses 9,055 8,298 7,340<br />
The method of allocation of operating expenses above<br />
differs from the approach used in preparing the data for<br />
Note 21 “Segment information” to our consolidated financial<br />
statements. Expenditures in the segment reporting<br />
are grouped depending on the segment to which a particular<br />
company belongs. Operating expenses for the purposes<br />
of this analysis are grouped based on the nature of the costs<br />
incurred.<br />
In 2011, our operating expenses increased by $757 million,<br />
or by 9.1%, mainly as a result of the ruble appreciation<br />
by 12.0%, increased power supply and repair costs and<br />
increase in consumption and cost of additives.<br />
Hydrocarbon extraction<br />
expenses<br />
Our extraction expenses include expenditures related to<br />
repairs of extraction equipment, labor costs, expenses on<br />
artificial stimulation of reservoirs, fuel and electricity costs,<br />
property insurance of extraction equipment and other<br />
similar costs.<br />
2011 vs. 2010<br />
In 2011, our extraction expenses increased by $299 million,<br />
or by 9.2%. Our average hydrocarbon extraction cost<br />
increased from $4.12 per BOE to $4.71 per BOE, or by 14.3%,<br />
compared to 2010.<br />
The increase was mainly a result of the real ruble appreciation<br />
against the US dollar and increased expenses for<br />
power supply, repairs and labor costs.<br />
2010 vs. 2009<br />
In 2010, our extraction expenses increased by $454 million,<br />
or by 16.3%. This was due to increase in expenses for power<br />
supply, general increase in expenses and the effect of<br />
the real ruble appreciation against the US dollar. Our<br />
average hydrocarbon extraction cost increased from $3.56<br />
to $4.12 per BOE, or by 15.7%, compared to 2009.<br />
210
Own refining expenses<br />
2011 vs. 2010<br />
Our own refining expenses increased by $323 million, or by<br />
28.8%, in 2011.<br />
Refining expenses at our domestic refineries increased<br />
by 38.0%, or by $306 million. This increase was a result of<br />
an increase in consumption and cost of additives, increased<br />
power supply costs, higher expenses on repairs and the<br />
ruble appreciation against the US dollar.<br />
Refining expenses at our international refineries increased<br />
by 5.4%, or by $17 million. Despite the decrease of production<br />
volumes at our Bulgarian and Romanian refineries, higher<br />
energy costs and overhauls resulted in an overall increase<br />
of the refining expenses outside of Russia. We continued<br />
to incur operating expenses at our dormant refinery in<br />
Odessa although at a significantly lower level than in 2010 as<br />
we had to keep production facilities on line.<br />
2010 vs. 2009<br />
In 2010, our refining expenses increased by $198 million,<br />
or by 21.5%.<br />
Refining expenses at our domestic refineries increased by<br />
20.1%, or by $135 million, mainly as a result of the real ruble<br />
appreciation against the US dollar, increase in power supply<br />
costs and higher consumption of additives.<br />
Refining expenses at our international refineries increased<br />
by 25.0%, or by $63 million, mainly as a result of increased<br />
power supply costs.<br />
Refining expenses at third party<br />
and affiliated refineries<br />
Along with our own production of refined products we have<br />
the ability to refine crude oil at third party and affiliated<br />
refineries both in Russia and abroad.<br />
2011 vs. 2010<br />
In 2011, refining expenses at third party and affiliated<br />
refineries increased by $173 million, or by 23.9%. This was<br />
due to the increase of our share in ISAB from 49% to 60%<br />
since April, 2011, resulting in the increase of our share of<br />
costs. Increased energy costs, appreciation of euro to the<br />
US dollar and overhauls performed at the ISAB complex<br />
in the first quarter of 2011 also contributed to the increase<br />
of expenses.<br />
2010 vs. 2009<br />
As opposed to 2009, we did not process crude oil on<br />
third party refineries during 2010 in Russia and Belarus.<br />
Nevertheless, the commencement of crude oil refining at<br />
TRN in late September 2009 almost fully compensated for<br />
that. As a result, the overall decrease of throughput at third<br />
party and affiliated refineries including refined products<br />
processed was 2.8%, compared to 2009. At the same time,<br />
in 2010, refining expenses at third party and affiliated<br />
refineries increased by 1.5%, compared to 2009, because<br />
processing costs at our refineries in Western Europe are<br />
higher than at the refineries in Russia or Belarus. Starting<br />
from the third quarter of 2010, we also refined crude oil on a<br />
third party refinery in Kazakhstan.<br />
Petrochemical expenses<br />
2011 vs. 2010<br />
In 2011, operating expenses of our petrochemical plants<br />
increased by $96 million, or by 43.4%, due to an increase<br />
in production volumes as a result of the commencement<br />
of production at our petrochemical plant Karpatnaftochim<br />
Ltd. in Ukraine in the fourth quarter of 2010 after<br />
modernization and construction of a chlorine and caustic<br />
production line. Additionally, the increased consumption<br />
of raw materials due to the changes in product mix and<br />
ruble appreciation contributed to the increase of expenses.<br />
2010 vs. 2009<br />
In 2010, operating expenses of our petrochemical plants<br />
increased by $94 million, or by 74.0%. Expenses in Russia<br />
were impacted by increased production, increased cost of<br />
raw materials and ruble appreciation to the US dollar.<br />
Expenses for crude oil transportation<br />
to refineries<br />
Expenses for crude oil transportation to refineries include<br />
pipeline, railway, freight and other costs related to delivery of<br />
the Group’s own crude oil to refineries for further processing.<br />
2011 vs. 2010<br />
Expenses for crude oil transportation to refineries in 2011<br />
didn’t change significantly. The increase in transportation<br />
211
tariffs compared to 2010 and the effect of ruble appreciation<br />
was compensated for by a decrease in volumes of own supply<br />
to refineries.<br />
2010 vs. 2009<br />
Expenses for crude oil transportation to refineries increased<br />
in 2010 by $93 million, or by 9.7%, due to an increase<br />
in transportation tariffs and as a result of a real ruble<br />
appreciation in Russia (see Transportation expenses below).<br />
Moreover, in 2010, we significantly increased volumes of own<br />
crude oil supplies to TRN.<br />
Power generation and distribution<br />
expenses<br />
2011 vs. 2010<br />
Power generation and distribution expenses decreased<br />
by $37 million, or by 5.7%.<br />
2010 vs. 2009<br />
Power generation and distribution expenses increased<br />
by $204 million, or by 45.3%, following expansion of our<br />
power generating business and as a result of the real ruble<br />
appreciation in Russia.<br />
Other operating expenses<br />
Other operating expenses include expenses of the Group’s<br />
upstream and downstream enterprises that do not relate<br />
to their core activities, namely rendering of transportation<br />
and extraction services, operating expenses of our gas<br />
processing plants, costs of other services provided and<br />
goods sold by our marketing companies, and of non-core<br />
businesses of the Group.<br />
2011 vs. 2010<br />
In 2011, other operating expenses decreased by $109 million,<br />
or by 8.5%. The decrease was a result of a lower volume<br />
of transportation services provided outside of Russia and the<br />
decrease of rental activities as a result of the restructuring<br />
of our retail network in the USA.<br />
2010 vs. 2009<br />
In 2010, our other operating expenses decreased by<br />
$96 million, or by 6.9%, mainly due to decrease of volume of<br />
transportation services provided abroad.<br />
Cost of purchased crude oil, gas<br />
and products<br />
Cost of purchased crude oil, gas and products includes cost<br />
of crude oil and refined products purchased for trading or<br />
refining, gas and fuel oil to supply our power generation<br />
entities and the result of hedging of international crude oil<br />
and refined products sales.<br />
2011 vs. 2010<br />
Cost of purchased crude oil, gas and products increased by<br />
$16,444 million in 2011, or by 38.0%, due to an increase in<br />
crude oil and refined products prices.<br />
In 2011, we recognized a $657 million expense from hedging,<br />
compared to a $232 million expense in 2010.<br />
2010 vs. 2009<br />
In 2010, cost of purchased crude oil, gas and products<br />
increased by $11,489 million, or by 36.2%, due to an increase<br />
in crude oil and refined products prices and increase<br />
in volumes of refined products purchases.<br />
In 2010, we recognized a $232 million expense from hedging,<br />
compared to a $781 million expense in 2009.<br />
Transportation expenses<br />
2011 vs. 2010<br />
Our transportation expenses increased by $513 million, or<br />
by 9.1%. This increase was primarily related to Russia and<br />
resulted from the ruble appreciation, increased tariffs and<br />
change in supply directions.<br />
Our actual transportation expenses related to crude oil<br />
and refined products deliveries to various export destinations,<br />
weighted by volumes transported, changed in 2011,<br />
compared to 2010, as follows: crude oil pipeline tariffs<br />
increased by 14.1%, railway tariffs for refined products<br />
transportation increased by 6.9%, crude oil freight rates<br />
decreased by 3.5%, and refined products freight rates<br />
decreased by 9.2%.<br />
2010 vs. 2009<br />
In 2010, our transportation expenses increased by<br />
$778 million, or by 16.1%. This was primarily due to increase<br />
212
of ruble denominated pipeline and railway transportation<br />
tariffs in Russia, which was emphasized by the ruble<br />
appreciation.<br />
Our actual transportation expenses related to crude oil<br />
and refined products deliveries to various export destinations,<br />
weighted by volumes transported, changed in 2010,<br />
compared to 2009, as follows: crude oil pipeline tariffs<br />
increased by 23.3%, railway tariffs for refined products<br />
transportation increased by 21.1%, crude oil freight rates<br />
decreased by 7.8%, and refined products freight rates<br />
increased by 23.8%.<br />
Selling, general and administrative<br />
expenses<br />
Selling, general and administrative expenses include<br />
distribution costs, payroll costs (excluding extraction entities’<br />
and refineries’ production staff costs), insurance costs<br />
(except for property insurance related to extraction<br />
and refinery equipment), costs of maintenance of social<br />
infrastructure, movement in bad debt provision and other<br />
expenses.<br />
2011 vs. 2010<br />
Our selling, general and administrative expenses increased<br />
by $264 million, or by 7.4%. This increase was driven mainly<br />
by higher selling expenses both in Russia and abroad.<br />
Expenses in Russia were also affected by the real ruble<br />
appreciation. At the same time, the decrease of provisions<br />
for bad debts partially offset the adverse effect of the above<br />
mentioned factors.<br />
2010 vs. 2009<br />
In 2010, our selling, general and administrative expenses<br />
increased by $252 million, or by 7.6%, substantially due<br />
to the effect of ruble appreciation on selling, general and<br />
administrative expenses in Russia and salary indexation.<br />
Exploration expenses<br />
2011 vs. 2010<br />
In 2011, dry hole costs were mostly related to our<br />
overseas projects, namely $181 million in Ghana,<br />
$149 million in Cote d’Ivoire, $27 million in Vietnam and<br />
$17 million in Kazakstan. Dry hole costs in Russia included<br />
$28 million and $10 million related to projects in Komi<br />
Republic and in Western Siberia, respectively.<br />
2010 vs. 2009<br />
During 2010, exploration expense increased by $118 million,<br />
or by 54.1%. Dry hole costs increased by $108 million to<br />
$225 million.<br />
In 2010, we charged to expense cost of dry wells in Columbia<br />
and Cote d’Ivoire in amount of $112 million and $68 million,<br />
respectively. Dry hole write-offs in Russia amounted to<br />
$42 million in 2010.<br />
Equity share in income<br />
of affiliates<br />
The Group has investments in equity method affiliates and<br />
corporate joint ventures. These companies are primarily<br />
engaged in crude oil exploration, production, marketing<br />
and distribution operations in the Russian Federation,<br />
crude oil production and marketing in Kazakhstan and<br />
refining operations in Europe. Our largest affiliates are<br />
Turgai Petroleum and Tengizchevroil, exploration and<br />
production companies operating in Kazakhstan, and ISAB<br />
and TRN refineries.<br />
2011 vs. 2010<br />
Our share in income of affiliates increased by $218 million,<br />
or by 46.2%, in 2011, mostly due to increase in income of<br />
Tengizchevroil.<br />
2010 vs. 2009<br />
At the end of 2009, we increased our share in LUKARCO<br />
from 54% to 100%, thus increasing our stake in Tengizchevroil,<br />
an exploration and production joint-venture in Kazakhstan,<br />
to 5%. Largely as a result of this, our share in income<br />
of affiliates increased by $121 million, or by 34.5%.<br />
Our exploration expense increased by $196 million, or by<br />
58.3%. Dry hole costs amounted to $417 million in 2011,<br />
compared to $225 million in 2010.<br />
213
Taxes other than income taxes<br />
2011 2010 2009<br />
(millions of US dollars)<br />
In Russia<br />
Mineral extraction taxes 11,502 7,795 5,399<br />
Social security taxes and contributions 480 327 330<br />
Property tax 538 479 438<br />
Other taxes 77 93 92<br />
Total in Russia 12,597 8,694 6,259<br />
International<br />
Mineral extraction taxes 92 69 53<br />
Social security taxes and contributions 107 102 69<br />
Property tax 35 39 32<br />
Other taxes 87 74 61<br />
Total internationally 321 284 215<br />
Total 12,918 8,978 6,474<br />
2011 vs. 2010<br />
In 2011, taxes other than income taxes increased by 43.9%,<br />
or by $3,940 million. This was mainly due to an increase in<br />
mineral extraction taxes in Russia as a result of the rise<br />
of the tax rate following the increase of international crude<br />
oil prices.<br />
In 2011, application of decreased rate for depleted oilfields<br />
and zero rate for the fields with extra heavy crude oil and<br />
the greenfields led to $1,161 million tax reduction<br />
($1,313 million in 2010). The major oilfield where we<br />
benefited from zero extraction tax rate was the Yuzhnoye<br />
Khylchuyu field. In early December 2010, accumulated<br />
volume of production from this field exceeded the incentive<br />
level of 15 million tonnes and since that moment we have<br />
been paying extraction tax in full.<br />
The increase in social security taxes and contributions in<br />
Russia was due to tax legislation amendments.<br />
2010 vs. 2009<br />
In 2010, taxes other than income taxes increased by<br />
$2,504 million, or 38.7%, mainly due to an increase in mineral<br />
extraction taxes in Russia. This is explained by an increase<br />
in the tax rate following the increase of international crude<br />
oil prices.<br />
Application of zero tax rate for crude oil produced in Timan-<br />
Pechora and decreased rate for depleted oilfields led<br />
to approximately $1,313 million tax reduction (about<br />
$961 million in 2009).<br />
214
Excise and export tariffs<br />
2011 2010 2009<br />
(millions of US dollars)<br />
In Russia<br />
Excise tax and sales taxes on refined products 1,710 951 763<br />
Crude oil еxport tariffs 11,714 10,513 6,251<br />
Refined products еxport tariffs 5,028 3,574 2,306<br />
Total in Russia 18,452 15,038 9,320<br />
International<br />
Excise tax and sales taxes on refined products 3,445 3,700 3,524<br />
Crude oil еxport tariffs 319 136 107<br />
Refined products еxport tariffs 1 4 107<br />
Total internationally 3,765 3,840 3,738<br />
Total 22,217 18,878 13,058<br />
2011 vs. 2010<br />
Export tariffs increased by $2,835 million, or by 19.9%, in 2011.<br />
The effect of increase of crude oil and refined products tariff<br />
rates was partially compensated for by a decrease in crude<br />
oil export volumes by 14.5% and refined products export<br />
volumes by 6.9%, compared to 2010.<br />
Starting from 2011, excise rates on refined products in Russia<br />
were increased and tied to the ecological class of fuel.<br />
Despite the fact that the Company produces high quality<br />
ecological motor fuel subject to lower excise rates compared<br />
to fuel of lower quality, average excise rates roughly doubled<br />
for us compared to 2010.<br />
Starting from December, 2010 the Group applies reduced<br />
export duty rate for the crude oil produced from the Yu.<br />
Korchagin field in the Caspian Sea, however due to relatively<br />
small amount of crude oil export from that field the effect<br />
of this incentive on our 2011 and 2010 financial results was<br />
insignificant.<br />
2010 vs. 2009<br />
In spite of a decrease in crude oil and refined products<br />
export volumes, export tariffs increased by $5,456 million,<br />
or by 62.2%, due to an increase in tariff rates in Russia as a<br />
result of international crude oil prices growth. The increase<br />
in excises in Russia resulted from the ruble appreciation,<br />
increase of excise rate and increase in sales volumes.<br />
Other non-operating income<br />
(expense)<br />
2011 vs. 2010<br />
In 2011, other non-operating income included the effect of<br />
the recalculation of the extraction tax incentive by certain<br />
Group companies for prior periods in the total amount<br />
of $433 million.<br />
2010 vs. 2009<br />
In 2010, other non-operating income included a<br />
$438 million gain related to successful settlement of<br />
a corporate dispute between a Group company and a CNPC<br />
group company regarding Turgai Petroleum, and<br />
a $111 million expense related to provisions accrued in<br />
respect of claims to the Group companies by Federal<br />
Antimonopoly Service of the Russian Federation (“FAS of<br />
Russia”).<br />
215
Loss on disposals and impairments<br />
of assets<br />
2011 vs. 2010<br />
Loss on disposals and impairments of assets for 2011<br />
mainly included an impairment loss related to certain<br />
upstream and other assets of NMNG in amount of<br />
$1,261 million. For details please refer to “Impairment<br />
of assets in OOO Narianmarneftegaz” section on page 192.<br />
Additionally, in 2011, the Company recognized an impairment<br />
loss of $175 million for international refining, marketing<br />
and distribution assets.<br />
2010 vs. 2009<br />
In 2010, loss on disposals and impairments of assets amounted<br />
to $363 million, compared to $381 million in 2009.<br />
As a result of an impairment test performed in December<br />
2010, we recognized an impairment loss of $163 million<br />
for certain upstream properties in the Timan-Pechora,<br />
Western Siberia and Central European regions of Russia;<br />
and an impairment loss of $29 million related to certain our<br />
European downstream assets. We also wrote off goodwill<br />
related to our Turkish downstream subsidiary in amount of<br />
$114 million due to a change in market conditions mostly<br />
caused by legislative changes.<br />
Income taxes<br />
2011 vs. 2010<br />
In 2011, our total income tax expense increased by<br />
$942 million, or by 40.1%. At the same time, our income<br />
before income tax increased by $1,649 million, or by 14.4%.<br />
In 2011, our effective income tax rate was 25.1%, compared<br />
to 20.5% in 2010, while the maximum statutory rate for the<br />
Russian Federation is 20%.<br />
The high level of the effective income tax rate in 2011 was<br />
mostly due to a $1,261 million non-taxable impairment loss<br />
in NMNG. For details please refer to “Impairment of assets<br />
in OOO Narianmarneftegaz” section on page 192.<br />
2010 vs. 2009<br />
In 2010, our total income tax expense increased by<br />
$357 million, or by 17.9%. Income before income tax increased<br />
by $2,407 million, or by 26.6%.<br />
In 2010, our effective income tax rate was 20.5%, compared<br />
to 22.0% in 2009.<br />
216
Reconciliation of net income to EBITDA (earnings before interest, income taxes, depreciation<br />
and amortization)<br />
2011 2010 2009<br />
(millions of US dollars)<br />
Net income 10,357 9,006 7,011<br />
Add back:<br />
Income tax expense 3,293 2,351 1,994<br />
Depreciation and amortization 4,473 4,154 3,937<br />
Interest expense 694 712 667<br />
Interest and dividend income (211) (174) (134)<br />
EBITDA 18,606 16,049 13,475<br />
Impairment loss in NMNG net of noncontrolling interest (1) 883 – –<br />
Adjusted EBITDA 19,489 16,049 13,475<br />
(1)<br />
For details please refer to “Impairment of assets in OOO Narianmarneftegaz” section on page 192.<br />
EBITDA is a non-US GAAP financial measure. EBITDA<br />
is defined as net income before interest, taxes and<br />
depreciation and amortization. The Company believes that<br />
EBITDA provides useful information to investors because<br />
it is an indicator of the strength and performance of our<br />
business operations, including our ability to finance capital<br />
expenditures, acquisitions and other investments and our<br />
ability to incur and service debt. While depreciation and<br />
amortization are considered as operating costs under US<br />
GAAP, these expenses primarily represent the non-cash<br />
current period allocation of costs associated with long-lived<br />
assets acquired or constructed in prior periods. The EBITDA<br />
calculation is commonly used as a basis for some investors,<br />
analysts and credit rating agencies to evaluate and compare<br />
the periodic and future operating performance and value of<br />
companies within the oil and gas industry. EBITDA should not<br />
be considered in isolation as an alternative to net income,<br />
operating income or any other measure of performance<br />
under US GAAP. EBITDA does not include our need to replace<br />
our capital equipment over time.<br />
217
Liquidity and capital resources<br />
2011 2010 2009<br />
(millions of US dollars)<br />
Net cash provided by operating activities 15,514 13,541 8,883<br />
Net cash used in investing activities (10,773) (7,296) (8,551)<br />
Net cash used in by financing activities (4,263) (6,146) (285)<br />
Operating activities<br />
Our primary source of cash flow is funds generated from<br />
our operations. During 2011, cash generated from operating<br />
activities was $15,514 million, which is 14.6% more than<br />
in 2010, mainly due to the increase in sales revenues. On<br />
the other hand, our operating cash flows were affected by<br />
an increase in working capital by $1,529 million, compared<br />
to January 1, 2011.<br />
The increase of working capital was mainly caused by:<br />
• $1,420 million increase in inventory<br />
• $346 million net increase in tax accounts receivable<br />
and payable<br />
At the same time, this negative effect was partially offset<br />
by а $180 million net decrease in VAT receivable and<br />
payable.<br />
Investing activities<br />
The increase in cash used in investing activities mainly<br />
resulted from an increase in payments for acquisitions.<br />
In 2011, we made an advance payment of $1,760 million<br />
for expected acquisition of certain upstream assets, a final<br />
payment of $500 million within the acquisition of LUKARCO,<br />
a payment of $342 million for 11% share in ISAB and a payment<br />
of $153 million for a 25.1% share in OOO “Bashneft-<br />
Polus”.<br />
Capital expenditures increased by $1,653 million, or by<br />
25.1%, compared to 2010.<br />
Financing activities<br />
In 2011, net movements of short-term and long-term debt<br />
generated an outflow of $2,004 million, compared to an<br />
inflow of $35 million in 2010.<br />
As a result, our indebtedness as at December 31, 2011<br />
amounted to $9,092 million that represents an 18.8%<br />
decrease compared to January 1, 2011. Compared to the<br />
beginning of the year, our net debt decreased by 28.2%<br />
to $6,339 million.<br />
Credit rating<br />
Standard & Poor’s Ratings Services affirmed its long-term<br />
corporate credit rating and all debt ratings on the Company<br />
at BBB- with stable outlook.<br />
Moody’s affirmed the Company’s long-term corporate<br />
family rating and long-term issuer rating of Baa2 with<br />
stable outlook.<br />
Fitch Ratings affirmed the Company’s long-term issuer<br />
default rating of BBB- with stable outlook.<br />
218
Analysis of capital expenditures<br />
2011 2010 2009<br />
(millions of US dollars)<br />
Capital expenditures (1)<br />
Exploration and production<br />
Russia 5,084 3,911 3,855<br />
International 1,545 997 770<br />
Total exploration and production 6,629 4,908 4,625<br />
Refining, marketing and distribution<br />
Russia 1,030 944 808<br />
International 324 375 508<br />
Total refining, marketing and distribution 1,354 1,319 1,316<br />
Chemicals<br />
Russia 55 27 13<br />
International 34 49 100<br />
Total chemicals 89 76 113<br />
Power generation and distribution 196 420 283<br />
Other 224 121 197<br />
Total capital expenditures 8,492 6,844 6,534<br />
Acquisitions of subsidiaries and associates (2)<br />
Exploration and production<br />
Russia 252 – –<br />
International 2,260 922 300<br />
Total exploration and production 2,512 922 300<br />
Refining, marketing and distribution<br />
Russia 10 7 212<br />
International 342 3 2,069 (3)<br />
Total refining, marketing and distribution 352 10 2,281<br />
Power generation and distribution – – 10<br />
Other – – 1<br />
Less cash acquired (4) – (19)<br />
Total acquisitions 2,860 932 2,573<br />
(1)<br />
Including non-cash transactions and prepayments.<br />
(2)<br />
Including prepayments related to acquisitions and non-cash transactions.<br />
(3)<br />
Including $100 million of non-cash part of consideration for acquisition of TRN.<br />
219
Our capital expenditures, including non-cash transactions,<br />
amounted to $8,492 million, which is 24.1% more than in<br />
2010. Capital expenditures in exploration and production<br />
segment increased by $1,721 million, or by 35.1%.<br />
In Russia, we increased the investments in drilling, field<br />
development and construction of gas transportation facilities<br />
in Western Siberia and petroleum gas utilization program<br />
in Western Siberia and Komi Republic. Moreover, our capital<br />
expenditures were affected by ruble appreciation.<br />
In our international projects, we significantly increased<br />
volumes of exploration drilling in Western Africa, namely<br />
Ghana, Cote d’Ivoire and Sierra-Leone. Moreover, we<br />
significantly increased investments in our gas production<br />
projects in Uzbekistan.<br />
The table below shows our exploration and production capital expenditures in promising new production regions.<br />
2011 2010 2009<br />
(millions of US dollars)<br />
Northern Timan-Pechora 278 285 385<br />
Yamal 372 162 131<br />
Caspian region (1) 555 370 532<br />
Ghana 216 87 73<br />
Cote d’Ivoire 227 92 31<br />
Iraq 203 172 –<br />
Uzbekistan 480 286 201<br />
Total 2,331 1,454 1,353<br />
(1)<br />
Russian and international projects.<br />
220
Contractual obligations, other contingencies and off balance sheet arrangements<br />
Capital commitments and contractual<br />
obligations<br />
Under the terms of existing exploration and production<br />
license agreements in Russia the Group has to fulfill certain<br />
obligations: oil and gas exploration, wells drilling, fields<br />
development, etc., and the Group also has commitments to<br />
reach a defined level of extraction on the fields. Management<br />
believes that the Group’s approved annual capital<br />
expenditure budgets fully cover all the requirements of<br />
the described license obligations.<br />
Group companies have commitments for capital expenditure<br />
contributions in the amount of $406 million related<br />
to various production sharing agreements over the next 26<br />
years.<br />
The Company signed a three-year agreement for the<br />
years 2010-2012 for drilling services with OOO Eurasia<br />
Drilling Company. The volume of these services is<br />
based on the Group’s capital construction program,<br />
which is re-evaluated on an annual basis. The Group estimates<br />
the amount of capital commitment under this agreement<br />
for 2012 to be approximately $1,521 million.<br />
The Company signed a strategic agreement for the ongoing<br />
provision of construction, engineering and technical<br />
services with ZAO Globalstroy-Engineering. The volume of<br />
these services is based on the Group’s capital construction<br />
program, which is re-evaluated on an annual basis.<br />
The Group estimates the amount of capital commitment<br />
under this agreement for 2012 to be approximately<br />
$225 million.<br />
The Group has a commitment to execute the capital<br />
construction program of its power generation segment<br />
and under the terms of this program power plants<br />
with a total capacity of 890 MW should be constructed.<br />
Currently the Group is approving certain amendments to<br />
the capital construction program, including its extension<br />
by the end of 2014. As of December 31, 2011, the Group<br />
estimates the amount of this commitment to be approximately<br />
$594 million.<br />
The Group signed a number of agreements for the years<br />
2012-2015 for construction of the offshore platforms in<br />
the Caspian Sea. The Group estimates the amount of this<br />
capital commitment to be approximately $866 million.<br />
221
The following table displays our total contractual obligations and other commitments.<br />
(millions of US dollars) Total 2012 2013 2014 2015 2016 After<br />
On balance sheet<br />
Short term debt 148 148 – – – – –<br />
Long-term bank loans<br />
and borrowings 1,120 455 267 130 118 76 74<br />
Long-term non-bank loans<br />
and borrowings 1,532 40 32 39 21 19 1 381<br />
6.375% Non-convertible US dollar bonds,<br />
maturing 2014 897 – – 897 – – –<br />
2.625% Convertible US dollar bonds,<br />
–<br />
maturing 2015 1,412 – – – 1,412 –<br />
6.356% Non-convertible US dollar bonds,<br />
maturing 2017 500 – – – – – 500<br />
7.250% Non-convertible US dollar bonds,<br />
maturing 2019 596 – –<br />
– –<br />
– 596<br />
6.125% Non-convertible US dollar bonds,<br />
maturing 2020 998 – – – – – 998<br />
6.656% Non-convertible US dollar bonds,<br />
maturing 2022 500 – – – – – 500<br />
13.35% Russian ruble bonds,<br />
maturing 2012 776 776 – – – – –<br />
9.20% Russian ruble bonds,<br />
maturing 2012 311 311 – – – – –<br />
7.40% Russian ruble bonds,<br />
maturing 2013 186 – 186 – – – –<br />
Capital lease obligations 116 62 27 27 – – –<br />
Total 9,092 1,792 512 1,093 1,551 95 4,049<br />
Off balance sheet<br />
Operating lease obligations 507 145 83 74 46 54 105<br />
Capital commitments in PSAs 406 258 57 57 2 2 30<br />
Capital commitments of power generating<br />
segment 594 436 112 46 – – –<br />
Obligation under contract with<br />
OOO Eurasia Drilling Company 1,521 1,521 – – – – –<br />
Obligation under contract with<br />
ZAO Globalstroy-Engineering 225 225 – – – – –<br />
Obligation under contracts for the development<br />
of the V. Filanovsky oilfield 866 64 596 191 15 – –<br />
222
Litigation and claims<br />
On November 27, 2001, Archangel Diamond Corporation<br />
(“ADC”), a Canadian diamond development company, filed<br />
a lawsuit in the Denver District Court, Colorado against<br />
OAO Arkhangelskgeoldobycha (“AGD”), a Group company,<br />
and the Company (together the “Defendants”). ADC<br />
alleged that the Defendants interfered with the transfer of<br />
a diamond exploration license to Almazny Bereg, a joint<br />
venture between ADC and AGD. ADC claimed compensatory<br />
damages of $1.2 billion and punitive damages of $3.6 billion.<br />
On October 15, 2002, the District Court dismissed the<br />
lawsuit for lack of personal jurisdiction. This ruling was<br />
upheld by the Colorado Court of Appeals on March 25, 2004.<br />
On November 21, 2005, the Colorado Supreme Court<br />
affirmed the lower courts’ ruling that no specific jurisdiction<br />
exists over the Defendants.<br />
By virtue of this finding, AGD (the holder of the diamond<br />
exploration license) was dismissed from the lawsuit. The<br />
Colorado Supreme Court found, however, that the trial court<br />
made a procedural error by failing to hold an evidentiary<br />
hearing before making its ruling concerning general jurisdiction<br />
regarding the Company and remanded the case to<br />
the Colorado Court of Appeals to consider whether the<br />
lawsuit should have been dismissed on alternative grounds<br />
(i.e., forum non conveniens). The Colorado Court of Appeals<br />
declined to dismiss the case based on forum non conveniens<br />
and the case was remanded to the District Court.<br />
In June 2009, three creditors of ADC filed an Involuntary<br />
Bankruptcy Petition putting ADC into bankruptcy.<br />
In November 2009, after adding a claim, ADC removed<br />
the case from the District Court to the US Bankruptcy<br />
Court. On October 28, 2010, the Bankruptcy Court granted<br />
the Company’s Motion for Remand and Abstention and<br />
remanded the case to the Denver District Court. On<br />
October 20, 2011, the Denver District Court dismissed all<br />
claims in the lawsuit against the Company. ADC has filed<br />
a notice of appeal. No briefing schedule has been established.<br />
Management does not believe that the ultimate<br />
resolution of this matter will have a material adverse effect<br />
on the Group’s financial condition.<br />
On January 6, 2012, ADC filed a lawsuit in the US District<br />
Court for the District of Colorado (federal court) reasserting<br />
almost identical claims asserted in the aforementioned<br />
lawsuit and dismissed by the Denver District Court (state<br />
court) notwithstanding ADC’s appeal of the state court’s<br />
decision. The time within which the Company is required<br />
to respond has not expired. The Company plans to seek<br />
dismissal of the case and vigorously defend the matter.<br />
Management does not believe that the ultimate resolution<br />
of this matter will have a material adverse effect on the<br />
Group’s financial condition.<br />
As of the date the financial statements were available to<br />
be issued approximately 100 claims in relation to a violation<br />
of the anti-monopoly regulation were initiated against<br />
several Group companies in Russia and abroad. The Group<br />
companies were accused of violations primarily involving<br />
abuse of their dominant market position and execution<br />
of coordinated actions in oil products retail markets.<br />
On February 9, 2011, the Federal Anti-monopoly Service<br />
of the Russian Federation (“FAS of Russia”) filed a case<br />
against the three largest Russian oil companies, including<br />
the Company, accusing them of abuse of their dominant<br />
position in the oil products market. The decision accusing<br />
the Company in establishing monopolistically high prices<br />
on diesel fuel during the period October 2010 – December<br />
2010 was issued on August 9, 2011. The case in establishing<br />
monopolistically high prices on jet fuel was separated<br />
into an individual proceeding and its hearing is scheduled<br />
for March 20, 2012. On December 28, 2011, FAS of Russia<br />
defined fines against the Company and the Group’s<br />
refinery plants in the amount of $19 million. The decision was<br />
not contested and the fines were paid on February 17, 2012.<br />
The Group accrued a provision for this amount in the consolidated<br />
financial statements as of December 31, 2011.<br />
The Group is involved in cost recovery disputes with the<br />
Republic of Kazakhstan. The Group’s share of the claim is<br />
approximately $295 million. Management is of the view<br />
that substantially all of the amounts subject to dispute are<br />
in fact recoverable under the Final Production Sharing<br />
Agreement. Management believes that the ultimate resolution<br />
of the claim will not have a material adverse impact<br />
on the Group’s operating results or financial condition.<br />
The Group is involved in various other claims and legal<br />
proceedings arising in the normal course of business.<br />
While these claims may seek substantial damages against<br />
the Group and are subject to uncertainty inherent in any<br />
litigation, management does not believe that the ultimate<br />
resolution of such matters will have a material adverse<br />
impact on the Group’s operating results or financial<br />
condition.<br />
223
Critical accounting policies<br />
The preparation of financial statements in conformity with<br />
accounting principles generally accepted in the United<br />
States of America requires management to select appropriate<br />
accounting policies and to make estimates and<br />
assumptions that affect the reported amounts of assets,<br />
liabilities, revenues and expenses. See Note 2 “Summary of<br />
significant accounting policies” to our consolidated financial<br />
statements for descriptions of the Company’s major<br />
accounting policies. Certain of these accounting policies<br />
involve judgments and uncertainties to such an extent that<br />
there is a reasonable likelihood that materially different<br />
amounts would have been reported under different<br />
conditions, or if different assumptions had been used.<br />
Business combinations<br />
Purchase price allocation<br />
Accounting for the acquisition of a business requires the<br />
allocation of the purchase price to the various assets and<br />
liabilities of the acquired business. For most assets and<br />
liabilities, purchase price allocation is accomplished by<br />
recording the asset or liability at its estimated fair value.<br />
The most difficult estimations of individual fair values<br />
are those involving property, plant and equipment and<br />
identifiable intangible assets. We use all available information<br />
to make these fair value determinations and, for<br />
major business acquisitions, typically engage an outside<br />
appraisal firm to assist in the fair value determination of<br />
the acquired long-lived assets. We have, if necessary, up to<br />
one year after the acquisition closing date to finish these<br />
fair value determinations and finalize the purchase price<br />
allocation.<br />
Principles of consolidation<br />
Our consolidated financial statements include the financial<br />
position and results of the Company, controlled subsidiaries<br />
of which the Company directly or indirectly owns<br />
more than 50% of the voting interest, unless minority interest<br />
shareholders have substantive participating rights, and<br />
variable interest entities where the Group is determined to<br />
be the primary beneficiary. Other significant investments<br />
in companies of which the Company directly or indirectly<br />
owns between 20% and 50% of the voting interest and<br />
over which it exercises significant influence but not control,<br />
are accounted for using the equity method of accounting.<br />
Investments in companies of which the Company directly<br />
or indirectly owns more than 50% of the voting interest<br />
but where minority interest shareholders have substantive<br />
participating rights are accounted for using the equity method<br />
of accounting. Undivided interests in oil and gas joint<br />
ventures are accounted for using the proportionate consolidation<br />
method. Investments in other companies are recorded<br />
at cost.<br />
Revenue recognition<br />
Revenues are recognized when title passes to customers at<br />
which point the risks and rewards of ownership are assumed<br />
by the customer and the price is fixed or determinable.<br />
Revenues include excise on petroleum products sales and<br />
duties on export sales of crude oil and petroleum products.<br />
Revenues from non-cash sales are recognized at the fair<br />
market value of the crude oil and petroleum products sold.<br />
Successful efforts accounting for<br />
oil and gas activities<br />
Accounting for oil and gas activities is subject to special<br />
accounting rules that are unique to the oil and gas industry.<br />
Property acquisitions, successful exploratory wells,<br />
all development costs (including development dry holes<br />
and the Group’s share of operators’ expenses during the<br />
development stage of production sharing and risk service<br />
contracts) and support equipment and facilities are<br />
capitalized. Artificial stimulation and well work-over costs<br />
are included in operating expenses as incurred.<br />
Property acquisition costs<br />
For individually significant undeveloped properties,<br />
management periodically performs impairment test based<br />
on exploration and drilling efforts to date. For undeveloped<br />
properties that individually are relatively small, management<br />
exercises judgment and determines a periodic property<br />
impairment charge as required that is reported in loss<br />
on disposals and impairments of assets.<br />
Exploratory costs<br />
For exploratory wells, drilling costs are temporarily<br />
capitalized, or “suspended”, on the balance sheet, pending<br />
a judgmental determination of whether potentially econo-<br />
224
mic oil and gas reserves have been discovered by the drilling<br />
effort. If a judgment is made that the well did not<br />
encounter potentially economic oil and gas quantities, the<br />
well costs are expensed as a dry hole and are reported in<br />
exploration expense. Exploratory wells that are judged to<br />
have discovered potentially economic quantities of oil and<br />
gas and that are in areas where a major capital expenditure<br />
would be required before production could begin, remain<br />
capitalized on the balance sheet as long as additional<br />
exploratory appraisal work is under way or firmly planned.<br />
There is no periodic impairment assessment of suspended<br />
exploratory well costs. Management continuously<br />
monitors the results of the additional appraisal drilling and<br />
seismic work and expenses the suspended well costs as<br />
dry holes when it judges that the potential field does not<br />
warrant further exploratory efforts in the near term.<br />
Other exploratory expenditures, including geological and<br />
geophysical costs are expensed as incurred.<br />
Proved oil and gas reserves<br />
Due to the inherent uncertainties and the necessarily limited<br />
nature of reservoir data, estimates of reserves are inherently<br />
imprecise, require the application of judgment and are<br />
subject to change as additional information becomes available.<br />
The estimates are made using all available geological<br />
and reservoir data as well as historical production data.<br />
Estimates are reviewed and revised as appropriate. Revisions<br />
occur as a result of changes in prices, costs, fiscal regimes,<br />
reservoir performance or a change in the Company’s plans.<br />
Proved oil and gas reserves are the estimated quantities<br />
of crude oil, natural gas liquids including condensate and<br />
natural gas that geological and engineering data demonstrate<br />
with reasonable certainty can be recovered in future<br />
years from known reservoirs under existing economic<br />
and operating conditions. Reserves are considered proved<br />
if they can be produced economically as demonstrated by<br />
either actual production or conclusive formation tests.<br />
Proved reserves do not include additional quantities of oil<br />
and gas reserves that may result from applying secondary<br />
or tertiary recovery techniques not yet tested and determined<br />
to be economic. The proved reserves include volumes<br />
which are recoverable up to and after license expiry dates.<br />
Proved developed reserves are the quantities of proved<br />
reserves expected to be recovered through existing wells<br />
with existing equipment and operating methods.<br />
Management has included within proved reserves significant<br />
quantities which the Group expects to produce after<br />
the expiry dates of certain of its current production licenses<br />
in the Russian Federation. The Subsoil Law of the Russian<br />
Federation states that, upon expiration, a license is subject<br />
to renewal at the initiative of the license holder provided<br />
that further exploration, appraisal, production or remediation<br />
activities are necessary and provided that the license<br />
holder has not violated the terms of the license. Since the<br />
law applies both to newly issued and old licenses and the<br />
Group has currently renewed nearly 50% of its licenses, management<br />
believes that licenses will be renewed upon their<br />
expiration for the remainder of the economic life of each<br />
respective field.<br />
Impairment of long-lived<br />
assets<br />
Long-lived assets, such as oil and gas properties (other than<br />
unproved properties), other property, plant, and equipment,<br />
and purchased intangibles subject to amortization, are<br />
assessed for impairment whenever events or changes in circumstances<br />
indicate that the carrying amount of an asset<br />
group may not be recoverable. Recoverability of assets to<br />
be held and used is measured by a comparison of the carrying<br />
amount of an asset group to the estimated undiscounted<br />
future cash flows expected to be generated by that group.<br />
If the carrying amount of an asset group exceeds its estimated<br />
undiscounted future cash flows, an impairment charge<br />
is recognized by writing down the carrying amount to the<br />
estimated fair value of the asset group, generally determined<br />
as discounted future net cash flows. Assets to be disposed<br />
of are separately presented in the balance sheet and reported<br />
at the lower of the carrying amount or fair value less costs<br />
to sell, and are no longer depreciated. The assets and liabilities<br />
of a disposed group classified as held for sale are presented<br />
separately in the appropriate asset and liability sections<br />
of the balance sheet.<br />
Deferred income taxes<br />
Deferred income tax assets and liabilities are recognized<br />
in respect of future tax consequences attributable to temporary<br />
differences between the carrying amounts of existing<br />
assets and liabilities for the purposes of the consolidated<br />
financial statements and their respective tax bases and<br />
in respect of operating loss and tax credit carryforwards.<br />
Deferred income tax assets and liabilities are measured using<br />
enacted tax rates expected to apply to taxable income in<br />
the years in which those temporary differences are expected<br />
to reverse and the assets be recovered and liabilities settled.<br />
The effect on deferred income tax assets and liabilities<br />
225
of a change in tax rates is recognized in the consolidated<br />
statement of income in the reporting period which<br />
includes the enactment date.<br />
The ultimate realization of deferred income tax assets is<br />
dependent upon the generation of future taxable income in<br />
the reporting periods in which the originating expenditure<br />
becomes deductible. In assessing the realizability of deferred<br />
income tax assets, management considers whether it<br />
is more likely than not that the deferred income tax assets<br />
will be realized. In making this assessment, management<br />
considers the scheduled reversal of deferred income tax<br />
liabilities, projected future taxable income, and tax planning<br />
strategies.<br />
An income tax position is recognized only if the uncertain<br />
position is more likely than not of being sustained upon<br />
examination, based on its technical merits. A recognized<br />
income tax position is measured at the largest amount<br />
that is greater than 50% likely of being realized. Changes<br />
in recognition or measurement are reflected in the period in<br />
which the change in judgment occurs.<br />
Asset retirement<br />
obligations<br />
Under various laws, contracts, permits and regulations, the<br />
Group has legal obligations to remove tangible equipment<br />
and restore the land or seabed at the end of operations<br />
at production sites. The largest asset retirement obligations<br />
of the Group relate to wells and oil and gas production<br />
facilities and pipelines. The Group records the fair value of<br />
liabilities associated with such obligations when incurred.<br />
Estimating the future asset retirement obligations costs<br />
necessary for this accounting calculation involves significant<br />
estimates and judgments by management. Most of<br />
these obligations are many years in the future and the contracts<br />
and regulations often have vague descriptions of what<br />
removal practices and criteria will have to be met when<br />
the removal event actually occurs. Asset removal technologies<br />
and costs are constantly changing, as well as political,<br />
environmental, safety and public relations considerations.<br />
Contingencies<br />
Certain conditions may exist as of balance sheet dates that<br />
may result in losses, but the impact of which will only be<br />
resolved when one or more future events occur or fail to<br />
occur. The Group is required to both determine whether a<br />
loss is probable based on judgment and interpretation of<br />
laws and regulations and determine whether the loss can be<br />
reasonably estimated. If our assessment of a contingency<br />
indicates that it is probable that a material loss will arise,<br />
and the amount of the liability can be estimated, then the<br />
estimated liability is accrued and charged to the consolidated<br />
statement of income. If our assessment indicates that<br />
a potentially material loss is not probable, but is only reasonably<br />
possible, or is probable but cannot be estimated,<br />
then the nature of the contingent liability is disclosed in the<br />
notes to our consolidated financial statements. Loss contingencies<br />
considered remote are generally not disclosed unless<br />
they involve guarantees, in which case the nature of the<br />
guarantee is disclosed. The Company’s management continually<br />
monitor known and potential contingent matters and<br />
make appropriate charges to the consolidated statement<br />
of income when warranted by circumstance.<br />
Use of derivative<br />
instruments<br />
The Group’s derivative activity is limited to certain petroleum<br />
products marketing and trading operations hedging of<br />
commodity price risks. Currently this activity involves the use<br />
of futures and swaps contracts together with purchase<br />
and sale contracts that qualify as derivative instruments.<br />
The Group accounts for these activities under the mark-tomarket<br />
methodology in which the derivatives are revalued<br />
each accounting period. Resulting realized and unrealized<br />
gains or losses are presented in the consolidated statement<br />
of income on a net basis. Unrealized gains and losses are<br />
carried as assets or liabilities on the consolidated balance<br />
sheet.<br />
226
Recent accounting pronouncements<br />
In April 2011, the FASB issued Accounting Standards Update<br />
(“ASU”) No. 2011-02, “A Creditor’s Determination of Whether<br />
a Restructuring Is a Troubled Debt Restructuring,” which<br />
amends Topic 310 of the Codification. This ASU provides<br />
additional guidance in considering whether a restructuring<br />
constitutes a troubled debt restructuring and helps creditors<br />
in determining whether a creditor has granted a concession<br />
and whether a debtor is experiencing financial<br />
difficulties. ASU No. 2011-02 is effective starting from the first<br />
interim or annual period beginning on or after June 15, 2011.<br />
The Group adopted the requirements of ASU No. 2011-02<br />
starting from the third quarter of 2011. This adoption did<br />
not have a material impact on the Group’s results of operations,<br />
financial position or cash flows and did not require<br />
additional disclosures.<br />
In January 2010, the FASB issued ASU No. 2010-06, “Improving<br />
Disclosures about Fair Value Measurements,” which requires<br />
reporting entities to make new disclosures about recurring<br />
or nonrecurring fair-value measurements including significant<br />
transfers into and out of Level 1 and Level 2 fair-value<br />
measurements and to present separately information about<br />
purchases, sales, issuances, and settlements on a gross<br />
basis in the reconciliation of Level 3 fair-value measurements.<br />
This ASU also clarifies existing fair-value measurement<br />
disclosure guidance about the level of disaggregation,<br />
inputs, and valuation techniques. The Group fully adopted<br />
the requirements of ASU No. 2010-06 starting from the<br />
first quarter of 2011. This adoption did not have a material<br />
impact on the Group’s results of operations, financial position<br />
or cash flows.<br />
In December 2011, the FASB issued ASU No. 2011-12, “Deferral<br />
of the Effective Date for Amendments to the Presentation<br />
of Reclassifications of Items Out of Accumulated Other<br />
Comprehensive Income in Accounting Standards Update<br />
No. 2011-05.” This ASU defers changes that relate to the<br />
presentation to reclassification adjustments out of accumulated<br />
other comprehensive income in ASU No. 2011 05,<br />
“Presentation of Comprehensive Income,” until the FASB<br />
is able to reconsider those paragraphs. Entities should<br />
continue to report reclassifications out of accumulated<br />
other comprehensive income consistent with the presentation<br />
requirements in effect before ASU No. 2011-05. ASU No.<br />
2011-12 is effective at the same time as the ASU No. 2011-05:<br />
for public entities for fiscal years, and interim periods within<br />
those years, beginning after December 15, 2011 and should<br />
be applied retrospectively. The Group will apply the provisions<br />
of ASU No. 2011-12 starting from the first quarter of<br />
2012 and does not expect any material impact on its results<br />
of operations, financial position or cash flows.<br />
In December 2011, the FASB issued ASU No. 2011-11,<br />
“Disclosures about Offsetting Assets and Liabilities.” This<br />
ASU requires entities to disclose information about offsetting<br />
and related arrangements to enable users of its financial<br />
statements to understand the effect of those arrangements<br />
on its financial position. The scope includes derivatives, sale<br />
and repurchase agreements and reverse sale and repurchase<br />
agreements, and securities borrowing and securities lending<br />
arrangements. ASU No. 2011-11 is effective for annual<br />
reporting periods on or after January 1, 2013, and interim<br />
periods within those annual periods, and should be applied<br />
retrospectively. The Group is evaluating the effect of the<br />
adoption of ASU No. 2011-11 and does not expect any<br />
material impact on its results of operations, financial position<br />
or cash flows.<br />
In September 2011, the FASB issued ASU No. 2011-08, “Testing<br />
Goodwill for Impairment,” which allows an entity to use<br />
a qualitative approach to test goodwill for impairment. This<br />
ASU permits an entity to first assess qualitative factors to<br />
determine whether it is more likely than not that the fair<br />
value of a reporting unit is less than its carrying amount and<br />
hence whether it is necessary to perform the two-step goodwill<br />
impairment test as required by the provisions of Topic<br />
350 of the Codification. ASU No. 2011-08 is effective for annual<br />
and interim goodwill impairment tests performed for<br />
the fiscal years beginning after December 15, 2011. The Group<br />
will apply the provisions of ASU No. 2011-08 starting from the<br />
first quarter of 2012 and does not expect any material impact<br />
on its results of operations, financial position or cash flows.<br />
In June 2011, the FASB issued ASU No. 2011-05, “Presentation<br />
of comprehensive income,” which amends Topic 220 of the<br />
Codification. This ASU increases the prominence of other<br />
comprehensive income in financial statements. Under this<br />
ASU, an entity will have the option to present the components<br />
of net income and comprehensive income in either one<br />
or two statements. The ASU eliminates the option in US GAAP<br />
to present other comprehensive income in the statement<br />
of changes in equity. ASU No. 2011-05 is effective for public<br />
entities for fiscal years, and interim periods within those<br />
years, beginning after December 15, 2011 and should be<br />
applied retrospectively. The Group will apply the provisions<br />
of ASU No. 2011-05 starting from the first quarter of 2012.<br />
227
In May 2011, the FASB issued ASU No. 2011-04, “Amendments<br />
to Achieve Common Fair Value Measurement and Disclosure<br />
Requirements in US GAAP and IFRSs,” which amends Topic<br />
820 of the Codification. This ASU provides guidance for fair<br />
value measurements and disclosure requirements and clarifies<br />
the Board’s intent about the application of existing fair<br />
value measurement requirements. The new standard does<br />
not extend the use of fair value but, rather, provides guidance<br />
about how fair value should be applied where it already<br />
is required or permitted under US GAAP. ASU No. 2011-04 is<br />
effective for public entities during interim and annual<br />
periods beginning after December 15, 2011 and should be<br />
applied prospectively. The Group will apply the provisions<br />
of ASU No. 2011-04 starting from the first quarter of 2012<br />
and does not expect any material impact on its results of<br />
operations, financial position or cash flows.<br />
228
Forward-looking statements<br />
Certain statements in this document are not historical facts<br />
and are “forward-looking.” We may from time to time make<br />
written or oral forward-looking statements in reports to<br />
shareholders and in other communications. Examples of such<br />
forward-looking statements include, but are not limited to:<br />
• statements of our plans, objectives or goals, including<br />
those related to products or services<br />
• statements of future economic performance<br />
• statements of assumptions underlying such statements<br />
Forward looking statements that may be made by us from<br />
time to time (but that are not included in this document)<br />
may also include projections or expectations of revenues,<br />
income (or loss), earnings (or loss) per share, dividends, capital<br />
structure or other financial items or ratios. Words such<br />
as “believes,” “anticipates,” “expects,” “estimates,” “intends”<br />
and “plans” and similar expressions are intended to identify<br />
forward-looking statements but are not the exclusive means<br />
of identifying such statements. By their very nature, forwardlooking<br />
statements involve inherent risks and uncertainties,<br />
both general and specific, and risks exist that the predictions,<br />
forecasts, projections and other forward-looking statements<br />
will not be achieved. You should be aware that a number<br />
of important factors could cause actual results to differ<br />
materially from the plans, objectives, expectations, estimates<br />
and intentions expressed in such forward-looking statements.<br />
These factors include:<br />
• inflation, interest rate and exchange rate fluctuations<br />
• the price of oil<br />
• the effects of, and changes in, Russian government<br />
policy<br />
• the effects of competition in the geographic<br />
and business areas in which we conduct<br />
operations<br />
• the effects of changes in laws, regulations, taxation<br />
or accounting standards or practices<br />
• our ability to increase market share for our<br />
products and control expenses<br />
• acquisitions or divestitures<br />
• technological changes<br />
• our success at managing the risks<br />
of the aforementioned factors.<br />
This list of important factors is not exhaustive. When relying<br />
on forward-looking statements, you should carefully consider<br />
the foregoing factors and other uncertainties and events,<br />
especially in light of the political, economic, social and legal<br />
environment in which we operate. Such forward-looking<br />
statements speak only as of the date on which they are made,<br />
and, subject to any continuing obligations under the Listing<br />
Rules of the U.K. Listing Authority, we do not undertake<br />
any obligation to update or revise any of them, whether<br />
as a result of new information, future events or otherwise.<br />
We do not make any representation, warranty or prediction<br />
that the results anticipated by such forward-looking<br />
statements will be achieved, and such forward-looking<br />
statements represent, in each case, only one of many possible<br />
scenarios and should not be viewed as the most likely<br />
or standard scenario.<br />
229
Reference Information<br />
The most complete and up-to-date information<br />
about LUKOIL can always be found on the Company’s<br />
website: www.lukoil.ru (Russian) or www.lukoil.com<br />
(English).<br />
The site also provides information about trends<br />
and results of LUKOIL’s business, as well as accurate<br />
and up-to-date information about events concerning<br />
the Company and the whole spectrum of LUKOIL<br />
activities, including details of the Company’s social<br />
and environmental policies.<br />
The Investor Center section of the site presents the<br />
company's financial and industrial results, dividend<br />
history, share prices, a calculator for investors,<br />
a shareholder tool-box, presentations for investors,<br />
and Company reports.<br />
Legal Address and Central Office<br />
11, Sretensky Boulevard, Moscow, 101 000, Russia<br />
Central Information Service<br />
Tel: +7 (495) 627-44-44, 628-98-41<br />
Fax: +7 (495) 625-70-16<br />
Shareholder Relations<br />
Tel: +7 (495) 983-21-71, (800) 200-94-02<br />
Fax: +7 (495) 627-41-91<br />
E-mail: shareholder@lukoil.com<br />
Investor Relations<br />
Tel: + 7 (495) 627-16-96<br />
Fax: + 7 (495) 981-72-88<br />
E-mail: ir@lukoil.com<br />
Press Service<br />
Tel: +7 (495) 627-16-77<br />
Fax: +7 (495) 627-16-53<br />
E-mail: media@lukoil.com<br />
LUKOIL Stock Consulting Center<br />
Р11, Sretensky Boulevard, Moscow, 101 000, Russia<br />
Tel: + 7 (495) 981-79-18<br />
Fax: + 7 (495) 627-41-91<br />
NIKOIL Registrar Company<br />
8 Ivano Franko street, Moscow, 121108, Russia<br />
Tel/fax for individuals: + 7 (495) 933-67-39<br />
Tel/fax for corporates: + 7 (495) 926-81-61<br />
Published reports<br />
Electronic versions of the following reports are<br />
available on the Company web site:<br />
1. Report on Company Business.<br />
2. Consolidated Financial Accounts.<br />
3. Quarterly Consolidated Financial Accounts.<br />
4. Management Discussion and Analysis of Financial<br />
Situation and Results of Operations<br />
5. Analyst DataBook.<br />
6. Fact book.<br />
Concepts and abbreviations used<br />
in the Report<br />
Mentions of ‘OAO LUKOIL’, ‘LUKOIL Group’, ‘the Group’,<br />
‘LUKOIL’, ‘the Company’, ‘we’ and ‘our’ are equivalent<br />
for the purposes of this Report and refer to LUKOIL<br />
Group of companies, to LUKOIL and/or its subsidiary<br />
enterprises, depending upon the context in which<br />
the terms are used.<br />
The average ruble/dollar exchange rate for 2011<br />
(29.39 rubles/dollar) is used in conversion of ruble<br />
figures for expression in dollars, unless otherwise<br />
indicated.<br />
Figures for reserves and production of oil include oil,<br />
gas condensate and gas liquids.<br />
‘Regions’ with a capital ‘R’ refers to administrative<br />
divisions of the Russian Federation, ‘regions’ with<br />
a small ‘r’ refers to general geographical divisions.<br />
‘Reference fuel’ is a rough measure to enable<br />
comparisons between different types of fuel, based<br />
on their energy content. 1 tonne of reference fuel =<br />
one tonne of crude oil = 1,000 cubic meters<br />
of natural gas.<br />
abbreviations<br />
boe – barrels of oil equivalent (1 boe = 6,000 cubic<br />
feet of gas)<br />
km – kilometer<br />
ppm – parts per million<br />
PSA – production sharing agreement<br />
RTS – Russian Trading System<br />
MICEX – Moscow Interbank Currency Exchange<br />
230