Rayleigh criterion for spatial resolution - NSRRC User Portal
Rayleigh criterion for spatial resolution - NSRRC User Portal
Rayleigh criterion for spatial resolution - NSRRC User Portal

You also want an ePaper? Increase the reach of your titles
YUMPU automatically turns print PDFs into web optimized ePapers that Google loves.
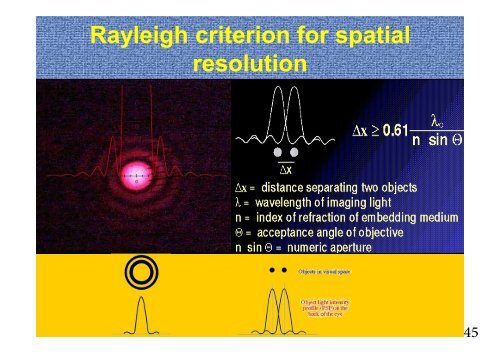
<strong>Rayleigh</strong> <strong>criterion</strong> <strong>for</strong> <strong>spatial</strong><br />
<strong>resolution</strong><br />
45
The <strong>Rayleigh</strong> <strong>criterion</strong> is the generally accepted <strong>criterion</strong> <strong>for</strong> the<br />
minimum resolvable detail - the imaging process is said to be<br />
diffraction-limited when the first diffraction minimum of the image of<br />
one source point coincides with the maximum of another.<br />
Circular aperture<br />
Single slit<br />
47
=1.22λ/(2N. A. )=0.61λ/nsinθ<br />
48
Calculating Diffraction:<br />
r=1.22λ/(2N. A. )=0.61λ/nsinθ<br />
d<br />
For 1469 cm<br />
(1469 cm -1<br />
d<br />
<br />
1.22 λ<br />
N.A.obj. <br />
-1<br />
1.22(6.8 μm)<br />
<br />
0.58 0.71<br />
,<br />
N.A.cond.<br />
6.8 μm)<br />
<br />
6.4 μm<br />
When calculating diffraction the Numeric Aperture of the objective and condenser as<br />
well as the wavelength of interest. The Numerical Aperture is calculated as:<br />
N.A = n sin (u) (where n = refractive index of the medium and u = the semi-field<br />
angle of the optical device.<br />
In general, the higher the Numerical Aperture, the better. The drawback of high<br />
Numeric Aperture is a small working distance and a very small depth of view.<br />
49
Focal Plane Array (FPA) Detectors<br />
<strong>for</strong> Full-Field Imaging<br />
There are a variety of Detector arrays, including<br />
MCT, InSb, PtSi, Si, Si:As etc.<br />
The array sizes vary from 16 x 16, up to 1024 x<br />
1024 pixels<br />
320 x 240 Si:As<br />
128 x 128 MCT<br />
1024 x 1024 InSb<br />
64 x 64 MCT<br />
50
Full-Field FT-IR imaging system<br />
Hyperion 3000<br />
FFT<br />
Optical layout of FPA-base FT-IR imaging system<br />
51
Focal Plane Array (FPA) Detectors<br />
<strong>for</strong> Full-Field Imaging<br />
“The missile is equipped with an imaging<br />
infrared seeker which is based on mercury<br />
cadmium telluride (HgCdTe) Focal Plane<br />
Array technology in the long wave infra-red<br />
band at wavelength 8 to 12 microns of the<br />
electromagnetic spectrum.”<br />
The MCT 64 x 64 element array was developed <strong>for</strong> the Javelin anti-tank<br />
missile program<br />
These arrays are only a ‘reasonable’ price because of the number being<br />
manufactured <strong>for</strong> this program<br />
52
II. Background and Motivation<br />
Infrared spectra are obtained from individual living cells.<br />
• Lipids (cell walls)<br />
• Nucleic acids (DNA, RNA)<br />
• Proteins<br />
• Each of these major<br />
classes of cellular<br />
components have<br />
distinct IR markers<br />
53
Chemical Features of Biological Components<br />
Amide A<br />
Amide B<br />
54
DNA/RNA<br />
n s<br />
(C-O-C)<br />
55
II. Background and Motivation (Cont.)<br />
1. Higher An as CH 2 / An as CH 3 (lipid/<br />
protein ratio) was found in the<br />
cancer tissues than that of Normal<br />
tissues.<br />
2. The ratio could be affected by<br />
different method of fixation <strong>for</strong><br />
tissue sample.<br />
3. IR spectrum marker is also<br />
strongly disturbed by different<br />
sample preparation.<br />
Normal<br />
Cancer<br />
R. K. Sah, Journal of Biomedical Optics, 10(5), 054017 (2005)<br />
J. G. Wu, Biospectroscopy 62, 185 (2001)<br />
56
II. Background and Motivation(Cont.)<br />
Fig.1<br />
Fig.3<br />
Fig.2<br />
(iii)<br />
(ii)<br />
(i)<br />
Fig. 1. Raman of pure paraffin wax<br />
Fig. 2. Raman spectra comparing (i) paraffin<br />
wax, (ii) frozen tissue section of cervical<br />
cancer and (iii) dewaxed FFPP (Formalin<br />
Fixed Paraffin Processed) tissue section of<br />
cervical cancer.<br />
Fig. 3 Raman spectra after each subsequent<br />
dewaxing cycle using xylene.<br />
57
2.4<br />
2 hr xylene washing<br />
Malignant part of tissue section<br />
T 1<br />
T 2<br />
Normal colon tissue<br />
N 1<br />
Absorbance<br />
Colon cancer tissue<br />
T 1<br />
0.0<br />
N 2<br />
N 3<br />
Absorbance<br />
1.8<br />
1.2<br />
0.6<br />
N 1<br />
2.4<br />
Normal part of tissue section<br />
Wavenumbers/ cm -1 N 2<br />
1.8<br />
N 3<br />
1.2<br />
0.6<br />
0.0<br />
3500 3000 2500 2000 1500 1000<br />
T 3<br />
T 2<br />
T 3<br />
58
Construction of Spectral Image<br />
0 . 3<br />
0 .1 5<br />
P a ra ffi n<br />
B e e s w a x<br />
Absorbance<br />
0 . 2<br />
0 . 1<br />
Absorbance<br />
0 .1 0<br />
0 .0 5<br />
0 .0 0<br />
IR spectrum of cell sample<br />
3 5 0 0 3 0 0 0 2 5 0 0 2 0 0 0 1 5 0 0 1 0 0 0<br />
W a v e n u m b e r/c m -1<br />
0 . 0<br />
3 5 0 0 3 0 0 0 2 5 0 0 2 0 0 0 1 5 0 0 1 0 0 0<br />
W a v e n u m b e r s / c m<br />
- 1<br />
Reference Image<br />
Be<strong>for</strong>e Treatment<br />
Cell sample<br />
Cells image<br />
After Treatment<br />
The area beneath the spectral curve was integrated in the range of 3000-<br />
2800 cm -1 , being the absorbance of wax residual of cell sample and<br />
collected to construct spectral image to be identify disease stage of cell.<br />
59
III. Experimental Strategies:<br />
Part 1. Bias-assisted Wax Physisorption using<br />
FTIR imaging <strong>for</strong> Cancer Diagnosis<br />
Part 2. Cancer Therapy by using Alternating<br />
Electric Fields<br />
60
III. Part 1. Bias-assisted Wax Physisorption<br />
Kinetics using FTIR imaging <strong>for</strong> Cancer Diagnosis<br />
nHOK /OECM-1 /SCC-15 /SCC-25 /OC-2 / OC-3<br />
@ G1 phase<br />
Step 2 Step 3<br />
A<br />
Alkanes(C n H 2n+2 )<br />
(N=22,23,24,25,26,28,<br />
30,32,34)<br />
Cells fixed on Low-e silde<br />
Step 1<br />
B<br />
Paraffin<br />
(C 25 H 52 )<br />
Beeswax<br />
(C 46 H 92 O 2 )<br />
C. Deglycosylation<br />
D. Hydrolysis<br />
Enzyme<br />
Waxing<br />
<strong>for</strong> 2 min<br />
Waxing and Dewaxing<br />
Stand and dry<br />
<strong>for</strong> 10 min<br />
Dewaxing<br />
<strong>for</strong> 5 s<br />
FT-IR imaging<br />
128 scans, 8 cm -1<br />
Xylene<br />
Washing<br />
E. + - Bias<br />
+<br />
E E = V/d<br />
d=0.5 cm<br />
V= 10..300<br />
Focal-plane-array-based Synchrotron-based<br />
FT-IR imaging system<br />
61
+<br />
+++++<br />
+<br />
+++++<br />
Part II. Innovative Cancer Therapy by using<br />
Alternating Electric Fields<br />
Interfering biological<br />
processes within cancer cells<br />
Apoptosis<br />
FTIR analysis of AEF<br />
treated cancer cell<br />
_ _ _ _ _ _ _ _ _ _ _<br />
Absorbance<br />
1.0<br />
0.8<br />
0.6<br />
0.4<br />
0.2<br />
AEF treatment of SCC-15<br />
25o kHz,E= 2 V/ cm treatment of SCC-15<br />
Amide A<br />
Lipid<br />
(V S CH and V as CH)<br />
Amide B<br />
Vs C=O<br />
Amide I<br />
Amide II<br />
DNA/RNA<br />
FTIR imaging<br />
apoptotic cell<br />
0.0<br />
3500 3000 2500 2000 1500 1000<br />
Wavenumber/ cm -1<br />
62
VI. Results and Discussion<br />
Treatment A:<br />
Wax Residual <strong>for</strong> Oral Cells by using alkane with different chain length as<br />
diagnostic agent (22C~34C) to pick out a suited alkane <strong>for</strong> differentiating<br />
malignancy from sample<br />
Aborbance (ABS)<br />
400<br />
320<br />
240<br />
160<br />
80<br />
nHOK SCC-25 SCC-15<br />
OC-2 OC-3 OEC-M1<br />
Pentacosane<br />
Triacontane<br />
Beeswax<br />
0<br />
C22H46 C23H48 C24H50 C25H52 C26H54 C27H56 C28H58 C30H62 C46H92O2 C32H66 C34H70 --<br />
The chain length of alkanes<br />
*Absorbance of averaged wax residue is divided by no. of carbon atom and cells<br />
63
Treatment B:<br />
Paraffin and Beeswax as diagnostic agents<br />
Normal Oral Cells<br />
Reference image<br />
Oral Cancer Cells<br />
The results of kinetic FT-IR imaging of Normal Oral cells showed a stronger<br />
capability of physisorption with paraffin than that of beeswax.<br />
The Oral Cancer cells showed a greater capability <strong>for</strong> adsorbing beeswax than<br />
that of paraffin.<br />
1. Lee et al., Method <strong>for</strong> detecting cancer and reagents <strong>for</strong> use therein, USA patent,<br />
US-8-354,222 B2 (2013); Japan patent, 119309 (2013)<br />
2. Chiu et al., Anal. Bioanal. Chem. 405 , 1995 (2013)<br />
64
Relative Paraffin Residues used as diagnostic agent<br />
<strong>for</strong> differentiating Colorectal Normal from Malignancy<br />
CCD-18Co<br />
Xylene washing<br />
60 min<br />
5 s<br />
Deparaffining<br />
10 s<br />
50 mm<br />
SW-480<br />
Paraffining<br />
2 min<br />
SW-403<br />
65
Relative Beeswax Residues used as diagnostic agent<br />
<strong>for</strong> differentiating Colorectal Malignancy from Normal<br />
CCD-18Co<br />
Xylene washing<br />
60 min<br />
5 s<br />
Debeeswaxing<br />
10 s<br />
50 mm<br />
SW-480<br />
Beeswaxing<br />
2 min<br />
SW-403<br />
66