Education kit: What are the odds? - Powerhouse Museum
Education kit: What are the odds? - Powerhouse Museum
Education kit: What are the odds? - Powerhouse Museum

You also want an ePaper? Increase the reach of your titles
YUMPU automatically turns print PDFs into web optimized ePapers that Google loves.
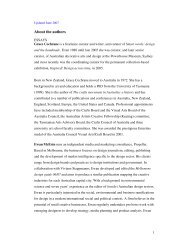
9. Taxation revenue, Australian<br />
Bureau of Statistics, Australia.<br />
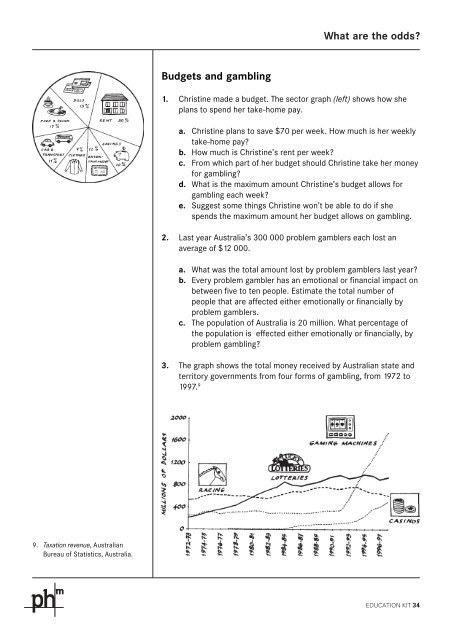
Budgets and gambling<br />
<strong>What</strong> <strong>are</strong> <strong>the</strong> <strong>odds</strong>?<br />
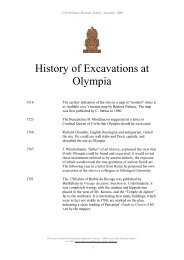
1. Christine made a budget. The sector graph (left) shows how she<br />
plans to spend her take-home pay.<br />
a. Christine plans to save $70 per week. How much is her weekly<br />
take-home pay?<br />
b. How much is Christine’s rent per week?<br />
c. From which part of her budget should Christine take her money<br />
for gambling?<br />
d. <strong>What</strong> is <strong>the</strong> maximum amount Christine’s budget allows for<br />
gambling each week?<br />
e. Suggest some things Christine won’t be able to do if she<br />
spends <strong>the</strong> maximum amount her budget allows on gambling.<br />
2. Last year Australia’s 300 000 problem gamblers each lost an<br />
average of $12 000.<br />
a. <strong>What</strong> was <strong>the</strong> total amount lost by problem gamblers last year?<br />
b. Every problem gambler has an emotional or financial impact on<br />
between five to ten people. Estimate <strong>the</strong> total number of<br />
people that <strong>are</strong> affected ei<strong>the</strong>r emotionally or financially by<br />
problem gamblers.<br />
c. The population of Australia is 20 million. <strong>What</strong> percentage of<br />
<strong>the</strong> population is effected ei<strong>the</strong>r emotionally or financially, by<br />
problem gambling?<br />
3. The graph shows <strong>the</strong> total money received by Australian state and<br />
territory governments from four forms of gambling, from 1972 to<br />
1997. 9<br />
EDUCATION KIT 34