Biomass Feasibility Project Final Report - Xcel Energy
Biomass Feasibility Project Final Report - Xcel Energy
Biomass Feasibility Project Final Report - Xcel Energy

You also want an ePaper? Increase the reach of your titles
YUMPU automatically turns print PDFs into web optimized ePapers that Google loves.
FINAL REPORT<br />
Identifying Effective<br />
BIOMASS<br />
S t r a t e g i e s<br />
Quantifying Minnesota’s Resources<br />
and Evaluating Future Opportunities<br />
Keith Butcher, <strong>Project</strong> Manager<br />
Presented to:<br />
<strong>Xcel</strong> <strong>Energy</strong><br />
Renewable Development Fund (RD-94)<br />
October 2007
FOREWORD<br />
This report was funded by a grant from <strong>Xcel</strong> <strong>Energy</strong>’s Renewable Development Fund (RDF). The purpose of<br />
the RDF is to promote the use of renewable fuels to generate electricity.<br />
The Prairie Island agreement also ordered <strong>Xcel</strong> <strong>Energy</strong> (Northern States Power at the time) to create<br />
specific amounts of electric power from renewable fuels like wind and biomass. Since then, the RDF has<br />
funded a number of one-off biomass projects, but biomass power has not grown as quickly and surely as<br />
wind power. (For a history of biomass projects, see Chapter VII.) The biomass mandate of 1994 was not<br />
fulfilled until 2007 and has never met its original terms.<br />
The reason for biomass’s long gestation period seems to be that, while wind technology is well developed<br />
and understood, biomass projects are to some degree experimental. <strong>Biomass</strong> power is far more<br />
complicated and contingent than wind power. Neither the developers of biomass power projects or the<br />
regulators, policy makers, communities, and funders who must assess them have had enough information<br />
to make a confident evaluation.<br />
This study attempts to provide an objective evaluation of Minnesota’s biomass resources, not to argue for<br />
or against particular bio-power projects or initiatives. Because bio-power responds to emerging state and<br />
federal energy policies, bio-power projects almost certainly will be designed and built. The question is how<br />
best to accomplish that within the limitations of natural and financial resources, including the pocketbooks<br />
of electric ratepayers. Although its focus is electric generation, much of the study will also be useful to<br />
developers of other projects, like biofuels plants.<br />
That is not to say that our study pretends to be the last word. It is just the first step toward any specific<br />
biomass project. Because of biomass’s complexity and contingency, the developer of a specific project<br />
will need go into far more detail at the local level than this study could possibly provide.<br />
A number of expert specialists have contributed to this project:<br />
Kristen Funk (CEE)<br />
Dr. Jerry Fruin (Consultant)<br />
Dentley Haugesag (Consultant)<br />
Rod Jeter (CEE)<br />
Kyle MacLaury (CEE)<br />
John Madole (John Christopher Madole<br />
Associates, Inc.)<br />
Nick Mark (CEE)<br />
Kevin Nall (John Christopher Madole<br />
Associates, Inc.)<br />
Carl Nelson (Green Institute)<br />
Mike Pease (Consultant)<br />
Tom Spielman (CEE)<br />
Richard Szydlowski (CEE)<br />
Dr. Steven J. Taff (Consultant)<br />
Douglas Tiffany (Consultant)<br />
The following people unselfishly contributed their time in reviewing this final report. Their participation<br />
should not be construed as approval of or agreement with the project. The Center for <strong>Energy</strong> and<br />
Environment (CEE) is solely responsible for the content of this report.<br />
Al Doering (Agricultural Utilization Research Institute)<br />
Shalini Gupta (Izaak Walton League of America)<br />
Mark Lindquist (Minnesota Department of Natural Resources)<br />
Heather MacGee-Hill (Minnesota Pollution Control Agency)<br />
Dan O’Neill (Northland Securities)<br />
Mark Ritter (<strong>Xcel</strong> <strong>Energy</strong>)<br />
LEGAL NOTICE<br />
This report was prepared as a result of work sponsored by NSP. It does not necessarily represent the views of NSP, its<br />
employees, or the renewable development fund board. NSP, its employees, contractors, and subcontractors make no<br />
warranty, express or implied, and assume no legal liability for the information in this report; nor does any party represent<br />
that the use of this information will not infringe upon privately owned rights. This report has not been approved or<br />
disapproved by NSP nor has NSP passed upon the accuracy or adequacy of the information in this report.
OVERVIEW<br />
The profile of bio-power (electricity generated with biomass fuels) is rising with America’s<br />
concerns about the effect of fossil fuels on the environment. Bio-power’s contribution to U.S.<br />
energy supply has been flat since the mid 1990’s. That soon may change, however. The federal<br />
<strong>Energy</strong> Information Administration expects bio-power generation to double by 2025.<br />
This study seeks to provide an objective evaluation of Minnesota’s biomass resources, not to<br />
argue for or against particular bio-power projects or initiatives. Because bio-power responds to<br />
emerging state and federal energy policies, bio-power projects almost certainly will be designed<br />
and built. The question is how best to accomplish that within the limitations of natural and<br />
financial resources, including the pocketbooks of electric ratepayers.<br />
To that end, this study can help developers evaluate, select, build, and operate effective biopower<br />
projects, and help policy makers frame measures to support them. It has three<br />
components: (1.) a computer-based interactive calculator, the Bio-Power Evaluation Tool<br />
(BioPET), that identifies locations, types, and volumes of biomass fuels, adds construction and<br />
operation costs for various energy conversion technologies using them, and calculates the costs<br />
of power generated by various combinations of the above; (2.) a web-based, user-driven,<br />
electronic GIS tool, called gopher, that graphically represents the locations of, and relationships<br />
between, relevant infrastructure and biomass resources; and (3.) a written report providing<br />
background on technical, economic, political, and management issues central to the<br />
implementation of bio-power projects.<br />
By using all three of these components in parallel, developers can determine optimal<br />
combinations of location, infrastructure, biomass fuels, processing and conversion technology<br />
for their projects; funders can verify them; and policy makers can gauge the practical<br />
consequences of rules, regulations, and laws. Conversely, communities and economic<br />
developers can use these tools to scope out local resources they might use to attract bio-power<br />
developments to their areas.<br />
IDENTIFYING RESOURCES AND STRATEGIES<br />
Chapter II & III: <strong>Biomass</strong> Fuels Available for <strong>Energy</strong><br />
BIOMASS FEEDSTOCKS<br />
Agriculture<br />
Livestock<br />
Crops<br />
Crop<br />
Residues<br />
Ag. Processing<br />
Residues<br />
Manures<br />
Animal Processing<br />
Wastes<br />
Wood<br />
which includes:<br />
Municipal Waste<br />
Streams<br />
Timber<br />
Residues<br />
Urban Wood<br />
Wastes<br />
Identifying Effective <strong>Biomass</strong> Strategies:<br />
Quantifying Minnesota’s Resources and Evaluating Future Opportunities<br />
Page i
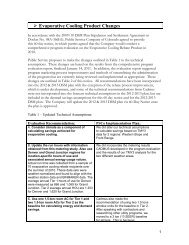
The BioPET tool includes more than 60 biomass feedstocks from fields, forests, livestock barns, and<br />
municipal waste streams. They were selected because they exist in quantity in Minnesota. The<br />
written report’s account of them may appear more authoritative than it really can be, having to<br />
rely as it does on assumptions and normalizations applied to an assortment of data from sources<br />
that used different methodologies. We detail our methodology in the appendices. If the BioPET<br />
user has better data, he/she is encouraged to substitute it into the computer-based evaluator.<br />
The text and the computer tool present our informed estimates, no more, no less.<br />
Using estimates detailed in Chapter II as Minnesota’s total growth or production of biomass<br />
feedstocks – their “theoretical potential” – Chapter III shows how much of those gross volumes<br />
an be captured physically – their “technical potential” – and how much of that might be usable<br />
for energy after deducting biomasses in high demand for other uses and hence too expensive<br />
to use as fuel.<br />
Sample Inventory Maps<br />
Page ii<br />
Identifying Effective <strong>Biomass</strong> Strategies:<br />
Quantifying Minnesota’s Resources and Evaluating Future Opportunities
This net-net amount usable for fuel is called biomass’s “economic potential.” It consists primarily<br />
of straws and stalks, woody residues, and manures to which we add municipal wastes. Another<br />
category with potential, dedicated energy crops like hybrid trees, switchgrass and diverse prairie<br />
grasses, could add more to the pile but are not yet grown in volume.<br />
One can argue over statistical and methodological issues that enter into the paper’s estimate of<br />
the bottom-line quantity of biomass available for electric generation, but the goal of this analysis<br />
is not an absolute certainty that probably is impossible anyway. It is clear enough from this<br />
process of elimination that biomass is unlikely to supply a major share of Minnesota’s electric<br />
power. That does not mean, however, that it is not worth considering. It will take a broad array<br />
of renewable fuels to supplant fossil fuels.<br />
Chapter IV: <strong>Biomass</strong> Harvesting, Processing and Transportation<br />
Unlike coal and natural gas, biomass can’t be taken out of the ground and simply tossed into a<br />
boiler. Different biomasses call for different collecting, processing, transporting, and storing<br />
regimes. This crucial transition from the field or forest to the facility can make or break a biomass<br />
project. <strong>Biomass</strong> may be waste to begin with, but after it is collected, processed, transported,<br />
stored, and delivered, on a BTU basis it costs more at the plant than coal.<br />
A new generation of harvesting machines and procedures will do a better job of keeping crop<br />
wastes clean, and that will benefit not only bio-power but other emerging green industries like<br />
cellulosic ethanol as well. Contaminants like grit can destroy any kind of equipment. After<br />
harvest and collection, processing might include drying to reduce bulk and weight, baling,<br />
densification into pellets, or size reduction by chipping, grinding or chopping. Storage can<br />
occur anywhere along the path to the power plant, depending on local logistics, but drying is<br />
usually preliminary in order to minimize degradation of the biomass. Storage facilities can range<br />
from piles on the ground to enclosed and ventilated barns, but the desired end result is clean,<br />
high-quality fuel delivered to the power plant.<br />
The gopher computer tool allows the user to select and stack geographical information with BioPET<br />
resource estimations to create a complete picture of biomass resources and relevant<br />
infrastructure.<br />
Chapter V & VI: Power Conversion Technologies and Applications<br />
From the time cavemen first set wood on fire until a few centuries ago, combustion of biomass<br />
was humankind’s main source of energy. In the past several centuries, however, fossil fuels like<br />
coal largely replaced biomass as fuel for combustion. Now that the world is once again looking<br />
to biomass fuels, engineers are exploring technologies better suited to their use. Simply<br />
substituting biomass one-for-one for coal in a boiler is impractical for reasons both technical and<br />
economic.<br />
Some efficient combustion technologies, like fluidized beds and suspension burners, can burn<br />
properly prepared biomass. But most research on biomass energy focuses on more<br />
sophisticated technologies, like gasification and pyrolysis, which extract more energy from<br />
biomass. Both technologies heat biomass to very high temperatures in vessels starved of<br />
oxygen. Lacking oxygen for combustion, the biomass gives off volatile gases in gasification, or<br />
liquid fuels in pyrolysis. Gases become fuels for turbines that drive generators, and liquids<br />
become fuels for internal combustion engines, boilers and combustion turbines connected to<br />
generators. Biodiesel also can fuel generator sets.<br />
Identifying Effective <strong>Biomass</strong> Strategies:<br />
Quantifying Minnesota’s Resources and Evaluating Future Opportunities<br />
Page iii
Co-firing. The cheapest and quickest way to put biomass to work generating electricity is to<br />
meter it into an existing coal-fired power plant. Most coal plants can digest up to 5% biomass<br />
without major modifications. Gases from gasified biomass also may be co-fired in natural gas<br />
“peaking” plants, so called because they fire up that expensive fuel in periods of peak demand,<br />
like hot summer days when air conditioners run full blast.<br />
Combined Heat and Power (CHP). Both fossil fuels and biomass have been widely used in CHP<br />
plants. This is a strategy that uses steam for power turbines and heat for industrial processes or<br />
space heating. CHP often is called “co-generation” because of its dual purpose.<br />
<strong>Biomass</strong> in the form of waste streams in industrial plants has fueled co-generation for well over a<br />
century. Burning wastes is essential to the economics of pulp and paper mills and lumber mills,<br />
most of which dispose of their wood wastes that way and, in the process, generate much of<br />
their power and all of their process steam. The forest products industry is primarily responsible for<br />
the ranking of biomass as the second largest category of renewable energy in the U.S., after<br />
hydroelectricity.<br />
Co-generation has the advantage of increasing the overall energy efficiency of its host plant by<br />
using steam for purposes beyond power generation. It has the potential to do even more than<br />
that. Academic and corporate researchers are developing new technologies that may turn<br />
major industrial facilities, like paper mills, into exporters of power to the grid.<br />
Municipal applications of CHP are rare in Minnesota, but three noteworthy examples, St. Paul<br />
District <strong>Energy</strong> and the plants of the Laurentian <strong>Energy</strong> Authority in Hibbing and Virginia on the<br />
Iron Range, burn woody biomass in centralized energy plants to heat urban districts and<br />
generate power for <strong>Xcel</strong> <strong>Energy</strong>’s renewable portfolio.<br />
Gasification in ethanol plants. Ethanol is raising concerns among environmentalists, food and<br />
feed processors and livestock producers, but it is a well established Minnesota industry with 16<br />
plants and more to come. Natural gas is a major cost item for ethanol plants, and so several are<br />
using, or planning to use, gasified biomass as a substitute. The Central Minnesota Ethanol Cooperative<br />
(CMEC) in Little Falls has made the big step of installing a gasifier. It uses its former gas<br />
boiler for process heat and power generation and is the only Minnesota ethanol plant selling<br />
power to a utility – one MW to <strong>Xcel</strong> <strong>Energy</strong>. Another project, Chippewa Valley Ethanol<br />
Company in Benson, is in the process of installing two gasifiers and plan to market its technology<br />
to other ethanol producers.<br />
Municipal waste treatment. The St. Paul Metro Plant uses a fluidized-bed incinerator burning biosolids<br />
to produce steam that heats the plant in winter and generates 5 MW of power for internal<br />
use in the summer. The Empire Waste Water Treatment Plant in Dakota County burns bio-gas<br />
from an anaerobic digester to make steam and generate power, an example of a strategy<br />
discussed earlier – using gaseous or liquid fuels from biomass to fuel turbine generators.<br />
Bio-power from manure. Two projects, one large and one small, are generating electricity from<br />
animal wastes. The Fibrowatt plant in Benson makes up to 55 MW of power from turkey litter<br />
(manure and wood shavings used for bedding) to sell to <strong>Xcel</strong> <strong>Energy</strong>. The Haubenschild farm<br />
near Princeton uses bio-gas from manure to generate 135 kW for internal use and for sale to the<br />
local power co-op.<br />
Page iv<br />
Identifying Effective <strong>Biomass</strong> Strategies:<br />
Quantifying Minnesota’s Resources and Evaluating Future Opportunities
Chapter VII: Government Policies, Incentives, and Financing<br />
The story of bio-power policy in Minnesota begins with the so-called “Prairie Island” legislation of<br />
1994. It ordered <strong>Xcel</strong> <strong>Energy</strong> to create specific amounts of energy from a list of renewable fuels,<br />
including wind, biomass, solar, and geothermal, in return for permission to store nuclear waste on<br />
land at its Prairie Island plant. Unfortunately, because the law was so prescriptive, rigid, and<br />
overly ambitious (it demanded, for example, that biomass fuel come from dedicated “closed<br />
loop” energy crops that didn’t exist then, and still don’t), not a single biomass project could be<br />
built to meet it. By dint of many patchwork amendments, the biomass mandate finally was<br />
fulfilled thirteen long years later.<br />
Minnesota has taken a huge step forward in promoting renewable electricity with the<br />
Renewable <strong>Energy</strong> Standards law of 2007. It requires utilities operating in the state to make<br />
gradual additions to their portfolios of renewable energy until 2025, at which point renewables<br />
will make up 25% of their total sales. <strong>Xcel</strong> <strong>Energy</strong> is held to a higher standard because of preexisting<br />
renewable energy mandated by the Prairie Island Agreement. <strong>Xcel</strong> <strong>Energy</strong>’s<br />
requirement is to provide 30% of retail sales through renewable resources by 2020.<br />
The utilities are expecting to meet the Standards mostly with wind power. <strong>Xcel</strong> <strong>Energy</strong> has even<br />
announced a new policy of developing its own wind farms in addition to its established practice<br />
of signing Power Purchase Agreements (PPAs) with independent developers. Wind farms may<br />
be easier to develop than biomass plants, but a world-wide shortage of wind turbines is<br />
complicating matters. All utilities, including <strong>Xcel</strong> <strong>Energy</strong>, probably will be interested in<br />
purchasing power from biomass developers with well-conceived plans and good track records.<br />
Government incentives. The most lucrative incentive offered by the State of Minnesota is called<br />
JOBZ. It exempts local property, state corporate, and sales taxes, including taxes on<br />
construction materials, until 2016. Since the statute excludes only retail from eligible projects, a<br />
power plant would be eligible. A project that expensive would save millions of dollars under<br />
JOBZ if the amendment is adopted.<br />
A federal program, New Markets Tax Credits, can help developers raise equity capital for<br />
projects because it offers investors a return 39% higher than the face value of dividends. A<br />
power plant with a guaranteed income in the form of a PPA could be attractive to investors.<br />
In 2007 the legislature extended Minnesota’s Community-Based <strong>Energy</strong> Development (C-BED)<br />
legislation, which formerly applied only to wind projects, to any type of renewable energy<br />
project. This should be a boon to biomass projects because their relatively modest scale and<br />
dependence on local biomass resources are appropriate to community projects.<br />
The NextGen act that also emerged from this energy-intensive session provides funding for<br />
renewable energy projects.<br />
Beyond those programs are a multitude of smaller programs, some aimed at businesses in<br />
general and some at energy projects in particular. A number of these might be stitched<br />
together to fill financing gaps. If a project involves development of a new technology, the<br />
federal Small Business Innovation and Research (SBIR) program housed at the Minnesota<br />
Department of Employment and Economic Development might provide a grant.<br />
Identifying Effective <strong>Biomass</strong> Strategies:<br />
Quantifying Minnesota’s Resources and Evaluating Future Opportunities<br />
Page v
SELECTING AND IMPLEMENTING PROJECTS<br />
Once potential resources are identified, the actual design, construction, and operation of a biopower<br />
project can be a significant challenge. The second half of the report focuses on<br />
evaluation of specific projects.<br />
Chapter VIII: Economic Evaluations<br />
Since only carefully thought-out projects are likely to attract financing, whether public or private,<br />
the tools that accompany this study attempt to steer the developer through the project<br />
selection process. The computer tools, BioPET and gopher, clarify issues of feedstocks,<br />
infrastructure, and financial assessments for user-specified, individual proposals. Their analyses<br />
culminate in outputs stated in terms of ¢/kWh and $/kW. This is not to say that straight<br />
economics is the only driver for project selection, but that it must be considered and understood<br />
when dealing with public and/or ratepayer funds. Both tools are available on CEE’s website<br />
(www.mncee.org).<br />
BioPET Main Shot<br />
Gopher Main Screen<br />
Chapter IX: Overcoming Barriers<br />
Chapter IX, Overcoming Barriers, addresses some of the many challenges a bio-power project<br />
might face and suggests some responses to them. We won’t list those challenges here because,<br />
out of context, they may appear hopelessly daunting. But developers who are able to confront<br />
and overcome those challenges will never have a better opportunity than this moment in history<br />
to move America into a new age of energy independence and environmental restoration.<br />
Chapter X: Opportunities<br />
We have attempted to identify those opportunities that represent the highest likelihood of<br />
success. These strategies include, in rank order: co-firing biomass with coal in existing facilities,<br />
utilizing CHP strategies for both electric generation and steam heat, replacing existing fossil-fuel<br />
burning facilities with a biomass feedstock (such as ethanol plants), retrofitting existing biomass<br />
facilities to increase power outputs (such as pulp and paper mills), burning bio-diesel in stand-by<br />
electric generation sets, and then, possibly, electric-only, biomass-fueled electric power plants.<br />
Page vi<br />
Identifying Effective <strong>Biomass</strong> Strategies:<br />
Quantifying Minnesota’s Resources and Evaluating Future Opportunities
Chapter XI: <strong>Project</strong> Development Handbook<br />
The <strong>Biomass</strong> Power <strong>Project</strong> Development Handbook contains a list of procedural and<br />
documentary steps in constructing the financial and legal structure necessary to a project.<br />
Appendices: Manuals, Resources, and References<br />
The first appendix is a software manual for using BioPET to compare different bio-power projects<br />
on an economic basis. Appendix B offers lists of organizations that are located or operating in<br />
Minnesota that may be able to assist you in developing a project. Appendices C and D detail<br />
many of our data assumptions and sources compiled in this study.<br />
Identifying Effective <strong>Biomass</strong> Strategies:<br />
Quantifying Minnesota’s Resources and Evaluating Future Opportunities<br />
Page vii
Table of Contents<br />
FOREWORD<br />
OVERVIEW .......................................................................................................................................... I<br />
Identifying Resources and Strategies ....................................................................................... i<br />
Chapter II & III: <strong>Biomass</strong> Fuels Available for <strong>Energy</strong>............................................................ i<br />
Chapter IV: <strong>Biomass</strong> Harvesting, Processing and Transportation ...................................iii<br />
Chapter V & VI: Power Conversion Technologies and Applications.............................iii<br />
Chapter VII: Government Policies, Incentives, and Financing .......................................v<br />
Selecting and Implementing <strong>Project</strong>s .................................................................................... vi<br />
Chapter VIII: Economic Evaluations.................................................................................... vi<br />
Chapter IX: Overcoming Barriers......................................................................................... vi<br />
Chapter X: Opportunities...................................................................................................... vi<br />
Chapter XI: <strong>Project</strong> Development Handbook ................................................................. vii<br />
Appendices: Manuals, Resources, and References....................................................... vii<br />
CHAPTER I: INTRODUCTION.............................................................................................................1<br />
The <strong>Project</strong>: Identifying Effective <strong>Biomass</strong> Strategies ............................................................2<br />
<strong>Project</strong> History...........................................................................................................................2<br />
Mission .......................................................................................................................................3<br />
Goals .........................................................................................................................................3<br />
The Approach: Quantifying Minnesota’s Resources and Evaluating Future<br />
Opportunities................................................................................................................................4<br />
<strong>Final</strong> <strong>Report</strong>...............................................................................................................................4<br />
BioPET.........................................................................................................................................5<br />
gopher.............................................................................................................................................5<br />
CHAPTER II: BIOMASS FUELS............................................................................................................7<br />
<strong>Biomass</strong> Categorizations............................................................................................................7<br />
BioPET Assumptions and User-Defined Fields (UDFs)..........................................................8<br />
Assessment ...............................................................................................................................8<br />
Estimation of Feedstock Characteristics .................................................................................8<br />
Agricultural Crops..................................................................................................................10<br />
Crop Residues ........................................................................................................................12<br />
Agricultural Processing Residues.........................................................................................14<br />
Wood.......................................................................................................................................16<br />
Manures ..................................................................................................................................18<br />
Animal Processing .................................................................................................................20<br />
Municipal Waste Streams.....................................................................................................22<br />
Fossil Fuels ...............................................................................................................................22<br />
Dedicated <strong>Energy</strong> Crops .....................................................................................................23<br />
Notes on Data Resources.........................................................................................................24<br />
Agriculture (Crops and Crop Residues) ............................................................................24<br />
Agricultural Processing Wastes ...........................................................................................25<br />
Wood.......................................................................................................................................26<br />
Manures ..................................................................................................................................27<br />
The Conservation Reserve Program (CRP) .......................................................................27<br />
Data on Municipal Sludge...................................................................................................28
Fuel Selection Considerations.................................................................................................28<br />
CHAPTER III: BIOMASS AVAILABILITY FOR ENERGY ...................................................................30<br />
Current <strong>Biomass</strong> Potential Relative to Statewide <strong>Energy</strong> Use ............................................30<br />
From Theoretical to Technical to Economic Availability................................................31<br />
Theoretical <strong>Biomass</strong> <strong>Energy</strong> Potential ................................................................................31<br />
Technical <strong>Biomass</strong> <strong>Energy</strong> Potential...................................................................................32<br />
Economic <strong>Biomass</strong> <strong>Energy</strong> Potential..................................................................................32<br />
Categories with Greatest Economic <strong>Biomass</strong> <strong>Energy</strong> Potential ........................................34<br />
Conversion to Units of Electricity.........................................................................................36<br />
Comparing Theoretical, Technical and Economic Availability ....................................37<br />
Comparing Costs of <strong>Biomass</strong> and Fossil Fuels ..................................................................38<br />
Summary.....................................................................................................................................39<br />
CHAPTER IV: BIOMASS HARVESTING, PROCESSING AND TRANSPORTATION ........................40<br />
Harvesting agricultural biomass .............................................................................................40<br />
Harvesting Timber......................................................................................................................40<br />
Physical factors affecting biomass processing....................................................................41<br />
Moisture Content...................................................................................................................41<br />
Wood Particle Size.................................................................................................................41<br />
Anaerobic Digester Particle Size.........................................................................................42<br />
Chemical Composition and Physical Characteristics ....................................................43<br />
Issues of Scale ........................................................................................................................44<br />
Processing for Transportation ..................................................................................................44<br />
Wood Chipping .....................................................................................................................45<br />
Baling.......................................................................................................................................45<br />
Pelleting ..................................................................................................................................46<br />
Processing for Storage..............................................................................................................46<br />
Baled Agricultural <strong>Biomass</strong> ..................................................................................................47<br />
Woody Fuels ...........................................................................................................................47<br />
Fuel Degradation and Decomposition .............................................................................48<br />
Odors .......................................................................................................................................48<br />
Processing Corn Stover for Wet Storage ...........................................................................49<br />
Processing <strong>Biomass</strong> for Conversion to Power.......................................................................49<br />
<strong>Biomass</strong> Transportation and Infrastructure........................................................................50<br />
gopher...........................................................................................................................................50<br />
CHAPTER V: BIO-POWER CONVERSION TECHNOLOGIES .........................................................53<br />
Direct Combustion ....................................................................................................................54<br />
Pile Burners..............................................................................................................................55<br />
Stoker Grates..........................................................................................................................55<br />
Fluidized Beds.........................................................................................................................55<br />
Suspension Burners ................................................................................................................56<br />
Solving Problems in <strong>Biomass</strong> Combustion ............................................................................57<br />
Alkali Compounds in Conventional Boilers.......................................................................57<br />
Calcium Deposits in Fluidized Bed Boilers .........................................................................57<br />
Gasification ................................................................................................................................59<br />
Biological Gasification..........................................................................................................59<br />
Thermal Gasification.............................................................................................................60<br />
Liquefaction................................................................................................................................63
Pyrolysis....................................................................................................................................63<br />
Summary.....................................................................................................................................65<br />
Research Pursuits.......................................................................................................................66<br />
CHAPTER VI: PRESENT APPLICATIONS OF BIOMASS TECHNOLOGIES......................................68<br />
Co-Firing......................................................................................................................................68<br />
Co-Firing <strong>Biomass</strong> with Coal ................................................................................................68<br />
Examples of Co-Firing in Minnesota ...................................................................................70<br />
Co-Firing Gasified or Liquefied <strong>Biomass</strong> ............................................................................71<br />
Combined Heat and Power (CHP) or Co-Generation ........................................................71<br />
<strong>Biomass</strong> Co-Generation in Industrial Plants ......................................................................71<br />
<strong>Biomass</strong> Co-Generation in Minnesota...............................................................................73<br />
The U.S. Pulp and Paper Industry ............................................................................................73<br />
Challenges Facing the U.S. Paper Industry.......................................................................74<br />
<strong>Biomass</strong> Power in Pulp Mills ..................................................................................................75<br />
Minnesota’s Pulp and Paper Industry ................................................................................76<br />
Opportunities to Increase Power in Minnesota Mills........................................................77<br />
Minnesota’s Ethanol Industry...................................................................................................80<br />
<strong>Biomass</strong> <strong>Energy</strong> in Ethanol Plants........................................................................................82<br />
Municipal Combined Heat and Power..................................................................................83<br />
<strong>Biomass</strong> Municipal CHP Plants in Minnesota ....................................................................84<br />
Bio-Solids.....................................................................................................................................86<br />
Converting Bio-Solids into <strong>Energy</strong> .......................................................................................86<br />
Wastewater Treatment..............................................................................................................86<br />
<strong>Energy</strong> Generation in Minnesota Plants ............................................................................87<br />
Agricultural Wastes for Power Production .............................................................................88<br />
Turkey Litter.............................................................................................................................88<br />
Dairy Manure..........................................................................................................................88<br />
Municipal Solid Waste/Food Processing Residues...........................................................89<br />
Future Technology Options......................................................................................................89<br />
CHAPTER VII : GOVERNMENT ACTIONS ......................................................................................90<br />
Minnesota’s <strong>Biomass</strong> Mandate of 1994 .................................................................................90<br />
Introduction............................................................................................................................90<br />
History ......................................................................................................................................90<br />
The <strong>Project</strong>s ............................................................................................................................91<br />
Government Economic Development Incentives for <strong>Biomass</strong> Power <strong>Project</strong>s ..............98<br />
General-Purpose Economic Development Programs ....................................................98<br />
Bureau of Indian Affairs (BIA) ............................................................................................104<br />
Minnesota Regional Development Commissions (RDCs) ............................................105<br />
USDA Rural Development ..................................................................................................107<br />
Iron Range Resources.........................................................................................................108<br />
New Markets Tax Credits....................................................................................................111<br />
U.S. Small Business Administration.....................................................................................113<br />
<strong>Energy</strong>-Specific Incentive Programs ................................................................................115<br />
<strong>Xcel</strong> <strong>Energy</strong> Renewable Development Fund Grants....................................................118<br />
Tribal <strong>Energy</strong> Program.........................................................................................................118<br />
New Policy Initiatives ..............................................................................................................119<br />
Community-Based <strong>Energy</strong> Development (C-BED)........................................................119<br />
Minnesota’s Renewable <strong>Energy</strong> Standard .....................................................................119
Carbon Emissions Policy .....................................................................................................120<br />
Other State Policies.............................................................................................................120<br />
CHAPTER VIII: ECONOMIC EVALUATIONS ................................................................................122<br />
Bio-Power Evaluation Tool (BioPET).......................................................................................122<br />
Overall Structure..................................................................................................................123<br />
Algorithms .............................................................................................................................125<br />
Levelized Annual Costs (LACs)..........................................................................................126<br />
Simple Sensitivity Analysis ...................................................................................................127<br />
Multiple Variable Sensitivity Analysis (Monte Carlo).........................................................128<br />
Power Plant Assumptions ...................................................................................................128<br />
Feedstock Assumptions......................................................................................................131<br />
Probability Distributions.......................................................................................................133<br />
Results....................................................................................................................................134<br />
CHAPTER IX : OVERCOMING BARRIERS.....................................................................................137<br />
<strong>Biomass</strong> Power’s Challenges and Responses ....................................................................138<br />
Business Development Challenges......................................................................................138<br />
High Cost of <strong>Biomass</strong> Fuels.................................................................................................138<br />
Competition for Fuels..........................................................................................................140<br />
Problems in Securing Long-Term <strong>Biomass</strong> Fuel Supplies ...............................................141<br />
Information Gaps ................................................................................................................141<br />
High Capital Costs...............................................................................................................142<br />
Difficulties in Financing New Technologies.....................................................................143<br />
Difficulties in Permitting.......................................................................................................144<br />
High Transaction Costs .......................................................................................................144<br />
An Inability to Monetize Benefits.......................................................................................145<br />
Marketing of Waste Streams from Co-Firing ...................................................................145<br />
Legislative and Regulatory Challenges...............................................................................146<br />
Lessons Learned from the <strong>Biomass</strong> Mandate.................................................................146<br />
The Challenge of Picking Winners in Evolving Technologies .......................................148<br />
Broad and Narrow Policy Measures.................................................................................149<br />
Facilitating Regulatory/<strong>Project</strong> Development Process.................................................152<br />
Questions of Sustainability .....................................................................................................154<br />
CHAPTER X : SEEKING OPPORTUNITIES ......................................................................................155<br />
Opportunity 1: Co-Firing Coal with <strong>Biomass</strong> .......................................................................155<br />
Opportunity 2: <strong>Biomass</strong> Combined Heat and Power ........................................................156<br />
Opportunity 3: Substituting <strong>Biomass</strong> for Coal......................................................................156<br />
Opportunity 4: Retrofitting Existing <strong>Biomass</strong> Facilities........................................................157<br />
Opportunity 5: <strong>Biomass</strong> Power at Ethanol Facilities...........................................................157<br />
Opportunity 6: Biodiesel in Generator Sets .........................................................................158<br />
Opportunity 7: Anaerobic Digesters.....................................................................................159<br />
Opportunity 8: Electric-Only Power Plants ..........................................................................160<br />
Other CHP Opportunities........................................................................................................160<br />
Summary...................................................................................................................................161<br />
CHAPTER XI: BIOMASS POWER PROJECT DEVELOPMENT HANDBOOK .................................162<br />
Introduction ..............................................................................................................................162<br />
Conditions Precedent.............................................................................................................162<br />
Other Considerations..............................................................................................................164<br />
Ownership and Financial Structure..................................................................................164
Feedstock and Site Selection............................................................................................164<br />
Sufficient Feedstock Supplies ............................................................................................164<br />
Access to Existing Utility Infrastructure .............................................................................164<br />
Access to Adequate Transportation Infrastructure.......................................................165<br />
Sufficient Water Supplies....................................................................................................165<br />
Supportive Local Community ...........................................................................................165<br />
Facility Design ..........................................................................................................................165<br />
Financing ..................................................................................................................................165<br />
<strong>Biomass</strong> <strong>Project</strong> Finance Steps..........................................................................................166<br />
Environmental Permits ............................................................................................................167<br />
Environmental Assessments...................................................................................................167<br />
Environmental Assessment Worksheet.............................................................................167<br />
Environmental Impact Statement ....................................................................................167<br />
Alternative Urban Area-wide Review ..............................................................................167<br />
Size criteria for Environmental Reviews............................................................................168<br />
Air Permits .................................................................................................................................169<br />
Air Emissions Risk Analysis (AERA) ......................................................................................169<br />
Water Permits ...........................................................................................................................169<br />
Ground Water......................................................................................................................169<br />
Surface Water ......................................................................................................................170<br />
Water Discharge Permit .....................................................................................................170<br />
Public Waters Work Permit .................................................................................................170<br />
Utility Interconnection and Rate Agreements ....................................................................170<br />
Utility Interconnection.........................................................................................................170<br />
Rate Agreements ................................................................................................................171<br />
BIBLIOGRAPHY AND RESOURCES...............................................................................................173<br />
APPENDIX A : BIOPET MANUAL ..................................................................................................A-1<br />
Introduction ..............................................................................................................................A-1<br />
Overall Structure......................................................................................................................A-2<br />
Feedstock Scenario ............................................................................................................A-2<br />
Power Plant Scenario..........................................................................................................A-2<br />
<strong>Project</strong> Summary .................................................................................................................A-2<br />
<strong>Biomass</strong> Feedstocks................................................................................................................A-3<br />
Field Characteristics............................................................................................................A-4<br />
Defining the Fuel Delivery Path.........................................................................................A-5<br />
Electric Generating Facility .................................................................................................A-10<br />
Power Plant Characteristics ............................................................................................A-10<br />
Non-Electrical <strong>Energy</strong> Income ........................................................................................A-11<br />
Expenses .............................................................................................................................A-13<br />
Financing ............................................................................................................................A-14<br />
Save This Power Plant .......................................................................................................A-15<br />
<strong>Project</strong> Summary ...................................................................................................................A-16<br />
Results..................................................................................................................................A-16<br />
Sensitivity Analysis..............................................................................................................A-16<br />
Logs..........................................................................................................................................A-17<br />
Resource Directory................................................................................................................A-19<br />
APPENDIX B : INDUSTRY CONTACT LIST ......................................................................................B-1<br />
APPENDIX C : FEEDSTOCK CHARACTERISTICS..........................................................................C-1
APPENDIX D : DATA SOURCES ....................................................................................................D-1<br />
Introduction ..............................................................................................................................D-1<br />
Crop Residues ..........................................................................................................................D-1<br />
Major Sources ......................................................................................................................D-1<br />
Feedstock Specific Assumptions.......................................................................................D-2<br />
Crops .........................................................................................................................................D-3<br />
Crop Processing Residues......................................................................................................D-5<br />
Wood .........................................................................................................................................D-6<br />
Manures ....................................................................................................................................D-7<br />
Animal Processing Wastes .....................................................................................................D-8<br />
Other Waste Streams ..............................................................................................................D-8<br />
Fossil Fuels.................................................................................................................................D-9
List of Figures<br />
Figure I-1: Total Annual U.S. Electricity Generated from <strong>Biomass</strong>........................................................... 1<br />
Figure I-2: BioPET Main Screen ..................................................................................................................... 5<br />
Figure I-3: gopher Screen Shot .................................................................................................................... 5<br />
Figure II-1: <strong>Biomass</strong> Feedstocks Organizational Chart ............................................................................. 7<br />
Figure II-2: Example Alkali, Sulfur, and Chlorine Concentrations of Selected Wood Fuels .............. 10<br />
Figure II-3: Total <strong>Energy</strong> (Crops)................................................................................................................. 11<br />
Figure II-4: Total <strong>Energy</strong> by Percentage (Crops)..................................................................................... 11<br />
Figure II-5: Total <strong>Energy</strong> (Crop Residues).................................................................................................. 13<br />
Figure II-6: Total <strong>Energy</strong> by Percentage (Crop Residues)..................................................................... 13<br />
Figure II-7: Total <strong>Energy</strong> (Agricultural Processing Residues).................................................................. 15<br />
Figure II-8: Total <strong>Energy</strong> by Percentage (Agricultural Processing Residues)...................................... 15<br />
Figure II-9: Total <strong>Energy</strong> (Wood) ................................................................................................................ 17<br />
Figure II-10: Total <strong>Energy</strong> by Percentage (Wood) .................................................................................. 17<br />
Figure II-11: Total <strong>Energy</strong> (Manures) .......................................................................................................... 19<br />
Figure II-12: Total <strong>Energy</strong> by Percentage (Manures) .............................................................................. 19<br />
Figure II-13: Total <strong>Energy</strong> (Animal Processing Residues) ....................................................................... 20<br />
Figure II-14: Total <strong>Energy</strong> by Percentage (Animal Processing Residues) ........................................... 20<br />
Figure II-15: Total <strong>Energy</strong> (Municipal Waste Streams) ........................................................................... 22<br />
Figure II-16: Total <strong>Energy</strong> by Percentage (Municipal Waste Streams) ............................................... 22<br />
Figure III-1: Total Theoretical <strong>Energy</strong> Potential......................................................................................... 30<br />
Figure III-2: Price comparison: aspen and birch pulpwood on the stump and<br />
coal delivered to MN in 2004..................................................................................................................... 33<br />
Figure III-3: Economic Potential and Minnesota <strong>Energy</strong> Consumption............................................... 34<br />
Figure III-4: Economic <strong>Energy</strong> Potential (Hays, Straws, and Stalks) ..................................................... 35<br />
Figure III-5: Economic <strong>Energy</strong> Potential by Percentage (Hays, Straws and Stalks) ........................... 35<br />
Figure III-6: Economic <strong>Energy</strong> Potential (Wood) ..................................................................................... 35<br />
Figure III-7: Economic <strong>Energy</strong> Potential by Percentage (Wood) ......................................................... 35<br />
Figure III-8: Economic <strong>Energy</strong> Potential (Wet Manures)........................................................................ 35<br />
Figure III-9: Economic <strong>Energy</strong> Potential by Percentage (Wet Manures)............................................. 35<br />
Figure III-10: Economic <strong>Energy</strong> Potential (Dry Manures)....................................................................... 36<br />
Figure III-11: Economic <strong>Energy</strong> Potential by Percentage (Dry Manures)............................................ 36<br />
Figure III-12: Theoretical, Technical, and Economically Available <strong>Energy</strong> ......................................... 37<br />
Figure III-13: Theoretical, Technical, and Economic Potential of Crop Residues, Wood, and<br />
Manures ........................................................................................................................................................ 38<br />
Figure III-14: Comparisons of Typical Delivered Fuel Costs.................................................................... 39<br />
Figure IV-1: Tub Grinder .............................................................................................................................. 42<br />
Figure IV-2: Tree Chipper ............................................................................................................................ 45<br />
Figure IV-3: Baling Corn Stover .................................................................................................................. 46<br />
Figure IV-4: Storing Switchgrass Bales ...................................................................................................... 47<br />
Figure IV-5: Wood chips stored at the McNeil Generating Station in Burlington, VT ....................... 48<br />
Figure IV-6: Removing Twine from Bales.................................................................................................. 50<br />
Figure IV-7: Infrastructure Maps................................................................................................................ 52<br />
Figure V-1: Bio-Power Tree Diagram ......................................................................................................... 54<br />
Figure V-2: Steam-Turbine (Direct Combustion) System........................................................................ 54<br />
Figure V-3: Fluidized Bed Boiler System..................................................................................................... 56<br />
Figure V-4: Simple-Cycle Gas Turbine ...................................................................................................... 60<br />
Figure V-5: Combined-Cycle Gas Turbine System ................................................................................. 61<br />
Figure VI-1: Map of Minnesota's Ethanol and Bio-Diesel Plants............................................................ 81<br />
Figure VI-2: Laurentian <strong>Energy</strong> Authority Construction .......................................................................... 85<br />
Figure VI-3: The Fibrominn Plant................................................................................................................ 88<br />
Figure VI-4: The Anaerobic Plug-Flow Digester ....................................................................................... 89
Figure VII-1: A Timeline of Minnesota's <strong>Biomass</strong> Mandate..................................................................... 97<br />
Figure VII-2: Minnesota New Market Tax Credit Map .......................................................................... 112<br />
Figure VIII-1: Start-Up Screen.................................................................................................................... 122<br />
Figure VIII-2: Feedstock Delivery Path..................................................................................................... 123<br />
Figure VIII-3: Evaluation Methodology ................................................................................................... 125<br />
Figure VIII-4: Example LAC Runs .............................................................................................................. 127<br />
Figure VIII-5: BioPET Sensitivity Analysis Example ................................................................................... 127<br />
Figure VIII-6: Monte Carlo Results (LAC)................................................................................................. 135<br />
Figure VIII-7: Feedstock Price Variability................................................................................................. 135<br />
Figure IX-1: Power Plant Capital Costs ($/kW)....................................................................................... 143<br />
Figure X-1: Comparison of Anaerobic Digesters...................................................................................160<br />
Figure A-1: Main Screen............................................................................................................................ A-1<br />
Figure A-2: Evaluation Methodology...................................................................................................... A-2<br />
Figure A-3: Main Feedstock Screen ........................................................................................................ A-3<br />
Figure A-4: Feedstock Delivery Path....................................................................................................... A-6<br />
Figure A-5: Feedstock to Processing Yard Screen................................................................................ A-7<br />
Figure A-6: Feedstock to Storage Facility Screen................................................................................. A-8<br />
Figure A-7: Feedstock to Power Plant Screen ....................................................................................... A-9<br />
Figure A-8: Power Plant Screen ............................................................................................................. A-10<br />
Figure A-9: Power Plant Expenses Screen ............................................................................................ A-12<br />
Figure A-10: Financial Assumption Screen........................................................................................... A-14<br />
Figure A-11: <strong>Project</strong> Summary Screen .................................................................................................. A-16<br />
Figure A-12: Sensitivity Analysis Graph.................................................................................................. A-17<br />
Figure A-13: Example of <strong>Project</strong> Log Scenario Graph ....................................................................... A-18<br />
Figure A-14: Directory Screen ................................................................................................................ A-18
List of Tables<br />
Table II-1: Crop Assumptions...................................................................................................................... 25<br />
Table II-2: Crop Residue Assumptions....................................................................................................... 25<br />
Table IV-1: Silica in <strong>Biomass</strong> Ash................................................................................................................ 44<br />
Table V-1: Emission Rates (lbs/MWh) for Various <strong>Energy</strong> Technologies............................................... 59<br />
Table V-2: Bio-Power Conversion Technology Specifications .............................................................. 65<br />
Table V-3: Bio-Power Conversion Technology Benefits and Limitations ............................................. 66<br />
Table V-4: Bio-Power Generation Research Areas................................................................................. 67<br />
Table VI-1: Fuel Size Requirements by Combustion Type ...................................................................... 70<br />
Table VI-2: United States Renewable <strong>Energy</strong> Generating Capacity ................................................. 72<br />
Table VI-3: MW of Generating Capacity from U.S. <strong>Biomass</strong> Resources .............................................. 72<br />
Table VI-4: Minnesota's Five Papermills Burning Wood Residues to Generate Power ..................... 77<br />
Table VI-5: Boilers in Forest Products Plants or Municipal CHP Plants in Minnesota........................... 80<br />
Table VI-6: Ethanol Plants & Capacities................................................................................................... 81<br />
Table VIII-1: Power Plant Characteristics................................................................................................ 130<br />
Table VIII-2: Power Plant Income (Other) and Expenses..................................................................... 130<br />
Table VIII-3: Power Plant Income and Taxes for All Scenarios ............................................................ 130<br />
Table VIII-4: Power Plant Financial Assumptions for All Scenarios ...................................................... 131<br />
Table VIII-5: Feedstock Characteristics and Costs ...............................................................................132<br />
Table VIII-6: Feedstock Costs ................................................................................................................... 132<br />
Table VIII-7: Scenario Definitions.............................................................................................................. 133<br />
Table VIII-8: Variable Ranges for Feedstock Scenarios........................................................................ 134<br />
Table VIII-9: Variable Ranges for Power Plant Scenarios..................................................................... 134<br />
Table X-1: <strong>Biomass</strong> Consumption at Existing Utility Coal Plants Under a 5% Co-Fire Assumption. 156<br />
Table X-2: Potential Generating Capability of Minnesota's Ethanol Plants...................................... 158<br />
Table X-4: Bio-Power Opportunities in Minnesota.................................................................................161<br />
Table B-1: Alphabetized List ......................................................................................................................B-2<br />
Table B-2: Categorized List........................................................................................................................B-9
CHAPTER I : INTRODUCTION<br />
Bio-power – electricity and heat generated from biomass fuels -- has played a long but minor<br />
role in U.S. electric generation. But its profile is rising. Concerns about the effects of imported<br />
fossil fuels on the country’s environment and energy security have brought new attention to<br />
biomass power. Increasingly, bio-power is being discussed as a potential contributor to<br />
America’s energy independence.<br />
It will take a substantial increase in bio-power development to realize that potential. In 2003, U.S.<br />
bio-power provided 6,370 MW of net summer capacity and over 41 million MWh. In Minnesota,<br />
bio-power accounted for 275 MW and 760,570 MWh (EIA, 2005). As Figure I-1 shows, over the<br />
past decade those outputs haven’t changed much. In its most recent Annual <strong>Energy</strong> Outlook,<br />
however, the <strong>Energy</strong> Information Administration (EIA) projects that energy from biomass will grow<br />
to more than 61 million MWh by 2010, 72 million MWh by 2020, and 81 million MWh by 2025. EIA<br />
further projects that nearly 5,400 MW of new bio-power capacity will come on line by 2025.<br />
MWs<br />
11,000<br />
10,500<br />
10,000<br />
9,500<br />
9,000<br />
8,500<br />
8,000<br />
7,500<br />
70,000,000<br />
65,000,000<br />
60,000,000<br />
55,000,000<br />
50,000,000<br />
45,000,000<br />
40,000,000<br />
35,000,000<br />
MWhs<br />
7,000<br />
1989 1994 1999 2004<br />
Year<br />
Capacity (MWs)<br />
Generation (MWhs)<br />
30,000,000<br />
(compiled from EIA, 2001, 2002, 2005b) 1<br />
Figure I-1: Total Annual U.S. Electricity Generated from <strong>Biomass</strong><br />
Given the recent surge in interest in bio-power potential, this project was conceived. The goal is<br />
to summarize the current state of the bio-power industry, act as a resource when evaluating<br />
diverse bio-power projects, and make recommendations for future research areas and policy<br />
changes that would result in higher implementation of bio-power projects.<br />
1 2004 data is preliminary.<br />
Identifying Effective <strong>Biomass</strong> Strategies: Page 1<br />
Quantifying Minnesota’s Resources and Evaluating Future Opportunities
THE PROJECT: IDENTIFYING EFFECTIVE BIOMASS STRATEGIES<br />
<strong>Project</strong> History<br />
The history of Minnesota biopower development is succinctly summarized in <strong>Xcel</strong> <strong>Energy</strong>’s 2007<br />
Renewable Development Fund Request for Proposals. The following is excerpted from this<br />
document with minor modifications and some updates.<br />
<strong>Xcel</strong> <strong>Energy</strong> operates the Prairie Island Nuclear Generating Plant at Red Wing,<br />
Minnesota, which uses “dry casks” to store spent fuel from the plant. In 1994, the<br />
Minnesota legislature enacted legislation that established a “renewable development<br />
fund.” This legislation required <strong>Xcel</strong> <strong>Energy</strong> to transfer to a renewable development<br />
account $500,000 annually for each dry cask containing spent fuel that is located at<br />
Prairie Island after January 1, 1999.<br />
In June 2003, the legislature passed new legislation that made changes to several<br />
provisions of the original legislation establishing the RDF program. Among other things,<br />
the new legislation increased the level of funding and distributions from the Fund.<br />
Specifically, the legislation provides for <strong>Xcel</strong> <strong>Energy</strong> to transfer to the Fund $16,000,000<br />
annually each year Prairie Island is in operation. From this amount, up to $6,000,000 must<br />
be allocated to fund renewable energy production incentives for eligible wind and onfarm<br />
biogas facilities. Such production incentive payments are administered by the<br />
Minnesota Department of Commerce, which determines eligibility under Minnesota<br />
Statutes 2001, §216C.41.<br />
The initial RDF funding cycle began with the release of the first RFP in mid-2001, which<br />
resulted in the selection of 19 projects receiving over $15.5 million in funding. These<br />
projects included new energy production projects, as well as research and development<br />
into solar, wind, hydro and biomass technologies. The second funding cycle resulted in<br />
28 projects being selected with a total award amount of $26.5 million. Some of these<br />
projects entered into power purchase agreements to sell energy and/or capacity to <strong>Xcel</strong><br />
<strong>Energy</strong>, while other projects consumed the electricity produced on-site. Descriptions of<br />
projects selected through the second funding cycle can be found at<br />
http://www.xcelenergy.com/rdf, click on “Renewable Development Fund” and “<strong>Project</strong><br />
Selections” for Cycle 1 and Cycle 2 along the left side of the screen.<br />
The RDF Board is responsible for administrating the Fund, including implementing the<br />
funding process, evaluating and selecting requests, and disbursing funds to successful<br />
applicants. All decisions of the Board are made by consensus and the Board relies on<br />
<strong>Xcel</strong> <strong>Energy</strong> RDF staff and technical consulting assistance as necessary to administrate<br />
the program. At this time, the Board consists of two representatives from <strong>Xcel</strong> <strong>Energy</strong>,<br />
Betsy Engelking and Brian Zelenak; two representatives from the environmental<br />
community, William Grant and Jack Keers; a representative from the Prairie Island Indian<br />
Community, Heather Westra; an <strong>Xcel</strong> <strong>Energy</strong> commercial ratepayer representative from<br />
the Minnesota Chamber of Commerce, Mike Franklin; and an <strong>Xcel</strong> <strong>Energy</strong> residential<br />
ratepayer representative from the Minnesota Department of Commerce, Assistant<br />
Deputy Commissioner Mike Bull.<br />
The overall purpose (mission) of the RDF is to increase the market penetration of<br />
renewable energy resources at reasonable costs in the <strong>Xcel</strong> <strong>Energy</strong> service territory,<br />
promote the start-up, expansion, and attraction of renewable energy projects and<br />
companies in the <strong>Xcel</strong> <strong>Energy</strong> service territory and stimulate research and development<br />
Page 2<br />
Identifying Effective <strong>Biomass</strong> Strategies:<br />
Quantifying Minnesota’s Resources and Evaluating Future Opportunities
into renewable technologies that support this mission. Results of RDF projects are<br />
expected to become available to broad audiences.<br />
The Board considers the primary objective of research projects to be testing a hypothesis<br />
or the marketability and application of an energy-related technology, with energy<br />
production being a by-product of the research.<br />
The project before you was conceived in 2003, submitted for the second round of RDF funding<br />
on March 16, 2004, and ultimately began on August 1, 2005. This report and the associated tools<br />
developed as part of the overall program effort is the culmination of over two years of work by<br />
the project team.<br />
Mission<br />
Minnesota has enacted a number of policies over the past decades that indicate a strong<br />
interest in expanding the biomass power industry within the state. The 1994 <strong>Biomass</strong> Mandate,<br />
the Renewable <strong>Energy</strong> Objective, and the recent Renewable <strong>Energy</strong> Standard have all<br />
provided support for bio-power within Minnesota. While general studies have indicated that<br />
Minnesota has significant potential to utilize existing biomass for electrical generation, no<br />
comprehensive statewide evaluation of Minnesota’s biomass resources in relation to existing<br />
infrastructure and appropriate processing technologies has been completed. <strong>Biomass</strong> is<br />
increasingly more complex than traditional electric generation approaches. It encompasses a<br />
wide range of feedstocks (crops to residues to animal manures and even, by some definitions,<br />
municipal solid waste and landfill gas) and a wide range of technologies (standard combustion<br />
boilers to anaerobic digesters to gasification processes). This makes a side-by-side comparison<br />
of diverse projects even more difficult.<br />
The concern becomes that without such a common framework from which to identify and<br />
compare diverse projects, projects may be selected for political expediency rather than<br />
technical and/or economic feasibility. The lack of a commonly accepted standard for decision<br />
making, combined with current regulatory and perceptual barriers in the biomass arena,<br />
complicates the selection process even further. The idea was therefore to provide tools and<br />
information to assist in the comparison of diverse biomass projects and allow for an objective<br />
evaluation. The result of this effort is before you.<br />
This project fulfills the objective delineated in the R&D portion of the RDF for assisting new<br />
technologies to the point where they can begin the process of commercial introduction by<br />
providing objective information to minimize transaction costs in the evaluation, selection, and<br />
ultimate implementation of biomass projects.<br />
Goals<br />
The goal of this project is to create a framework that communities and legislators can use to<br />
determine the feasibility of biomass generated electricity in their region and to develop costeffective<br />
projects that use local biomass resources efficiently. Although biomass can offer<br />
multiple benefits as a fuel source, biomass resources are extremely diverse in their physical<br />
characteristics and their potential for energy generation. It is imperative that projects are<br />
designed with this diversity in mind and within the parameters established by local or regional<br />
contexts. This project developed a number of resources to aid in the identification of areas in<br />
the state where relationships between fuel sources, local conditions, and appropriate<br />
technologies produce a promising opportunity for a biomass project. With this information,<br />
funding organizations, policy makers and state regulators will be better able to select the most<br />
Identifying Effective <strong>Biomass</strong> Strategies: Page 3<br />
Quantifying Minnesota’s Resources and Evaluating Future Opportunities
cost-effective projects for implementation. The project does not advocate for or against<br />
specific bio-power projects. It helps to ensure that the state’s limited resources are allocated to<br />
the best bio-power opportunities.<br />
To achieve this goal, the project identified biomass opportunities throughout the state with a<br />
specific emphasis on local conditions that could impact the cost-effectiveness of a proposed<br />
project. The results of this survey are graphically presented with an internet based mapping tool<br />
so that the best opportunities for electrical generation can be more easily distinguished. In<br />
addition, an evaluation tool was developed to assess proposed biomass projects. This tool<br />
generates a cost approximation per kW and kWh so that various projects can be compared<br />
using a common denominator.<br />
THE APPROACH: QUANTIFYING MINNESOTA’S RESOURCES<br />
AND EVALUATING FUTURE OPPORTUNITIES<br />
This project consists of a final report and two software tools. The basis for each of these is a<br />
comprehensive inventory of all biomass potential in Minnesota. All existing major biomass and<br />
bio-waste feedstocks were cataloged during the inventory, including major facilities that<br />
produce biomass or bio-waste. Existing energy infrastructure, including electric generation and<br />
transmission facilities, were mapped with a GIS system and overlaid with biomass sources and<br />
major biomass facilities. In addition to the inventory and infrastructure data, process<br />
technologies appropriate to each feedstock were identified and assessed using published data<br />
from actual projects whenever possible. The viability of each major feedstock and technology<br />
was assessed primarily by the reliability of the technology and its cost. <strong>Biomass</strong> project<br />
opportunities were then identified and prioritized based on feedstock availability and the scale<br />
and reliability of available technologies. All tools and reports from the project are available on<br />
CEE’s website.<br />
<strong>Final</strong> <strong>Report</strong><br />
This report is designed to be a comprehensive biomass power resource. It contains both general<br />
information regarding the biomass power industry and significant details regarding the industry in<br />
Minnesota. The general sections include information on the nature of various bio-power<br />
feedstocks, the technologies that are available to process them and convert them to useful<br />
energy, and the different applications in which biomass power can be utilized. The challenges<br />
to implementing biomass projects and strategies to overcome these challenges were also<br />
identified. The Minnesota specific sections focus on the major biomass power facilities in<br />
Minnesota, a brief history of the industry and the policies that have shaped it, and suggestions<br />
for further policy initiatives that could move the industry forward.<br />
Page 4<br />
Identifying Effective <strong>Biomass</strong> Strategies:<br />
Quantifying Minnesota’s Resources and Evaluating Future Opportunities
BioPET<br />
Figure I-2: BioPET Main Screen<br />
BioPET is a spreadsheet tool designed to assist in comparing diverse bio-power projects by<br />
calculating a common economic metric (a levelized annual cost in ¢/kWh) for all projects.<br />
BioPET is designed merely as a screening tool and should not be a replacement for an in-depth<br />
engineering and econometric analysis. It is meant to be used as a means for narrowing one’s<br />
focus from perhaps dozen of ideas to just a handful.<br />
gopher<br />
Figure I-3: gopher Screen Shot<br />
Identifying Effective <strong>Biomass</strong> Strategies: Page 5<br />
Quantifying Minnesota’s Resources and Evaluating Future Opportunities
The birth of gopher came through the acknowledgement that, given the wide variety biomass<br />
feedstocks, generation technologies, and infrastructure requirements, the project team would<br />
not be able to accurately predict or provide maps for all of the possible combination of<br />
resources to assist in specific project development. It was clear that simply providing a series of<br />
fixed maps would be too limiting and ultimately not very helpful. A flexible tool that would allow<br />
anyone to create their own map focusing only on the resources in which they are interested was<br />
deemed to provide the maximum amount of value to project developers. As with BioPET, gopher is<br />
designed as a screening tool and its accuracy is only as good as the resolution of the data<br />
collected at some time in the past. Before embarking on a specific project, “on the ground”<br />
analysis should be conducted to verify accuracy and adjust for recent developments.<br />
Page 6<br />
Identifying Effective <strong>Biomass</strong> Strategies:<br />
Quantifying Minnesota’s Resources and Evaluating Future Opportunities
CHAPTER II : BIOMASS FUELS<br />
BIOMASS CATEGORIZATIONS<br />
Our discussion of biomass power begins logically with the biomass resource itself. <strong>Biomass</strong> is not<br />
an exact term. It could be used to designate pretty much any carbon-based life form, be it<br />
flora or fauna. It also has vastly different referents in various parts of the world, depending on<br />
the local species. So we arbitrarily – however, we hope reasonably – define it as crops and<br />
residues available in Minnesota in quantities large enough to fuel a power plant. Those are the<br />
specific biomasses that appear in the BioPET computer tool and in this chapter of the Written<br />
<strong>Report</strong>.<br />
BIOMASS FEEDSTOCKS<br />
Agriculture<br />
Livestock<br />
Crops<br />
Crop<br />
Residues<br />
Ag. Processing<br />
Residues<br />
Manures<br />
Animal Processing<br />
Wastes<br />
Wood<br />
which includes:<br />
Municipal Waste<br />
Streams<br />
Timber<br />
Residues<br />
Urban Wood<br />
Wastes<br />
Figure II-1: <strong>Biomass</strong> Feedstocks Organizational Chart<br />
We group those specific biomasses into seven general categories.<br />
First, three categories from the agriculture industry:<br />
• harvested crops,<br />
• crop residues, and<br />
• agricultural processing residues.<br />
Second, one catchall category for wood-based resources:<br />
• wood.<br />
Third, two categories from the livestock industry:<br />
• manures and<br />
• animal processing wastes.<br />
And fourth, three categories to address municipal waste streams:<br />
• waste water treatment plant sludge,<br />
• municipal solid waste, and<br />
• landfill gas.<br />
Identifying Effective <strong>Biomass</strong> Strategies: Page 7<br />
Quantifying Minnesota’s Resources and Evaluating Future Opportunities
In addition, we include in BioPET a special category:<br />
• fossil fuels.<br />
These obviously are not biomass, but we include them for purposes of comparison and for<br />
calculating co-firing applications. Because Minnesota does not have any native fossil fuel<br />
resources, inventories are not included; however general fuel characteristics and prices are.<br />
The other special category which is not included in BioPET but does come up for discussion in the<br />
paper is:<br />
• dedicated energy crops.<br />
Dedicated energy crops are not included in the BioPET tool as a separate category because<br />
thus far they are grown in test plots, not in fields as a commercial crop. But in this written report<br />
we describe research in herbaceous crops, switchgrass, and diverse prairie grasses because<br />
they are more likely to become important biomass energy crops in the near future.<br />
BioPET Assumptions and User-Defined Fields (UDFs)<br />
The BioPET computer tool allows the user to explore volumes of specific biomasses in any county<br />
or combination of counties in the state. We used the same moisture and quality assumptions<br />
consistently across all 87 counties in Minnesota. The user can look up those assumptions in<br />
BioPET.<br />
Although we made every effort to develop a comprehensive list of Minnesota biomass<br />
feedstocks available in quantity, the user may want to research an additional source or a very<br />
specific variation on one of the items listed above. For that reason BioPET is designed to also<br />
accept user inputs. Users can enter and save their own feedstock characteristics in any of the<br />
12 UDFs provided in BioPET.<br />
Assessment<br />
The general categories above define the areas in which we find biomass fuels. Within those<br />
categories lie a wide variety of specific feedstocks which we examine in terms of:<br />
• energy content (millions of BTUs (MMBTUs) per dry ton),<br />
• volumes of biomass by county in Minnesota (dry tons),<br />
• estimated processing costs ($/ton), and<br />
• estimated delivery costs ($/ton/mile).<br />
BioPET presents analyses of these factors in an easy-to- use electronic format. The user of this<br />
computer tool can manipulate various feedstock, delivery and location scenarios in order to<br />
arrive at the optimal cost per MMBTU for fully processed fuel delivered to a power plant at a<br />
particular location in Minnesota.<br />
ESTIMATION OF FEEDSTOCK CHARACTERISTICS<br />
Since statistical information on biomass fuels comes from a variety of sources that use differing<br />
methodologies, we have had to normalize them so their performance in various combustion and<br />
gasification processes can be compared. It should be noted that this still represents an<br />
‘nominal’ value. Values can vary widely across regions and states. It is recommended that<br />
Page 8<br />
Identifying Effective <strong>Biomass</strong> Strategies:<br />
Quantifying Minnesota’s Resources and Evaluating Future Opportunities
when evaluating individual projects that the actual fuel to be consumed be tested and<br />
evaluated.<br />
For this analysis, we begin by estimating the energy content of each potential feedstock in<br />
Minnesota on the basis of its dry-weight -- i.e., 0% moisture content by weight (MCW). That gives<br />
us a basis for calculating backward to any moisture content we find in the field.<br />
We give the higher heating values (HHV) for each of the potential biomass feedstocks on a dryweight<br />
basis, both in terms of BTU/lb and MJ/kg. In some cases, we obtain those directly from<br />
the sources noted. For others, we calculate them by using standard conversion formulas. But<br />
HHV is only a theoretical number. Actual recovered heat depends upon the technology used<br />
to convert the biomass into electricity. Lower heating values (LHVs) are available for some of<br />
the fuels listed, but we do not refer to them because that measure is not relevant to planning for<br />
electricity generation.<br />
<strong>Energy</strong> content is measured through proximate analyses (moisture, free carbon, ash, etc.) and<br />
ultimate analyses (percent elemental carbon, hydrogen, etc.). From ultimate analyses, HHV can<br />
be calculated with any of several regression models. But we only occasionally use such<br />
equations for our estimates because HHV in nearly all cases can be obtained through proximate<br />
analyses.<br />
The BioPET tool contains our “official” estimates for purposes of a general comparative review.<br />
While we provide a single HHV number for each individual feedstock, biomass energy content—<br />
even on a dry-weight basis—actually varies widely. It depends upon the species/variety of crop,<br />
the animals’ feed rations and bedding arrangements (in the case of manures), the part of the<br />
plant being processed, the soils on which the crop is grown, the time of year it is harvested, and<br />
the type of processing that precedes the laboratory analysis.<br />
Our best estimates sometimes are averages of several samples and sometimes a selection from<br />
competing data sources. In associating these numbers with county-level biomass estimates, we<br />
round the heating values to the nearest 100 BTU/lb in order to avoid the suggestion of greater<br />
accuracy than is possible.<br />
We find many inconsistencies in reported data, principally in the way they deal with moisture<br />
content. In some cases, such as wood heating values, we discover that some standard sources<br />
actually use a single HHV for all wood types and merely adjust individual species numbers by<br />
assuming varying moisture contents. In other cases, different laboratory procedures have led to<br />
different energy content estimates. And in some others, what at first appears to be<br />
independent laboratory analyses turns out to be a reissuing of other researchers’ findings.<br />
Gaur and Reed (1998) is the best single compilation of energy content we have found because<br />
it uses consistent reporting practices over the widest range of fuels. But it doesn’t contain all the<br />
feedstocks included here, especially manures. AURI is the only set of analyses of Minnesotagrown<br />
biomass we know of.<br />
Alkali content estimates were scattered and sparse. The only broad-scope source found was<br />
Miles, Miles, Baxter, Bryers, Jenkins, and Oden (1995). The key message from that study is nicely<br />
captured in the chart below showing the range of potential alkali problems in some--but by no<br />
means all--of the feedstocks dealt with here.<br />
Identifying Effective <strong>Biomass</strong> Strategies: Page 9<br />
Quantifying Minnesota’s Resources and Evaluating Future Opportunities
(Miles et. al., 1995)<br />
Figure II-2: Example Alkali, Sulfur, and Chlorine Concentrations of Selected Wood Fuels<br />
Agricultural Crops<br />
Specific goods raised on the land for on site use or for sale to markets such as food, feed, or biofuels.<br />
Specific crops listed in BioPET include:<br />
Alfalfa, Barley, Canola, Corn Grain, Corn Sileage, Dry Beans, Oats, Potatoes, Soybeans,<br />
Sugar Beets, Sunflower Seeds, Sweet Corn, and Wheat<br />
Of all Minnesota’s biomass categories, agriculture is the largest. And crops are the largest<br />
component of that largest category, containing approximately 846,000 billion BTU of energy,<br />
more than any other single biomass resource. Of that total crop energy, corn grain contributes<br />
the lion’s share (51%). Soybeans and sugar beets take second and third place at 17% and 14%<br />
respectively. Other contributors are alfalfa hay (7%), wheat (4%), and corn silage (4%).<br />
Page 10<br />
Identifying Effective <strong>Biomass</strong> Strategies:<br />
Quantifying Minnesota’s Resources and Evaluating Future Opportunities
450,000<br />
Corn Grain<br />
Corn Grain<br />
51%<br />
400,000<br />
350,000<br />
Billion Btu<br />
300,000<br />
250,000<br />
200,000<br />
150,000<br />
100,000<br />
50,000<br />
0<br />
Alfalfa<br />
Hay<br />
Barley<br />
Grain<br />
Canola<br />
Grain<br />
Corn<br />
Sileage<br />
Oat Grain<br />
Potato<br />
Dry Beans<br />
Soybean<br />
Grain Sugar<br />
Beets<br />
Wheat<br />
Grain<br />
Sweet Corn<br />
Sunflower<br />
Grain<br />
Seeds<br />
Canola Grain<br />
0%<br />
Barley Grain<br />
0%<br />
Alfalfa Hay<br />
7%<br />
Wheat Grain<br />
4%<br />
Sweet Corn Grain<br />
2%<br />
Sugar Beets<br />
14%<br />
Sunflower Seeds<br />
0%<br />
Corn Sileage<br />
4%<br />
Dry Beans<br />
0%<br />
Oat Grain<br />
0%<br />
Potato<br />
1%<br />
Soybean Grain<br />
17%<br />
Figure II-3: Total <strong>Energy</strong> (Crops)<br />
Figure II-4: Total <strong>Energy</strong> by Percentage (Crops)<br />
Identifying Effective <strong>Biomass</strong> Strategies: Page 11<br />
Quantifying Minnesota’s Resources and Evaluating Future Opportunities
Crop Residues<br />
Wastes from the field, like leaves, stems, and stalks, etc. Specific crop residues listed in BioPET<br />
include:<br />
Barley Straw, Oat Straw, Wheat Straw, Corn Stover, Sunflower Stalks, Sweet Corn Stalks,<br />
and Other Hays/Switchgrass<br />
Hays, straws and stalks constitute Minnesota’s second-largest segment of agricultural biomass.<br />
Totaling approximately 434,000 billion BTU, residues represent slightly more than half of the<br />
energy value of crops, but they may offer more potential for bio-power development because,<br />
unlike crops which are sought-after commodities, residues are mostly unused (although<br />
researchers are studying how much has to be plowed under to maintain the health of soils). The<br />
single largest of these wastes is corn stover, 80% of the total. Other significant contributors are<br />
wheat straw (7%), hays and straws on CRP land (7%), and other hays/switchgrass (3%).<br />
Page 12<br />
Identifying Effective <strong>Biomass</strong> Strategies:<br />
Quantifying Minnesota’s Resources and Evaluating Future Opportunities
For purposes of this analysis, all hays, straws, and stalks were combined regardless of source (ie.<br />
crop or crop residue) due to their similarity in their handling and processing for energy<br />
generation.<br />
400,000<br />
Billion Btu<br />
350,000<br />
300,000<br />
250,000<br />
200,000<br />
150,000<br />
100,000<br />
Corn Stalks<br />
Corn Stalks<br />
80%<br />
Sunflower Stalks<br />
0%<br />
Sweet Corn Stalks<br />
1%<br />
CRP Hay/Straw<br />
7%<br />
Barley Straw<br />
1%<br />
Oat Straw<br />
1%<br />
Other Hay/Switchgrass<br />
3%<br />
Wheat Straw<br />
7%<br />
50,000<br />
0<br />
Barley<br />
Straw<br />
Oat Straw<br />
Other Hay/<br />
Switchgrass<br />
Wheat<br />
Straw<br />
Sunflower<br />
Stalks<br />
Sweet Corn<br />
Stalks<br />
CRP Hay/<br />
Straw<br />
Figure II-5: Total <strong>Energy</strong> (Crop Residues)<br />
Figure II-6: Total <strong>Energy</strong> by Percentage<br />
(Crop Residues)<br />
Identifying Effective <strong>Biomass</strong> Strategies: Page 13<br />
Quantifying Minnesota’s Resources and Evaluating Future Opportunities
Agricultural Processing Residues<br />
Waste streams, like leaves, stems, stalks, roots, shells, pits, etc., found typically at processing<br />
plants. Specific agricultural processing residues listed in BioPET are:<br />
Feedstocks include:<br />
Ethanol DDGs, Ethanol Feed, Ethanol Oil, Glycerol, Soybean Hulls, Soybean Meal,<br />
Soybean Oil, Sugar Beet Molasses, Sugar Beet Pulp, Sugar Beet Tailings, Wheat Flour, and<br />
Wheat Midds<br />
Residues from agricultural processing are the fourth largest biomass category. Annual residues<br />
from crop processing contain approximately 165,000 billion BTU. Soybean meal is the largest of<br />
these (38%), followed by ethanol DDGs (21%), and soybean oil (17%). Other contributors are<br />
wheat flour (13%) sugar beet pulp (4%), soybean hulls (3%), and wheat midds (3%).<br />
Page 14<br />
Identifying Effective <strong>Biomass</strong> Strategies:<br />
Quantifying Minnesota’s Resources and Evaluating Future Opportunities
Billion Btu<br />
70,000<br />
60,000<br />
50,000<br />
40,000<br />
30,000<br />
20,000<br />
Ethanol<br />
DDGS<br />
Soybean Meal<br />
Soybean<br />
Oil<br />
Wheat Flour<br />
Sugar Beet Tailings<br />
0%<br />
Sugar Beet Pulp<br />
4%<br />
Sugar Beet Molasses<br />
1%<br />
Soybean Oil<br />
17%<br />
Wheat Flour<br />
13%<br />
Wheat Midds<br />
3%<br />
Ethanol DDGS<br />
21%<br />
Ethanol Feed<br />
0%<br />
Ethanol Oil<br />
0%<br />
Glycerol<br />
0%<br />
Soybean Hulls<br />
3%<br />
10,000<br />
0<br />
Ethanol<br />
Feed<br />
Ethanol<br />
Oil<br />
Glycerol<br />
Soybean<br />
Hulls<br />
Sugar Beet<br />
Molasses<br />
Sugar<br />
Beet Pulp<br />
Sugar Beet<br />
Tailings<br />
Wheat<br />
Midds<br />
Soybean Meal<br />
38%<br />
Figure II-7: Total <strong>Energy</strong><br />
(Agricultural Processing Residues)<br />
Figure II-8: Total <strong>Energy</strong> by Percentage<br />
(Agricultural Processing Residues)<br />
Identifying Effective <strong>Biomass</strong> Strategies: Page 15<br />
Quantifying Minnesota’s Resources and Evaluating Future Opportunities
Wood<br />
The wood category includes timber, harvest, and mill residues. Specific wood feedstocks in<br />
BioPET include:<br />
Logging Residues, Aspen Timber, Hardwood Timber, Softwood Timber, Brushland, Trees<br />
(from CRP Lands), Urban Wood Waste, Mill Residues (Bark, Slabs, and Edgings), and Mill<br />
Residues (Sawdust/Shavings)<br />
Forest residue: Logging wastes and other removable material left after carrying out timber<br />
harvest operations. This includes unmerchantable trees cut during logging operations, thinnings,<br />
“lilly pads” (sections trimmed from logs) and limbs. Logging residues comprises of unutilized trees<br />
cut or killed during logging operations or any of the unused portions that are left in the woods.<br />
Mill residue: Waste generated in the manufacturing of forest products. Mill waste typically<br />
consists of chips, off-fall, trimmings, slabs, shavings, sawdust, bark, veneer clippings, cores, and<br />
pulp screenings. Our definition includes all mill residues whether recycled as byproducts or<br />
disposed of as waste.<br />
Urban wood waste: Material generated by major construction activity, land clearing and tree<br />
trimming in urban areas.<br />
Minnesota’s third-largest category is woody biomass, whose annual growth of 423,000 billion BTUs<br />
is nearly as much as hays, straws and stalks. Softwood timber growth accounts for<br />
approximately 65% of the total available energy from woody biomass, aspen and other<br />
hardwood species contribute 25%, and logging residues, urban wood waste, and brushland add<br />
small percentages of 4%, 3%, and 3% respectively.<br />
Page 16<br />
Identifying Effective <strong>Biomass</strong> Strategies:<br />
Quantifying Minnesota’s Resources and Evaluating Future Opportunities
Billion Btu<br />
300,000<br />
250,000<br />
200,000<br />
150,000<br />
Softwood Timber<br />
Softwood Timber<br />
63%<br />
Brushland<br />
3%<br />
CRP Trees<br />
0%<br />
Urban Wood Waste<br />
3%<br />
Primary Mill Residues<br />
2%<br />
Logging Residues<br />
4%<br />
100,000<br />
50,000<br />
0<br />
Logging<br />
Residues<br />
Aspen Timber<br />
Hardwood Timber<br />
(except Aspen)<br />
Brushland<br />
CRP Trees<br />
Urban Wood<br />
Waste<br />
Primary<br />
Mill<br />
Residues<br />
Hardwood Timber<br />
(except Aspen)<br />
6%<br />
Aspen Timber<br />
19%<br />
Figure II-9: Total <strong>Energy</strong> (Wood)<br />
Figure II-10: Total <strong>Energy</strong> by Percentage (Wood)<br />
Identifying Effective <strong>Biomass</strong> Strategies: Page 17<br />
Quantifying Minnesota’s Resources and Evaluating Future Opportunities
Manures<br />
Wastes generated by livestock. The specific manures listed in BioPET are from:<br />
Feedstocks include manures from:<br />
Beef, Dairy, Hogs, Sheep, Broilers, Layers, and Turkeys<br />
Manure is the fifth-largest category of biomass in Minnesota. Minnesota livestock annually<br />
produce manure containing approximately 72,000 billion BTUs. Dairy and beef manure<br />
contribute the most with approximately 37% and 31% respectively. Hog manure is next with 19%,<br />
and other sources are turkey manure (8%) and sheep manure (3%).<br />
Page 18<br />
Identifying Effective <strong>Biomass</strong> Strategies:<br />
Quantifying Minnesota’s Resources and Evaluating Future Opportunities
30,000<br />
Dairy<br />
Manure<br />
Hog Manure<br />
19%<br />
Billion Btu<br />
25,000<br />
20,000<br />
15,000<br />
Beef<br />
Manure<br />
Hog<br />
Manure<br />
Dairy Manure<br />
37%<br />
Sheep Manure<br />
3%<br />
Broiler Manure<br />
1%<br />
Layer Manure<br />
1%<br />
10,000<br />
Turkey<br />
Manure<br />
Turkey Manure<br />
8%<br />
5,000<br />
Sheep<br />
Manure<br />
Broiler<br />
Manure<br />
Layer<br />
Manure<br />
0<br />
Beef Manure<br />
31%<br />
Figure II-11: Total <strong>Energy</strong> (Manures)<br />
Figure II-12: Total <strong>Energy</strong> by Percentage<br />
(Manures)<br />
Identifying Effective <strong>Biomass</strong> Strategies: Page 19<br />
Quantifying Minnesota’s Resources and Evaluating Future Opportunities
Animal Processing<br />
Byproducts of animal slaughter and meat processing. Specific animal processing wastes listed in<br />
BioPET are:<br />
Feedstocks include:<br />
Feather Meal, Greases, Lard, Meat Meal and Tankage, Poultry Fat, Edible Tallows, and<br />
Inedible Tallows<br />
Animal processing residues are the smallest category of biomass in the state, with annual<br />
production of approximately 23,000 billion BTU. Meal and tankage are almost half of that at<br />
47%. Other contributors are greases (22%), inedible tallow (15%), edible tallow (8%), and waste<br />
water treatment plant sludge (5%).<br />
12,000<br />
Inedible Tallow<br />
16%<br />
Feather Meal<br />
1%<br />
10,000<br />
Greases<br />
23%<br />
8,000<br />
Billion Btu<br />
6,000<br />
Edible Tallow<br />
8%<br />
Poultry Fat<br />
1%<br />
Lard<br />
1%<br />
4,000<br />
2,000<br />
0<br />
Feather Meal Greases Lard Meat Meal and<br />
Tankage<br />
Poultry Fat Edible Tallow Inedible Tallow<br />
Meat Meal and Tankage<br />
50%<br />
Figure II-13: Total <strong>Energy</strong><br />
(Animal Processing Residues)<br />
Figure II-14: Total <strong>Energy</strong> by Percentage<br />
(Animal Processing Residues)<br />
Page 20<br />
Identifying Effective <strong>Biomass</strong> Strategies:<br />
Quantifying Minnesota’s Resources and Evaluating Future Opportunities
Identifying Effective <strong>Biomass</strong> Strategies: Page 21<br />
Quantifying Minnesota’s Resources and Evaluating Future Opportunities
Municipal Waste Streams<br />
Waste from urban centers. Specific waste streams include:<br />
Landfill Gas, Municipal Solid Waste (MSW), WWTP sludge<br />
25000<br />
20000<br />
Municipal Solid Waste<br />
(MSW)<br />
Billion Btu<br />
15000<br />
10000<br />
Municipal Solid Waste<br />
(MSW)<br />
93%<br />
WWTP Sludge<br />
4%<br />
Flared Landfill Gas<br />
3%<br />
5000<br />
Flared Landfill Gas<br />
WWTP Sludge<br />
0<br />
Figure II-15: Total <strong>Energy</strong><br />
(Municipal Waste Streams)<br />
Figure II-16: Total <strong>Energy</strong> by Percentage<br />
(Municipal Waste Streams)<br />
Fossil Fuels<br />
Both for comparison purposes as well as for co-firing applications, fossil fuel resources are listed.<br />
Although individual inventories were not determined since Minnesota does not have any native<br />
sources of fossil fuels, general fuel characteristics and prices were entered included in BioPET.<br />
Fossil fuels include:<br />
Minnesota Average Coal, Bituminous, Sub-Bituminous, Lignite, Fuel Oil (#2 and #6), Diesel<br />
Fuel (#2), Natural Gas, and Propane<br />
Page 22<br />
Identifying Effective <strong>Biomass</strong> Strategies:<br />
Quantifying Minnesota’s Resources and Evaluating Future Opportunities
Dedicated <strong>Energy</strong> Crops<br />
Crops raised for the sole purpose of producing energy in the forms of electricity and/or heat.<br />
Over the past several decades, much research has looked into the possibility of using dedicated<br />
crops to produce energy, particularly short-rotation woody crops like hybrid poplar and willow<br />
and herbaceous crops like switchgrass, reed canary grass, and miscanthus. The research led by<br />
David Tilman at the University of Minnesota has brought attention also to the potential<br />
advantages of perennial prairie grasses.<br />
Although BioPET does not include dedicated energy crops, we include them in this written report<br />
because of their great potential. Among the benefits expected from using perennial crops for<br />
energy are high biomass accumulation and low tillage, soil erosion, and herbicide applications.<br />
Since these crops regenerate after harvest, they do not need to be reestablished for a number<br />
of years. But they are not low input crops. With the exception of diverse prairie grasses (see<br />
below), the continual harvest of biomass from perennial biomass plots requires nutrient<br />
replacement at levels similar to annual row crops (Brummer, Burras, Duffy, and Moore, 2002).<br />
Dedicated energy crops may end up costing more than agricultural or forest residues because<br />
they must cover the full costs of land and the establishment and maintenance of the stand. In<br />
contrast, residues like corn stover or logging wastes are byproducts of primary products like corn<br />
grain or roundwood that carry the costs of establishment, maintenance, land rents, and harvest.<br />
Usually, the price of residues is based only on the added costs of handling them. But, on the<br />
other hand, the cost of establishing and maintaining prairie grasses should not be high. Their<br />
economic outcomes will have to await their planting in substantial acreages.<br />
Herbaceous crops. Much of the research in herbaceous cellulosic feedstocks like switchgrass,<br />
reed canary grass, and miscanthus has focused on perennial monocultures. But it is also possible<br />
to seed switchgrass stands with legumes such as alfalfa. This offers the farmer the benefits of<br />
reduced nitrogen applications and the use the first cut from the field as forage and the second<br />
cut as fuel.<br />
Switchgrass. Switchgrass is perhaps the best studied perennial grass in the US – it has even been<br />
mentioned in a State of the Union address. A switchgrass stand successfully established in year<br />
one can be harvested in the fall of year two and for several years thereafter. Switchgrass stands<br />
are expected to last for ten years before reestablishment, but some may remain productive<br />
much longer. Yields vary widely depending on soils and rainfall. They tend to be lower in the dry<br />
high plains states than they are in the moist southeastern states. In Iowa yields range from 1 to<br />
5.25 tons per acre, with an average of roughly 2.5 tons per acre. A detailed study of switchgrass<br />
production costs in southern Iowa estimates a cost of $70/ton with a yield of 4 tons/acre<br />
(Brummer et al., 2002).<br />
Diverse prairie grasses. In recent years ecologists have found increasing evidence that<br />
ecological diversity creates greater biomass yield and stability than a monoculture does. In a<br />
recent publication, ecologists at the University of Minnesota summarized the results of a longterm<br />
study of biomass yields and carbon sequestration on plots of degraded land containing<br />
1,2,4,8 or 16 different perennial grassland species. They found that the most diverse plots<br />
produced 238% more bio-energy than monoculture prairie grasses and claimed to sequester 4.4<br />
MG h-1 year-1 in the soil and roots, compared to 0.14 MG ha-1 year-1 for monoculture crops.<br />
The researchers estimate, from these figures, that energy derived from such diverse plots will be<br />
carbon negative (ie. that the plants will store more carbon in the soil each year than the fossil<br />
Identifying Effective <strong>Biomass</strong> Strategies: Page 23<br />
Quantifying Minnesota’s Resources and Evaluating Future Opportunities
fuels for producing, harvesting and transporting them will release into the air). (NSF, 2006; Hill<br />
and Tilman, 2006, 2007).<br />
Diverse prairie grasses for energy feedstocks offers a number of advantages over monocultures.<br />
Once established, diverse prairie plots are remarkably stable. Theoretically, they never need to<br />
be reestablished. If the plants are harvested after they have become dormant in the late fall,<br />
they require no nitrogen fertilizers because legumes provide all the needed nitrogen, and they<br />
need very little fertilizer to replace other nutrients because they send most nutrients down into<br />
the plant’s root systems in the fall.<br />
Diverse prairie plots provide other benefits, like habitat for game birds and other wildlife species.<br />
But most importantly, prairie grasses not only thrive on severely degraded agricultural lands, they<br />
actually improve their health over time. These ecological benefits may persuade the federal<br />
government to allow the planting and harvesting of diverse prairie grasses on CRP lands, where<br />
harvests currently are prohibited.<br />
NOTES ON DATA RESOURCES<br />
Most of the potential biomass energy feedstocks quantified in BioPET already are in use for other<br />
purposes. Even though they seem already to be spoken for, we include them all because future<br />
increases in energy costs may make them more valuable for energy than for their current uses. If<br />
that becomes the case, policy issues will arise. A currently controversial case of that shift from<br />
food to fuel is corn ethanol. But critical as biomass energy policy is, it is not the subject of the<br />
BioPET tool.<br />
BioPET bases its estimates mainly on the best available public information. Most data on<br />
commercial enterprises are proprietary and therefore unavailable for public analysis.<br />
Nevertheless, we have to gain some understanding of the scale of those activities in order to<br />
assess opportunities for sound energy development and sound public policy. It should be noted<br />
that in practice many of these figures will vary across the state due to climate, soil types, market<br />
changes, and other regional variations. Our numbers, imperfect though they may be, are the<br />
best estimates we can make using available data sources.<br />
Agriculture (Crops and Crop Residues)<br />
Minnesota crop acreages and yields by county are obtained from the National Agricultural<br />
Statistics Service (NASS) database for the most recently available three- year period (2002-2004).<br />
Since NASS records yields “as reported” without making moisture or quality adjustments, we<br />
have to convert the “as reported” quantities into tons of dry matter.<br />
NASS data are published by county. The production of counties with fewer than 1,000 acres of a<br />
crop generally is combined with other counties in the same Crop <strong>Report</strong>ing District (CRD) and<br />
their totals are reported as “other counties” in the CRD summary or, for a few low-volume crops,<br />
as “Other Districts” in the state summary. This is done to protect the privacy of producers who<br />
are distinctive enough in their counties to be clearly identifiable. For our study, these combined<br />
acres are allocated back to individual counties. <strong>Biomass</strong> summaries are computed for the<br />
three-year average production. Using the moisture content assumptions as presented in BioPET,<br />
all quantities were converted to dry tons.<br />
The derived yield estimates are not net of “downstream” processing. Therefore we make no<br />
distinction between acreage used solely for energy purposes and acreage used for some other<br />
Page 24<br />
Identifying Effective <strong>Biomass</strong> Strategies:<br />
Quantifying Minnesota’s Resources and Evaluating Future Opportunities
primary purpose, like food, animal feed, and so on. The figures represent annual growth of<br />
biomasses, not their ultimate markets.<br />
Values in the NASS database are based upon bushels harvested. Using nominal industry rules of<br />
thumb, assumptions were used to convert biomass inventories to a dry-ton basis. These<br />
assumptions are listed below.<br />
Table II-1: Crop Assumptions<br />
Crop<br />
Weight per<br />
Bushel<br />
Moisture<br />
Content<br />
Alfalfa -- 9.6%<br />
Barley 48 lbs 14.5 %<br />
Canola -- 13 %<br />
Corn 56 lbs 15.5 %<br />
Corn Silage -- 70 %<br />
Dry Beans -- 10 %<br />
Oats 32 lbs 14%<br />
Potatoes -- 21.2 %<br />
Soybeans 60 lbs 13 %<br />
Sugar Beets -- 16.4 %<br />
Sunflowers -- 10 %<br />
Sweet Corn 56 lbs 10.3 %<br />
Wheat 60 lbs 13.5 %<br />
Assumptions were also necessary for estimating the amount of crop residues generated per<br />
bushel of crop harvested. These are shown table II-2.<br />
Agricultural Processing Wastes<br />
Table II-2: Crop Residue Assumptions<br />
Crop Residues<br />
% of grain<br />
weight<br />
Moisture<br />
Content<br />
Barley Straw 90 % 10 %<br />
Oat Straw 90 % 10.4 %<br />
Wheat Straw 90 % 16 %<br />
Corn Stalks 85 % 0 %<br />
Sunflower stalks 90 % 10 %<br />
Sweet Corn Stalks 100 % 76 %<br />
Other Hays -- 12 %<br />
Ethanol. A growing proportion of Minnesota corn is going into ethanol production. BioPET has modeled<br />
the production process of ethanol by-products [ie., oil (the corn syrup plus other soluble materials), feed,<br />
and DDGs] using parameters developed by Jordan and Taff, 2005. The principal by-product with<br />
energy potential is dried distillers grains (DDGs), which now are sold principally for livestock feed.<br />
However, a few plants are beginning to use them for internal energy needs. These estimates assume<br />
that, for now, all the ethanol by-products are available for external energy production.<br />
Flour milling. The milling of wheat results in two products: flour and wheat midds. Estimates are<br />
calculated by applying the same production model to each major flour mill in Minnesota.<br />
Soybean oils. Almost all Minnesota soybeans are crushed for livestock feed and soybean oils.<br />
Both these products could be energy sources, but currently only oils are being used for energy<br />
through conversion into biodiesel. These estimates assume that all the soybean meal and all the<br />
Identifying Effective <strong>Biomass</strong> Strategies: Page 25<br />
Quantifying Minnesota’s Resources and Evaluating Future Opportunities
oil not converted into biodiesel are available for energy use. Biodiesel itself is reported as if it<br />
were fuel for electricity production.<br />
Sugar beet by-products. Sugar beet processing in Minnesota is confined to three locations.<br />
BioPET’s numbers are based on production records the plants themselves keep on four products:<br />
sugar, beet pulp pellets, molasses, and tailings. All except tailings currently are sold in separate<br />
product markets. The bulk of the potential biomass energy produced at these plants is<br />
embedded in the sugar itself.<br />
Wood<br />
Forests. The U.S. Forest Service Minnesota makes periodic estimates of forest productivity (it has<br />
done so annually since 2004) and reports it in the Forest Inventory Analysis (FIA) database. Data<br />
are reported for each tree species in each county, but these local estimated means vary widely,<br />
as the Forest Service acknowledges. Consulting with the staff that maintains the FIA database,<br />
we use the county mean acreage for three species groupings -- softwoods, aspen, and nonaspen<br />
hardwoods. With these acreage numbers, along with multi-county annual increment<br />
(based on the four Minnesota FS analysis region boundaries for this assignment), we estimate the<br />
annual green-ton growth for three groupings in each county and use an average moisture<br />
content estimate to convert green-ton estimates to dry tons per year. <strong>Energy</strong> equivalents are<br />
calculated using the feedstock energy parameters already mentioned, updated where<br />
necessary.<br />
Woody crops. The two primary short rotation woody crops that have been studied in the US are<br />
hybrid poplars and willow. Hybrid poplars have been studied in Minnesota for a number of<br />
years. In 2004 the first commercial hybrid poplar plantings for energy were initiated by the<br />
Laurentian <strong>Energy</strong> Authority, in the expectation that they will use the trees as fuel for their boilers<br />
(CERTs, 2005).<br />
It will generally take a year to prepare the ground for planting of hybrid poplars, and the initial<br />
harvest is generally expected to take place 10 to 12 years after planting. The accumulation of<br />
biomass in hybrid poplar stands is expected to be 3 dry tons per acre per year in Minnesota<br />
(Riemenschneider, Netzer, and Berguson, 1996).<br />
Paper mills. BioPET models paper production among all Minnesota mills with common process<br />
parameters. The mills already use black liquor and wood wastes to generate process steam and<br />
electricity for internal use, and some also use mill sludge.<br />
Wood processing industries. OSB production is modeled for Minnesota mills using common<br />
process parameters. Most plants already use waste wood for internal energy needs.<br />
Urban wood waste. BioPET’s figures in this category come from two sources, one local, the other<br />
national. The local estimate is based on consumption by the District <strong>Energy</strong> facility in St. Paul<br />
which, according to anecdotal reports, currently uses all the wood waste readily available in the<br />
seven-county Twin Cities metropolitan area. From District <strong>Energy</strong>’s annual consumption we<br />
calculate the tons per capita of waste wood available in the metro area and apply that ratio to<br />
the urban population of each county as recorded by the US Census. The national source, the<br />
“Billion Ton Study.” by Oak Ridge National Laboratory (Perlack, Wright, Turhollow, Graham,<br />
Stokes, and Erbach, 2005), estimates the amount of urban waste wood available each year in<br />
each county. BioPET uses both local and national sources but tends to favor the ORNL numbers.<br />
Page 26<br />
Identifying Effective <strong>Biomass</strong> Strategies:<br />
Quantifying Minnesota’s Resources and Evaluating Future Opportunities
Manures<br />
Variability. Depending on their species, housing systems, diets, and digestions, livestock produce<br />
manures that contain different moisture levels and BTU densities. Beyond that inherent<br />
variability, certain amendments like rinse water, wood shavings, straw, and corn stover that are<br />
added to manure for easier handing or livestock comfort, introduce further inconsistencies.<br />
Limited data. Calculating manures for BioPET from available data can be a challenge. The<br />
starting point is the NASS database of Minnesota livestock production numbers by county, but<br />
limitations in those data force us to derive figures from other clues as well. For example, since<br />
NASS doesn’t track all animal species found on farms, we model numbers and sizes of animals<br />
based on our knowledge of the way livestock are raised. Since NASS takes inventories of various<br />
species of livestock at various times of the year, the data do not provide a snapshot. Some data<br />
are not reported at all because of privacy.<br />
Inferences. We have to infer the number of livestock on farms in each county from no less than<br />
sixty columns of figures on thirty-five classes of livestock raised or fed in Minnesota. In some cases<br />
we base our categories on amounts of corn, soybean meal, and oats consumed by those thirtyfive<br />
animal classes. In other cases we base estimates on the number of days in a year that a<br />
particular class of animal is alive on a Minnesota farm to eat feed and excrete manure. We<br />
gather estimates of days on feed from published budgets and from University of Minnesota<br />
animal scientists who have specific information on livestock. We assume that some classes of<br />
livestock, like dairy cows, are alive 365 days a year, while others, like broilers, live just 56 days. We<br />
calculate pounds of manure excreted daily for each class of livestock on a wet basis and a dry<br />
basis. Excreted manure of poultry tends to be 25% total solids, while swine manure tends to be<br />
10% total solids (MWPS, 2004).<br />
Our numbers for animals of a particular class reflect either NASS data or estimates by the project<br />
team. The number of animals in each county is derived from the various crop reporting districts<br />
of the state. <strong>Final</strong> values show the number of tons of manure annually produced by the classes<br />
of livestock in each county. We show estimates for both wet and dry tons in order to help the<br />
developer assess transportation costs and calculate BTUs on a dry-ton basis.<br />
The Conservation Reserve Program (CRP)<br />
The federal Conservation Reserve Program (CRP) pays landowners to convert their cropland to<br />
permanent cover, such as grassland or trees, for a term of ten or fifteen years. Under current<br />
program rules, lands in CRP cannot be harvested. But if that policy changes, they could grow<br />
biomass for energy.<br />
We calculate potential energy contents of these lands by first aggregating all 25 official cover<br />
types (warm season grass, wetlands, wildlife plots, cool season grass, etc.) into the three main<br />
categories of grass, trees, and other, and then applying a common yield estimate for each of<br />
these broad categories. For grasses, we estimate 2.2 tons per acre per year based on the<br />
research of Tilman, Reich, Knops, Wedin, Mielke, and Lehman, 2001. For brushland, we settle on<br />
1 ton per acre per year based on a low-yield estimate in the forest softwood feedstock<br />
calculations. We then calculate the energy content of each broad category using the<br />
parameters mentioned previously.<br />
Identifying Effective <strong>Biomass</strong> Strategies: Page 27<br />
Quantifying Minnesota’s Resources and Evaluating Future Opportunities
Data on Municipal Sludge<br />
Nearly all municipal wastewater treatment plant (WWTP) sludge is currently spread on farmland<br />
to take advantage of its significant nutrient and tilth-building components. Currently, only a few<br />
plants use sludge for internal energy, mostly in the form of heat. The estimates in BioPET indicate<br />
the amount of energy that would be produced if all plants in the county used all of their sludge<br />
to produce biomass energy. Values are based on the annual sludge management report of the<br />
Minnesota Pollution Control Agency, which itemizes it by county on a dry-ton basis. We<br />
calculate its energy content in the way described previously.<br />
FUEL SELECTION CONSIDERATIONS<br />
We stress that, while BioPET offers the best generalizations that can be made using existing data,<br />
it does not pretend to make the kind of exhaustive, definitive evaluation a developer will want in<br />
selecting an individual fuel for a specific biomass power plant. Our estimates serve only as a<br />
preliminary screen for more in-depth technical analyses. The Agricultural Utilizations Research<br />
Institute (AURI) is an excellent resource for providing up-to-date information on feedstock<br />
regional variations within Minnesota.<br />
An outline for a more in-depth analysis of potential biomass fuels might include the following<br />
items (Miles et al. 1995):<br />
• Collecting representative samples of all fuels being used and those being considered.<br />
• Engaging a laboratory with experience in biomass fuel analysis to analyze the samples for<br />
proximate, ultimate, total chlorine, and elemental ash.<br />
• Calculating the concentration of alkalis and sulfur compounds (MMBTU/lb or kJ/kg, dry<br />
basis)<br />
• Comparing the level of alkali in the fuel with experiences of other plants in burning similar<br />
fuels<br />
• Striving to find fuels with alkali levels of 0.4 lb/MMBTU (0.17 kg/GJ) or less or blend fuels to<br />
this maximum level. If a high alkali fuel is used, attention should be paid to ways of<br />
minimizing its formation and consequent damage to the system.<br />
• Preparing a schedule of blends by fuel types so that fuel entering the boiler has<br />
predictable deposit characteristics.<br />
• When fouling cannot be explained, having an experienced laboratory examine the<br />
deposits and identify the constituents that contribute to fouling.<br />
Attention to these fuel performance issues will minimize expensive surprises and help ensure the<br />
installation and operation of a well designed, sustainable bio-power system.<br />
We estimate biomass volumes by referring to variety of sources and contacts as well as the<br />
extensive experience and insight of members of the project team. These estimates are not net<br />
of “downstream” processing. For example, we estimate corn grain production prior to its use as<br />
livestock feed and, hence, manure production. A finer stage of analysis would decrement the<br />
corn grain estimate by the appropriate amount in order to avoid double-counting of energy<br />
potential.<br />
A power plant developer also has to consider carefully any current or potential downstream<br />
competition for biomass. BioPET estimates the gross theoretical availability without reference to<br />
present or future withdrawals of biomass. The following chapter presents formulae for reducing<br />
the theoretical biomass availability (the gross annual growth shown in BioPET) down to the<br />
technical availability (the volume that could be delivered considering limitations imposed by<br />
Page 28<br />
Identifying Effective <strong>Biomass</strong> Strategies:<br />
Quantifying Minnesota’s Resources and Evaluating Future Opportunities
equipment, logistics, soil health, etc.) and then reducing that amount further down to economic<br />
availability by eliminating biomass that is too expensive to be used as fuel because of<br />
competition from other uses. Since the reduction formulae involve a number of complicated,<br />
ever-changing factors, the developer of a specific project in a specific location at a specific<br />
time using specific fuels will want to make that critical estimate himself or herself.)<br />
We next then estimate collection and initial processing costs for each of the relevant feedstocks.<br />
The result is a “supply curve” for biomass at the county level: how much will it cost per ton (or per<br />
BTU) to produce a “pile” of a given biomass feedstock in the county, ready for shipment to a<br />
power plant.<br />
Identifying Effective <strong>Biomass</strong> Strategies: Page 29<br />
Quantifying Minnesota’s Resources and Evaluating Future Opportunities
CHAPTER III : BIOMASS AVAILABILITY FOR<br />
ENERGY<br />
The preceding chapter told what volumes of biomass are produced each year in Minnesota.<br />
It’s important to know that. But if all that biomass were to go into energy, people and animals<br />
would go hungry. So it’s even more important to know what portion of total biomass can be<br />
considered for fuel. That is the subject of this chapter.<br />
CURRENT BIOMASS POTENTIAL RELATIVE TO STATEWIDE<br />
ENERGY USE<br />
The following graphs show that biomass is unlikely to provide more than a portion of Minnesota’s<br />
demand for energy. These charts comparing existing biomass resources to total energy<br />
consumption, electricity consumption, and summer demand with the energy contained in all<br />
Minnesota biomass that can be harvested and brought to market – both food crops and<br />
residues. It would take almost every available bit of biomass in Minnesota to meet the state’s<br />
electricity needs.<br />
2,000,000<br />
1,800,000<br />
1,600,000<br />
Transportation<br />
1,400,000<br />
Billion Btu<br />
1,200,000<br />
1,000,000<br />
Industrial<br />
800,000<br />
600,000<br />
Commercial<br />
400,000<br />
200,000<br />
Residential<br />
-<br />
Agricultural<br />
Residues<br />
Crops<br />
Agricultural<br />
Processing<br />
Residues<br />
Wood Manures Animal<br />
Processing<br />
Residues<br />
Human Waste<br />
Streams<br />
Minnesota's<br />
Total <strong>Energy</strong><br />
Consumption<br />
Figure III-1: Total Theoretical <strong>Energy</strong> Potential<br />
That obviously is not a possibility. Most biomass, especially in large categories like crops and<br />
wood, is destined to be made into products like food, lumber and paper. Some liquid fuel<br />
manufacturers, like corn ethanol producers, may be able to outbid food manufacturers for<br />
crops because their prices track ever more costly petroleum. But prices of fuels for electric<br />
power are constrained by the low prices of its competition, coal and nuclear fuels. <strong>Biomass</strong><br />
power plants will have to live on the leavings, like the hays, straws and stalks that contain<br />
approximately 10% of Minnesota’s annual energy consumption, or manures and woody residues,<br />
which each contain about 1%. Or perhaps future dedicated energy crops, like switchgrass or<br />
prairie grasses, which are not accounted for in current growth statistics.<br />
Page 30<br />
Identifying Effective <strong>Biomass</strong> Strategies:<br />
Quantifying Minnesota’s Resources and Evaluating Future Opportunities
Even a limited contribution to Minnesota’s energy portfolio is a contribution worth having. It will<br />
take a broad, diverse portfolio of renewable, sustainable fuels to replace a cheap, abundant<br />
(but polluting) fossil fuel like coal. <strong>Biomass</strong> will be one of a number of essential contributors.<br />
Since the biomass energy contents of biomass reported in the previous chapter represent gross<br />
annual growth not net of other non-energy uses, the pertinent question for the bio-power<br />
developer becomes: how much of that gross biomass energy actually is available for power<br />
generation To answer that question, we have to make calculations not contained within the<br />
BioPET tool.<br />
From Theoretical to Technical to Economic Availability<br />
We begin those calculations with BioPET’s figures for gross annual growth, which we’ll cal the<br />
Theoretical <strong>Biomass</strong> <strong>Energy</strong> Potential. Some of that potential can’t be used for any purpose at<br />
all because it is lost in harvesting, storage, or transportation, or it must be plowed under to<br />
maintain the health of soils. We subtract that to arrive at the Technical <strong>Biomass</strong> <strong>Energy</strong> Potential.<br />
A large portion of that technically available potential energy will be too expensive to use for fuel<br />
because it is in demand for non-energy<br />
products or for other reasons, like logistics.<br />
Subtracting that high-priced portion from<br />
the Technical <strong>Biomass</strong> <strong>Energy</strong> Potential<br />
leaves us with the Economic <strong>Biomass</strong><br />
<strong>Energy</strong> Potential available for biomass<br />
energy. This process of elimination can<br />
apply at any scale – statewide by using as<br />
a starting point the gross BioPET values for<br />
all 87 Minnesota counties; regional by<br />
aggregating gross BioPET values for a<br />
cluster of counties; or local by looking at<br />
gross BioPET values for just one county.<br />
Running statewide BioPET numbers<br />
through that process of elimination, we<br />
arrive at four categories of biomass that<br />
seem to have the greatest Economic <strong>Biomass</strong> <strong>Energy</strong> Potential:<br />
• hays, straws and stalks,<br />
• woody residues,<br />
• wet manures and<br />
• dry manures<br />
Theoretical <strong>Biomass</strong> <strong>Energy</strong> Potential<br />
The theoretical biomass energy potential is calculated by applying the following formula to the<br />
dry-ton biomass inventories in BioPET.<br />
<strong>Energy</strong>Theoretical = Dry Tons * <strong>Energy</strong> ContentBTU/pound* 2000pounds/ton<br />
Where:<br />
1,000,000 BTU/MMBTU<br />
Reductions<br />
due to<br />
technical<br />
limitations<br />
and economic<br />
factors<br />
Economic<br />
Technical<br />
Theoretical<br />
<strong>Energy</strong> Theoretical = The total energy content in MMBTU for a given feedstock in each<br />
county.<br />
Identifying Effective <strong>Biomass</strong> Strategies: Page 31<br />
Quantifying Minnesota’s Resources and Evaluating Future Opportunities
Dry Tons = The estimated quantity in dry tons of a given feedstock in each county.<br />
<strong>Energy</strong> Content = The BTU content of a dry pound of a given feedstock<br />
Technical <strong>Biomass</strong> <strong>Energy</strong> Potential<br />
Since Theoretical <strong>Biomass</strong> <strong>Energy</strong> Potential does not account for physical factors which reduce<br />
biomass harvests, like inefficient harvest technologies or the need to leave residues on the land<br />
to maintain soil fertility and prevent erosion. We estimate the technical biomass energy<br />
potential of each feedstock using the following equation.<br />
<strong>Energy</strong>Technical = Dry Tons * RP * (1- MR) * <strong>Energy</strong> ContentBTU/pound* 2000pounds/ton<br />
Where:<br />
1,000,000 BTU/MMBTU<br />
<strong>Energy</strong>Technical = The energy content in MMBTU for a given feedstock in each county that is<br />
available for use as a bio-power feedstock.<br />
Dry Tons = the estimated quantity in dry tons of a given feedstock in each county.<br />
RP = The recoverable portion, expressed as a percentage, of a given feedstock that can<br />
be technically recovered for use as a bio-power feedstock. This value also includes<br />
expected losses due to storage, transportation, etc.<br />
MR = The portion, expressed as a percentage, of a given feedstock that must remain on<br />
the land for reasons of preventing soil erosion, maintaining soil productivity etc.<br />
<strong>Energy</strong> Content = the BTU content of a dry pound of a given feedstock.<br />
The theoretical potential for wet manures of sheep and beef cattle is further reduced because<br />
they usually are not housed in an enclosure where their manure can be collected for a digester.<br />
(Fehrs, 2000).<br />
Economic <strong>Biomass</strong> <strong>Energy</strong> Potential<br />
After we have arrived at an estimate of technical biomass energy potential, we subject<br />
feedstocks to a series of screening criteria to determine which have economic biomass energy<br />
potential for electric generation. Manures, a potentially important feedstock, call for a special<br />
analysis detailed below. Other feedstocks are screened on the bases of price compared to<br />
traditional fuels, and competition from non-energy industrial users.<br />
Manures. To begin the screening of dairy and swine manures, we find in NASS, 2006 county data<br />
that 13% of Minnesota’s cows live in 65 herds of more than 500 head, the smallest herd that can<br />
support an anaerobic digester paired with an electrical generator (DOC, 2003a). Using these<br />
values to calculate the average energy available at large dairy farms, we estimate the<br />
economic potential of dairy manure in each county using the following formula:<br />
Dairy <strong>Energy</strong>Technical= ((<strong>Energy</strong>Technical * 13%)/65) * # Farms<br />
Where:<br />
Dairy <strong>Energy</strong>Technical = The energy content, in MMBTU, of the dairy manure technically<br />
available as a bio-power feedstock in a given county.<br />
13% = The percentage of Minnesota’s dairy cows found in herds greater than 500 head.<br />
65 = The number of dairy farms in Minnesota with herds greater than 500 head.<br />
# Farms = The number of dairy farms in a given county with herds greater than 500 head.<br />
Page 32<br />
Identifying Effective <strong>Biomass</strong> Strategies:<br />
Quantifying Minnesota’s Resources and Evaluating Future Opportunities
Since NASS doesn’t provide a similar data set for Minnesota’s swine herds, we use a different<br />
method to estimate the technical energy potential of swine manure. Economic analyses of<br />
anaerobic digesters running swine manure suggest they need a herd of at least 12,000 to<br />
operate economically in Minnesota. Unfortunately, NASS provides a state inventory of only<br />
swine herds greater than 5,000 head, encompassing 46% of Minnesota’s pigs (NASS, 2006). We<br />
estimate technically available swine manure at 46% of county-level theoretical estimates, but<br />
since many states don’t have such herds, the resulting figure probably overstates the state-wide<br />
technical potential Lacking more precise information on the size and geographical distribution<br />
of the state’s large swine operations, however, we can’t provide a more exact calculation.<br />
Further screens. We next subject other biomass categories to a series of screens, beginning with<br />
price. Feedstocks more expensive than natural gas are eliminated because they aren’t costeffective<br />
for base-load generation. That eliminates most animal processing wastes, crops and<br />
crop-processing residues.<br />
The next screen rules out feedstocks used by industries to create high-value products. Most of<br />
those feedstocks are ~ 3 times the price of coal and therefore uncompetitive for base-load<br />
power generation. They probably would become even less competitive if a power facility bid<br />
up their price, assuming that current industrial consumers could outbid bio-power facilities. So<br />
this screen eliminates agricultural crops.<br />
Timber in the form of cordwood also drops out. On a BTU basis, stumpage (the price of<br />
unharvested timber stands) of aspen, Minnesota’s largest wood crop, is at least twice what<br />
Minnesota’s power plants pay for coal (DNR, 2005; Jacobsen, 2006; and EIA, 2006b). That<br />
doesn’t take into account harvesting and trucking, which are 89% of the cost of wood delivered<br />
to the mill. Delivered prices of other species, like birch, have been lower than aspen but still<br />
higher than coal on a BTU basis.<br />
$7.00<br />
$6.00<br />
$5.00<br />
$ per MMBtu<br />
$4.00<br />
$3.00<br />
$2.00<br />
$1.00<br />
$0.00<br />
1997 1998 1999 2000 2001 2002 2003 2004 2005 2006<br />
Aspen Birch Coal<br />
Figure III-2: Price comparison: aspen and birch pulpwood<br />
on the stump and coal delivered to MN in 2004<br />
Wood waste, on the other hand, may be affordable for biomass fuel. Wood is the densest and<br />
most transportable form of biomass available, and loggers are eager to sell harvest residues, like<br />
limbs, lily pads and tops, and unmerchantable species, that they have to harvest to meet<br />
Identifying Effective <strong>Biomass</strong> Strategies: Page 33<br />
Quantifying Minnesota’s Resources and Evaluating Future Opportunities
contract requirements. In the absence of established markets, price information on wood<br />
residues is sketchy. But the advent of new users like the Laurentian <strong>Energy</strong> Authority in Hibbing<br />
and Virginia may improve that situation.<br />
Our final screen eliminates hays and trees grown on CRP lands which, under current CRP<br />
regulations, can’t be harvested. There has been an ongoing discussion of making CRP biomass<br />
available for biomass energy, but no change in the established policy.<br />
CATEGORIES WITH GREATEST ECONOMIC BIOMASS ENERGY<br />
POTENTIAL<br />
Following this process of elimination, four categories of biomass are left standing.<br />
• hays, straws and stalks<br />
Straws from barley, oats, and wheat, hay categorized as switchgrass/other hay, and<br />
stalks from sunflowers, grain corn and sweet corn.<br />
• woody residues<br />
Logging residues (tops, limbs, lilly pads), mill wastes (bark, slabs, sawdust, off-fall), brush,<br />
thinnings and urban tree waste.<br />
• wet manures<br />
Manures from dairy cows and hogs.<br />
• dry manures.<br />
Manures from broilers, layers and turkeys.<br />
2,000,000<br />
1,800,000<br />
1,600,000<br />
Transportation<br />
1,400,000<br />
Billion Btu<br />
1,200,000<br />
1,000,000<br />
Industrial<br />
800,000<br />
600,000<br />
Commercial<br />
400,000<br />
200,000<br />
Residential<br />
-<br />
Minnesota's Total <strong>Energy</strong><br />
Consumption<br />
Woody Residues Hays, Straws and Stalks Manures<br />
Figure III-3: Economic Potential and Minnesota <strong>Energy</strong> Consumption<br />
The component breakouts of each category are detailed in the following charts.<br />
Page 34<br />
Identifying Effective <strong>Biomass</strong> Strategies:<br />
Quantifying Minnesota’s Resources and Evaluating Future Opportunities
Billion Btu<br />
160,000<br />
140,000<br />
120,000<br />
100,000<br />
80,000<br />
Corn Stalks<br />
Corn Stalks<br />
75%<br />
Sunflower Stalks<br />
0%<br />
Sweet Corn Stalks<br />
0%<br />
Barley Straw<br />
1%<br />
Oat Straw<br />
2%<br />
Other Hay/Switchgrass<br />
8%<br />
60,000<br />
40,000<br />
20,000<br />
0<br />
Barley<br />
Straw<br />
Oat Straw<br />
Other Hay/<br />
Switchgrass<br />
Wheat Straw<br />
Sunflower<br />
Stalks<br />
Sweet Corn<br />
Stalks<br />
Wheat Straw<br />
14%<br />
Figure III-4: Economic <strong>Energy</strong> Potential<br />
(Hays, Straws, and Stalks)<br />
Figure III-5: Economic <strong>Energy</strong> Potential by<br />
Percentage (Hays, Straws and Stalks)<br />
14,000<br />
12,000<br />
Logging Residues<br />
Urban Wood Waste<br />
26%<br />
10,000<br />
Billion Btu<br />
8,000<br />
6,000<br />
Brushland<br />
Urban Wood Waste<br />
Logging Residues<br />
49%<br />
4,000<br />
2,000<br />
0<br />
Brushland<br />
25%<br />
Figure III-6: Economic <strong>Energy</strong> Potential (Wood)<br />
Figure III-7: Economic <strong>Energy</strong> Potential by<br />
Percentage (Wood)<br />
7,000<br />
Hog Manure<br />
6,000<br />
5,000<br />
Dairy Manure<br />
36%<br />
Billion Btu<br />
4,000<br />
3,000<br />
Dairy Manure<br />
2,000<br />
1,000<br />
Hog Manure<br />
64%<br />
0<br />
Figure III-8: Economic <strong>Energy</strong> Potential<br />
(Wet Manures)<br />
Figure III-9: Economic <strong>Energy</strong> Potential by<br />
Percentage (Wet Manures)<br />
Identifying Effective <strong>Biomass</strong> Strategies: Page 35<br />
Quantifying Minnesota’s Resources and Evaluating Future Opportunities
7,000<br />
6,000<br />
Turkey Manure<br />
Turkey Manure<br />
77%<br />
Broiler Manure<br />
11%<br />
5,000<br />
Billion Btu<br />
4,000<br />
3,000<br />
2,000<br />
1,000<br />
Broiler Manure<br />
Layer Manure<br />
0<br />
Layer Manure<br />
12%<br />
Figure III-10: Economic <strong>Energy</strong> Potential<br />
(Dry Manures)<br />
Figure III-11: Economic <strong>Energy</strong> Potential by<br />
Percentage (Dry Manures)<br />
Conversion to Units of Electricity<br />
The following formula is applied to find the potential electric energy potential of each<br />
feedstock:<br />
ElectricityPotential = 1,000,000 BTU/MMBTU * <strong>Energy</strong>Tech * EfficiencyElec * 1,000 kWh/MWh)<br />
Where:<br />
3412BTU//kwh<br />
Electrical Potential = The megawatt-hours of electricity that could be generated with a<br />
given feedstock.<br />
<strong>Energy</strong>Tech = The energy content, in million BTUs, technically available for use as a biopower<br />
feedstock.<br />
EfficiencyElec = The conversion efficiency of biomass feedstocks to electricity. For<br />
hays/straws, woody residues and dry manures an efficiency of 25% was used. For wet<br />
manures an efficiency of 12% was used. This efficiency represents the net electrical<br />
efficiency from the energy content of raw manure. It incorporates the efficiency of<br />
biogas production by the digester and the electrical efficiency of the electrical<br />
generating equipment (in many cases a biogas enabled engine generator set).<br />
To estimate the generating capacity that each potential feedstock could support the following<br />
formula was applied.<br />
CapacityPotential =<br />
Where:<br />
ElectricityPotential<br />
(8760hours/year*Capacity Factor)<br />
CapacityPotential = The electrical generating capacity, in megawatts, that can be<br />
supported by a given bio-power feedstock.<br />
Page 36<br />
Identifying Effective <strong>Biomass</strong> Strategies:<br />
Quantifying Minnesota’s Resources and Evaluating Future Opportunities
Capacity Factor = The amount of time in a given year, expressed as a percentage, that<br />
an electrical generator is expected to be available for operation. A capacity factor of<br />
85% was used for each potential bio-power feedstock.<br />
Comparing Theoretical, Technical and Economic Availability<br />
The green columns (technical potential) and pink columns (theoretical potential) show that<br />
some biomass categories are virtually 100% technically available, while others drop off<br />
dramatically. Crops, processing residues and animal processing residues are all 100% technically<br />
available. Woody materials are generally available, but almost half of hays, straws and stalks<br />
are technically unavailable because of technological and ecological factors mentioned earlier.<br />
Because beef and sheep manures are difficult to recover, only 63% of them are expected to be<br />
technically available<br />
900000<br />
800000<br />
700000<br />
600000<br />
Billion Btu<br />
500000<br />
400000<br />
300000<br />
200000<br />
100000<br />
0<br />
Theoretical<br />
Agricultural<br />
Residues<br />
Crops<br />
Agricultural<br />
Processing<br />
Residues<br />
Wood<br />
Manures<br />
Animal<br />
Processing<br />
Residues<br />
Human<br />
Wastes<br />
Technical<br />
Economic<br />
Figure III-12: Theoretical, Technical, and Economically Available <strong>Energy</strong><br />
Stepping down from technical availability to economic availability, the blue columns (economic<br />
availability), or lack thereof, show that crops, agricultural processing residues and animal<br />
processing residues are totally eliminated by economic criteria. Only a small portion of hays,<br />
straws and stalks are eliminated by restrictions on harvesting CRP lands. Assuming that logs are<br />
too expensive to use for fuel, woody materials drop off steeply. A significant portion of dairy and<br />
swine manures can’t be captured because only very large herds produce enough to make<br />
anaerobic digesters economically feasible.<br />
Figure III-12 shows that technical limitations on biomass availability are much less important than<br />
economic ones. The majority of the state’s biomass is unlikely to become bio-power feedstock<br />
because it is too expensive for base-load generation. This is ironic because unlike individual<br />
wind turbines, a biomass power plant could theoretically dispatch baseload power 24/7 if it<br />
were not too expensive. But with the appropriate gasification conversion technology biomass<br />
fuel someday may replace natural gas in peaking plants.<br />
Identifying Effective <strong>Biomass</strong> Strategies: Page 37<br />
Quantifying Minnesota’s Resources and Evaluating Future Opportunities
Most promising categories. The bar graph below narrows our focus to the categories we have<br />
identified as economically feasible for bio-power applications. The gap between technical and<br />
economic limitations varies by feedstock type. Technical limitations account for most of the<br />
difference between the total energy and bio-power potential energy of hays, straws and stalks.<br />
For woody biomass, most of the difference between total energy content and bio-power<br />
potential is due to economic limitations. For manures each limitation plays a roughly equal role.<br />
500,000<br />
450,000<br />
Total<br />
Total<br />
400,000<br />
Technical<br />
350,000<br />
300,000<br />
Billion Btu<br />
250,000<br />
200,000<br />
Technical<br />
Economic<br />
150,000<br />
100,000<br />
50,000<br />
Economic<br />
Total<br />
Technical<br />
Economic<br />
0<br />
Agricultural Residues Wood Manures<br />
Figure III-13: Theoretical, Technical, and Economic Potential of<br />
Crop Residues, Wood, and Manures<br />
Comparing Costs of <strong>Biomass</strong> and Fossil Fuels<br />
Hays, straws, and stalks and woody residues are the most abundant sources for biomass power<br />
feedstocks, but currently tend to be more expensive than coal. Figure III-14 illustrates the cost<br />
components of baled switchgrass, logging residues, and hybrid poplars in comparison to<br />
delivered coal. It is important to note that, as with other products, the per unit price of coal may<br />
decrease with higher volumes. Large scale coal-fired power plants (hundreds of MWs) operated<br />
under long-term utility contracts may pay around $1.08/MMBtu while smaller facilities (hundreds<br />
of kWs to tens of MWs) will pay higher amounts around $2.60/MMBtu (Lindquist, 2007). When<br />
comparing fuels for smaller plants, a higher cost of coal estimate would be more appropriate.<br />
This of course does not include any added environmental taxes that may be implemented at a<br />
later date (something to consider with such long-term operation schedules). Much discussion<br />
surrounds the idea of establishing carbon taxes to combat global warming. If such taxes were<br />
instituted, the price of coal could increase dramatically.<br />
Page 38<br />
Identifying Effective <strong>Biomass</strong> Strategies:<br />
Quantifying Minnesota’s Resources and Evaluating Future Opportunities
$9.00<br />
$0.06<br />
$8.00<br />
$7.00<br />
$3.16<br />
$ per MMBtu<br />
$6.00<br />
$5.00<br />
$4.00<br />
$1.02<br />
$0.38<br />
$0.06<br />
$0.59<br />
$3.07<br />
$3.00<br />
$2.00<br />
$4.80<br />
$0.58<br />
$4.30<br />
$2.60<br />
<br />
$1.08<br />
$1.00<br />
$1.30<br />
$0.00<br />
Switchgrass Logging Residues Hybrid Poplar Rnage for Minnesota<br />
Delivered Coal<br />
Costs at the Source Transportation to Storage Facility Costs at the Storage Facility Costs at the Power Plant<br />
Figure III-14: Comparisons of Typical Delivered Fuel Costs<br />
SUMMARY<br />
In summary, biomass can be used as a source of energy using a variety of technologies, and in<br />
a wide variety of applications. Many of the more advanced technologies available for<br />
converting biomass to energy are in a period of rapid technological advance and commercial<br />
deployment. Through their ability to improve the efficiency of biomass utilization and their ability<br />
to transform biomass into higher value products, such as liquid fuels and chemical feedstocks,<br />
these advanced technologies have the potential to revolutionize the economics of using<br />
biomass as an energy source.<br />
The challenge for policy makers in designing policies to advance the use of biomass as an<br />
energy source is to arrive at policies that will encourage the use of biomass while allowing<br />
market forces to sort out the combination of applications and technologies that will provide the<br />
greatest economic benefit. The combination of policies that will most effectively meet that<br />
challenge will depend, in part, upon the specific goal that policy makers wish to achieve. If the<br />
goal is to increase the use of biomass as an energy source a different set of policies would be<br />
used than if the goal is to increase the use of biomass to generate electricity.<br />
Identifying Effective <strong>Biomass</strong> Strategies: Page 39<br />
Quantifying Minnesota’s Resources and Evaluating Future Opportunities
CHAPTER IV : BIOMASS HARVESTING,<br />
PROCESSING AND TRANSPORTATION<br />
The next step after determining which biomass fuels are appropriate to the project is to decide<br />
the best way to handle them between the field and the power plant. <strong>Biomass</strong> has to be:<br />
• harvested without contamination<br />
• collected<br />
• processed (including drying, size reduction, and/or densification),<br />
• transported to the power plant<br />
• stored<br />
Except for the obvious first step – harvesting – other steps might occur in various orders and<br />
places, depending on cost factors and logistics. Storage, for example, might occur at the<br />
harvest site, collection site, plant site, or all of the above. The same is true of processing. In order<br />
to reduce transportation costs, biomass may be dried and/or size-reduced at the farm or<br />
collection point and then further processed into fuel at the power plant.<br />
Since so much of the cost of biomass fuel stems from its harvesting, collecting, storing, processing<br />
and transporting, the financial success of a project may rely as much on the thought and<br />
ingenuity that go into these steps as it does on the generation technology itself. Some schemes<br />
go so far as to envision small, portable gasifiers installed on flatbed trucks going from farm to<br />
farm, collecting biomass, reducing it to gases and char, and delivering those fuels to a power<br />
plant – providing in one fell swoop all intermediate steps but harvesting. Whatever the scenario,<br />
efficient handling of low-density, low BTU material like biomass is key to the economic success of<br />
a biomass power project.<br />
HARVESTING AGRICULTURAL BIOMASS<br />
Growers have to make a paradigm shift to sell biomass fuel. They must come to see residues,<br />
like straw and corn stover, as valuable commodities due to their energy content and treat them<br />
as such. If stover, for example, comes in contact with the soil, its usefulness as fuel is diminished.<br />
Up until now, farmers have left stover in the field. Recently, however, manufacturers of<br />
harvesting machinery have begun to develop new models that capture these by-products with<br />
the same care as crops. Those machines will allow growers to sell residues for production of<br />
cellulosic ethanol as well as biomass power generation. Once those markets become<br />
established, it won’t take long for growers or contract harvesters to adopt the new paradigm.<br />
HARVESTING TIMBER<br />
Loggers also will have to view residues as a valuable part of their harvest. Because of its density<br />
and high BTU content, wood is the easiest form of biomass to transport and burn in a power<br />
plant. But as we’ll see later, if silica, or grit, is delivered with the wood, it will slag, or cake, on<br />
boiler surfaces and cause damage. Some plants using wood fuel have had to reject deliveries<br />
of woody residues because of contamination. To sell into energy markets loggers will have to<br />
learn to keep slash – limbs, leaves and tops – off the ground.<br />
Page 40<br />
Identifying Effective <strong>Biomass</strong> Strategies:<br />
Quantifying Minnesota’s Resources and Evaluating Future Opportunities
PHYSICAL FACTORS AFFECTING BIOMASS PROCESSING<br />
Depending on cost factors, processing may be done at the source, at the plant, or somewhere<br />
in between. But there are physical and logistical factors to consider as well.<br />
Moisture Content<br />
<strong>Biomass</strong> fuels exist in a wide range of moisture contents which have a substantial effect on<br />
biomass fuels’ transportation costs, degradation in long-term storage, processing, and<br />
conversion into energy. Therefore moisture content underlies decisions in all those areas.<br />
Agricultural biomass. The timing of the harvest affects its processing after harvest. A biomass’s<br />
moisture content fluctuates throughout the year. Herbaceous crops, like switchgrass, and grain<br />
crops, like corn, begin to dry even before harvest. Switchgrass can drop up to 15% of its moisture<br />
late in the season and be ready to bale immediately after harvest. Switchgrass cut earlier than<br />
that has to be dried before baling.<br />
The moisture content of any biomass fuel drops after harvest. Crops like corn stover or<br />
switchgrass can dry enough to bale within hours or days of harvest regardless of the date. The<br />
biomass’s original moisture content, the weather conditions, and the arrangement of the harvest<br />
in the field all affect drying time. Material spread evenly over a field typically dries much faster<br />
than it does in windrows.<br />
Woody biomass. Wood can be passively or actively dried. Logs left to dry in the open air<br />
typically drop to 30% to 50% moisture content within a year after harvest. Active methods, like<br />
blowing air through logs under shelter or placing them in rotary drum driers like those used to dry<br />
alfalfa, can lower moisture more quickly. Rotary drum driers usually burn natural gas, but some<br />
newer models run on electricity or waste process heat. Some even pull a vacuum. Infra-red<br />
drying, a technology used in the lumber and paint industries, also has come into use for logs.<br />
Infra-red drying is most effective for products that already are at less than 30% moisture.<br />
The cost of drying will vary considerably depending on material, initial moisture content, and<br />
many other factors. Drying costs range widely from $0.50 to $15 per ton.<br />
Wood Particle Size<br />
Each biomass power plant will specify the particle size needed for efficient and safe operation.<br />
Particles too large will burn incompletely, thereby increasing costs of fuel and disposal. At the<br />
other extreme, particles too small – dust – can be explosive in boilers and processing and<br />
handling equipment. Hence most facilities remove dust. District <strong>Energy</strong> St. Paul, for example,<br />
screens feedstocks with a ¼” trommel to remove all sawdust and grit. Some facilities dispose of<br />
collected dust while others carefully remix it with fuel to burn it safely.<br />
The two most common size-reduction machines used on logs are chippers and tub grinders.<br />
Chippers cut consistently sized angular chips with roughly equal sides. Tub grinders produce<br />
long, stringy particles, usually about 1” by 2” by 6”, that almost always have “tails” on their ends.<br />
Grinders usually are used to make wood mulch because the tails hold it in place on a planting<br />
bed. But tails can bridge in storage bins and jam bucket elevators and auger conveyors.<br />
Identifying Effective <strong>Biomass</strong> Strategies: Page 41<br />
Quantifying Minnesota’s Resources and Evaluating Future Opportunities
(Washington State University, n.d.)<br />
Figure IV-1: Tub Grinder<br />
Log size is an important consideration in deciding which machine to use. Tub grinders can<br />
handle trees and stumps up to 14’ diameter. But even the largest chippers do not work well on<br />
trees larger than 2’ in diameter. Logs larger than that have to be split by shears into pieces with<br />
a diameter less than 2’ in order to enter a chipper. Thus tub grinders reduce large logs more<br />
cheaply than chippers because only one step with one machine is involved. But if the tub<br />
grinder can’t make wood particles small enough to meet specifications in one pass, that<br />
becomes a false economy because the wood has to run through the machine a second time,<br />
adding cost. If possible, the plant should select a machine that produces its size specification in<br />
a single pass.<br />
In Minnesota, the usual cost of grinding or chipping logs and brush to a particle size of less than<br />
2” would be $8.00 to $15.00 per ton, not including transportation and tipping fees. Adding<br />
delivery would about double the cost. To grind or shred wood to 1/4” or 1/2” would probably<br />
increase the cost by another $3 to $10 per ton. Therefore biomass facilities designed to accept<br />
larger particle sizes can buy their feedstocks cheaper.<br />
Anaerobic Digester Particle Size<br />
Particle size also affects the performance of anaerobic digesters. A size of 1.5 inch or less works<br />
best for high-solids anaerobic digesters. Besides traditional grinders and chippers, size reduction<br />
drums and thermal treatments can be used to reduce feedstock sizes. There is a trend toward<br />
doing more processing of municipal solid waste (MSW) in central facilities. Source-separated<br />
organics (SSO) programs, like one in Hutchinson, Minnesota, are appearing in many U.S.<br />
communities. Minneapolis and St. Paul are planning SSO programs.<br />
Some European and Canadian SSO plants prepare waste for anaerobic digestion by rolling it in<br />
drums 8 feet to 12 feet in diameter. Internal risers or shelves lift the waste until it tumbles down.<br />
Liquids taken from anaerobic digesters are reintroduced into the drum to inoculate the waste.<br />
The liquid combined with the tumbling produces 1.5-inch particles.<br />
Page 42<br />
Identifying Effective <strong>Biomass</strong> Strategies:<br />
Quantifying Minnesota’s Resources and Evaluating Future Opportunities
Thermal treatment of SSO also involves a mixing drum. Pressurizing the drum for ten to thirty<br />
minutes with steam breaks down the cell walls of the biomass to reduce its size. Thermal<br />
treatment typically increases the moisture content of the feedstock by 10% and adds roughly<br />
$3.00 to $7.00 per ton to processing costs.<br />
Chemical Composition and Physical Characteristics<br />
Chemical composition and physical characteristics influence fuel handling and processing<br />
decisions. Some straws, like flax and hemp, are abrasive. Flax chive, a by-product produced by<br />
pounding, not only is abrasive; in handling it compresses into small, hard balls that bridge in<br />
storage bins and conveying equipment to cause blockages. Many straws contain silica. Others<br />
contain corrosive chemicals.<br />
Some feedstocks corrode handling equipment, some attack boilers, and some pollute the air.<br />
Some do several of these things at once. Within a few months of operation, municipal solid<br />
waste can corrode augers and steel conveyors to the point of uselessness. Chlorides destroy<br />
boilers, which is why oat hulls, which contain chlorine, usually are mixed with other biomass, like<br />
wood, to make boiler fuel. Wood off the stump is benign, but wood waste from factories that<br />
make secondary wood products, like millwork, furniture and cabinets, often contains resins and<br />
plastics that off-gas chlorides that corrode boilers and pollute the air. Some biomasses contain<br />
high levels of nitrogen that contribute to NOx emissions. This is a manageable problem that<br />
includes such strategies as mixing materials with low-nitrogen wood to mitigate the problem.<br />
Another problem in burning some biomass feedstocks is slagging caused by certain salts and<br />
high pH. Potassium can contribute to slagging in boilers, but silica and silicon dioxide can be<br />
more problemmatic culprits. Silica has a melting point of 1710 o C, but in high pH environments,<br />
melting temperatures might be considerably lower than that. When silica melts in a boiler or<br />
gasifier, it forms glass that hardens on heat exchangers, pipes, and exhaust systems. It also forms<br />
a toxic compound called cristobalite when it cools. Removing slag is a tough job that adds to<br />
downtime and operating costs.<br />
The following table shows the silica content of ash from various biomass feedstocks for<br />
comparison. Silica itself may not be a problem unless it is introduced into a high pH<br />
environment. As a previous chapter suggests, a thorough chemical analysis of feedstocks and<br />
their potential effects on all stages of power production is an important preliminary to planning a<br />
biomass facility.<br />
Identifying Effective <strong>Biomass</strong> Strategies: Page 43<br />
Quantifying Minnesota’s Resources and Evaluating Future Opportunities
Table IV-1: Silica in <strong>Biomass</strong> Ash<br />
<strong>Biomass</strong> Fuel Silica Ash Content (%<br />
dry weight basis)<br />
Urban Tree Waste 28%-55%<br />
Red Oak 21%<br />
Willow 8%-17%<br />
Switch Grass 61%-65%<br />
Plywood 29%<br />
Barley 25%-60%<br />
Canary Reed Grass 78%<br />
Grass Clippings 68%<br />
Corn Stover 52%<br />
Straw 54%<br />
Oat Hull 61%-70%<br />
Oats 62%<br />
Sorgum Grass 71%<br />
Rice Hull 75%-96%<br />
(Miles et. Al. 1995; Klass, 1998)<br />
There are three ways to reduce slagging of silica and cristobalite:<br />
• Operate boilers at temperatures below silica’s melting point;<br />
• Use feedstocks with lower pH that will raise the melting temperature of silica;<br />
• Mix problem feedstocks with those that have low pH and/or silica content. (For example,<br />
mixing 15% oat hulls with wood wastes.)<br />
Issues of Scale<br />
A project’s scale can determine where its fuel is processed. Very small facilities often require<br />
that fuel be delivered ready to use in order to avoid investing in equipment, paying labor, and<br />
dedicating scarce space to fuel processing. But they will pay a premium for fuels delivered to<br />
specification unless they are giving suppliers an opportunity to avoid the disposal cost of a waste<br />
product.<br />
At the other extreme, very large facilities may use their greater buying power to make suppliers<br />
deliver fuel to specification in order to minimize processing costs. But most facilities probably will<br />
not have enough buying power to impose high standards on their fuel suppliers. Unless they can<br />
afford to pay a premium, facilities of middle size may have to process their own fuel on site.<br />
PROCESSING FOR TRANSPORTATION<br />
To make it ready for shipping to a power plant, biomass fuel usually has to be dried to reduce<br />
weight and compacted to reduce bulk. Shredding, chipping, grinding, baling, or some<br />
combination thereof increases biomass bulk density. Baling of crop residues like corn stover or<br />
energy crops like switch grass is a must for long distance trucking. But for rail shipping, biomass<br />
can be put into wet storage without baling. For example, corn stover usually is chopped into<br />
one-foot lengths for wet storage and then trucked to a local collection center to be loaded into<br />
a gondola car (a railroad car with an open top but enclosed sides and ends, used to haul bulk<br />
commodities).<br />
Page 44<br />
Identifying Effective <strong>Biomass</strong> Strategies:<br />
Quantifying Minnesota’s Resources and Evaluating Future Opportunities
Wood Chipping<br />
Trees and logging residues may be chipped before shipping to reduce its volume and help dry it<br />
out. The challenge is finding the cheapest way to do it. One way, chipping wood residues at<br />
the logging site, reduces the number of times the wood has to be handled. But it might increase<br />
other costs.<br />
(Photo by Warren Gretz (NREL, n.d.)<br />
Figure IV-2: Tree Chipper<br />
For example, if mobile chippers were moved from logging site to logging site, those expensive<br />
machines would spend much of their time moving up and down roads instead of chipping<br />
wood. The opposite option, hauling logging residues or logs to a central chipping yard, keeps<br />
the chipper busy but complicates logistics. Which strategy is cheapest depends largely on the<br />
kind of equipment the logging company already owns. Even if it could chip wood more<br />
efficiently, new equipment might cost more than the money it would save.<br />
Baling<br />
Balers come in a variety of sizes and prices. Some make round bales and some square. Farmers<br />
tend to use round balers because they are less expensive. But biomass energy facilities may call<br />
for large, square bales because they are easier to load, unload and stack with equipment<br />
designed to handle them.<br />
Round bales can be re-baled at an approximate cost of $5 per bale. Some farmers choose to<br />
bale their biomass in round bales initially and then pay to have them re-baled before delivery to<br />
a facility.<br />
Identifying Effective <strong>Biomass</strong> Strategies: Page 45<br />
Quantifying Minnesota’s Resources and Evaluating Future Opportunities
(Photo by Warren Gretz (NREL, n.d.))<br />
Figure IV-3: Baling Corn Stover<br />
Pelleting<br />
Pelleting is another method of preparing biomass for transport. It improves biomass’s handling<br />
qualities, reduces its moisture content, and densifies it so it’s cheaper to haul. Most pellets are<br />
made by forcing finely ground material through an extrusion die. It emerges as a long, moving<br />
spaghetti-like strand that shears cut into short lengths. The process works best with softer forms of<br />
biomass, like stalks, grasses or sawdust. Even when they can be crushed, glues or lignin-based<br />
chemicals are needed to hold them together.<br />
Pelleting grains, high bulk density, and starch based materials is very efficient resulting in some<br />
industries obtaining pelleting costs as low as $5 per ton (Doering, 2007). <strong>Biomass</strong> material that is<br />
typically fibrous and low in bulk density requires greater horsepower to achieve desired<br />
throughput, thus resulting in pelleting cost ranging from $29 to $36 per ton (Doering, 2007). At<br />
such high costs, pelleting, specifically for electric generating power projects is used only in the<br />
absence of any other alternative.<br />
PROCESSING FOR STORAGE<br />
A number of biomass fuels, like switchgrass and corn stover, are harvested annually in a brief<br />
period each year. To serve as fuel over the course of the year, they must be processed and<br />
stored without degradation. Operating conditions also impose some level of storage. Where<br />
biomass is to be co-fired as a secondary fuel with coal, a one-week supply on-site may be<br />
enough. But investors in some large biomass facilities have required them to maintain a 60 to 90<br />
day supply.<br />
Page 46<br />
Identifying Effective <strong>Biomass</strong> Strategies:<br />
Quantifying Minnesota’s Resources and Evaluating Future Opportunities
Baled Agricultural <strong>Biomass</strong><br />
Preparing switchgrass or dried corn stover for storage may amount to little more than baling it at<br />
a suitable moisture content and storing the bales until needed. Baled biomass can be stored in<br />
a variety of ways: stacked and uncovered in a field, wrapped with plastic and left in a field,<br />
stacked under a simple roofed structure or stacked in a large fully enclosed storage facilities.<br />
Each of these techniques offers certain benefits and incurs certain costs. Generally speaking,<br />
the more exposed the bales are to the elements, the lower their storage costs will be. But losses<br />
to degradation can offset savings. At a minimum, bales stored in the open need some kind of<br />
protection from water, like a tarp or plastic sleeve. Care should also be taken to protect the<br />
bottoms of stacks from infiltration by soil and rocks. Storing baled biomass in sheds costs more,<br />
but it preserves more of its original value.<br />
(CVBP Interim Test Burn Emissions <strong>Report</strong>, 2003, Appendix G)<br />
Woody Fuels<br />
Figure IV-4: Storing Switchgrass Bales<br />
Processing woody materials for storage is similar to processing them for combustion. They are<br />
screened for contaminants, sorted by size (large chunks may be chopped up), and then sent to<br />
the storage pile. Wood chips can be stored outside in a pile for up to a year before odors<br />
become a problem, but piles that grow too high can combust spontaneously. Some facilities<br />
spread new chips over the length of a pile to increase its heterogeneity and minimize variations<br />
in fuel quality.<br />
Identifying Effective <strong>Biomass</strong> Strategies: Page 47<br />
Quantifying Minnesota’s Resources and Evaluating Future Opportunities
(Photo by Dave Parsons (NREL, n.d.))<br />
Figure IV-5: Wood chips stored at the McNeil Generating Station in Burlington, VT<br />
Fuel Degradation and Decomposition<br />
Moisture content, odor, particle size, and fire hazards all are considerations in storing biomass<br />
fuels. Storing grasses or plant leaves with moisture content above 15% leads to partial<br />
biodegradation or composting of the biomass. Freshly cut biomass with green foliage holds<br />
substantial moisture within cell walls. Microbes can thrive in this moisture and decompose the<br />
stored biomass, reducing its energy content and its structural integrity, making piles unstable and<br />
bales difficult to move.<br />
Some biomasses present fire hazards. Dusts from wood and grains are explosive. Brush chips,<br />
with small particle sizes and a 30:1 ratio of carbon to nitrogen, are highly combustible. Nitrogen<br />
is contained in green leaves or green stems in the form of proteins, and carbon is concentrated<br />
in the woody stems. The mix of chips and leaves in brush piles makes for rapid composting at<br />
temperatures as high as 120° to 180° F. But since those high temperatures can lead to<br />
spontaneous combustion, long-term storage of brush chips presents a serious fire hazard. Corn<br />
stover can pose the same problem in storage. Drying is the best preventative. Lowering<br />
Moisture content to 15% limits the microbial action that causes high temperatures. In addition,<br />
rules have been developed to provide standards and specifications pertaining to chip and<br />
sawdust pile geometries that minimizes combustion problems.<br />
Odors<br />
Wet biomass can give off unpleasant smells from the breakdown of protein and fats. When the<br />
interior of a biomass pile lacks oxygen, anaerobes release ammonia and/or sulfur compounds.<br />
The buyer can minimize those emissions by checking moisture content at delivery and rejecting<br />
Page 48<br />
Identifying Effective <strong>Biomass</strong> Strategies:<br />
Quantifying Minnesota’s Resources and Evaluating Future Opportunities
fuels exceeding the moisture content standard. Several wood-fired facilities eliminated odor<br />
problems by adopting “first-in, first-out” inventory policies or limiting storage of fuel to less than<br />
one year.<br />
Processing Corn Stover for Wet Storage<br />
Current corn harvest practices leave stover in the field to be collected and baled once the<br />
grain is harvested. Making two passes increases harvest costs, compacts soils, and adds dirt to<br />
stover. So farm machinery manufacturers are working on designs that will harvest both corn<br />
grain and stover in one pass.<br />
One-pass machines open up new possibilities for biomass marketing. Currently, corn harvest<br />
begins when the moisture content of corn kernels has dropped to 24% or less. But at that point,<br />
stover still is too wet for baling. With a “one-pass” harvest system, clean (but wet) stover could<br />
be separated from grain at a collection site for drying and baling so it is free of dirt and stones.<br />
An alternative that bypasses drying would ensile stover or put it into wet storage, like bagasse at<br />
a pulp mill. On a dry ton basis, it costs more to truck wet corn stover than dry, but it eliminates<br />
fire risk, reduces storage space, prevents losses in baling and hauling, and produces better<br />
overall quality. Piles of wet stover might freeze during cold winters in the Northern Corn Belt<br />
States, but feedlot operators who work with corn silage don’t regard that as a problem (Atchison<br />
and Hettenhaus, 2003)<br />
Processing corn stover for wet storage is similar in many ways to processing other types of<br />
biomass. It must be cleaned of dirt, rocks and other foreign material with magnets and screens.<br />
It then may be shredded in a hammer mill, slurried to 3% solids, and pumped to the top of a<br />
storage pile. (Piles can measure up to 200 x 300 meters at the base and 40 meters tall.) The<br />
storage pile is allowed to settle and create an anaerobic (oxygen-free) condition within the pile.<br />
Since it can’t oxidize, the stored material remains in perfect condition. When it is needed, the<br />
stored biomass passes through a screw press that squeezes its moisture down to 50%.<br />
Silage and wet storage often come up in discussions of cellulosic ethanol plants, bio-refineries,<br />
and other facilities that use corn stover. The cost of dewatering stover to 50% MCW may price it<br />
out of those markets, but further study is warranted.<br />
PROCESSING BIOMASS FOR CONVERSION TO POWER<br />
The final step in processing biomass fuel is to bring it into conformity to power plant<br />
specifications. As when processing fuels for transport and storage, the primary considerations<br />
are size, moisture content, and cleanliness.<br />
Woody fuels are nearly boiler-ready after their initial processing for storage. On their way to the<br />
power plant, woodchips are cleaned once more to remove metal and other foreign materials<br />
missed the first time. They then are screened for size (oversized materials go to a hammer mill for<br />
size reduction) and, if the facility uses a variety of fuels, blended before going to the boiler.<br />
The Ottumwa Generating Station in Ottumwa, Iowa, which has been experimenting with cofiring<br />
switchgrass and coal, provides a template for final processing of baled biomass fuels.<br />
Bales of switchgrass or stover are taken from storage stacks and placed on a conveyor. Twine is<br />
cut from the bales and removed to prevent fouling of the hammer mills. The bales then pass<br />
through a debaler, which chops the bales apart from below and above. The debaled<br />
Identifying Effective <strong>Biomass</strong> Strategies: Page 49<br />
Quantifying Minnesota’s Resources and Evaluating Future Opportunities
switchgrass moves on to an attrition mill, which pulverizes it, and then to a surge bin to wait for<br />
pressurized air to blow it into the boiler.<br />
(CVBP Interim Test Burn Emissions <strong>Report</strong>, 2003, Appendix G)<br />
Figure IV-6: Removing Twine from Bales<br />
<strong>Biomass</strong> Transportation and Infrastructure<br />
<strong>Biomass</strong> power travels in two directions: as feedstock into the power plant via road, rail or water;<br />
and as electricity out of the power plant through connections to the grid or local power<br />
networks. Since roads and power lines usually precede power plants, the biomass power<br />
developer typically will look for sites where those infrastructures already exist. A good source of<br />
water is another essential item because water usually is needed for fuel processing, steam<br />
generation, and/or cooling.<br />
The following maps illustrate elements of infrastructure. The gopher GIS Computer tool allows the<br />
developer to stack the maps in order to find sites where all necessary infrastructures converge.<br />
Combined with the biomass maps in BioPET and reproduced in Chapter I, this array of computer<br />
tools points the way toward feasible plant locations.<br />
gopher<br />
GIS maps of infrastructure and other development resources.<br />
• Roads. State highway maps show interstate and trunk highways, but county maps in<br />
specific areas of interest can be consulted for details on county roads. Seasonal load<br />
restrictions have to be taken into account. Individual farms and logging sites may be<br />
served by gravel roads, but collection points and power plants have to be connected<br />
by ten-ton all-weather paved roads.<br />
Page 50<br />
Identifying Effective <strong>Biomass</strong> Strategies:<br />
Quantifying Minnesota’s Resources and Evaluating Future Opportunities
• Rail. For most biomass plants, whose sizes are limited by fuel collection radii which<br />
themselves are limited by transportation costs, rail probably is not needed. On Class One<br />
rail lines, service can be sporadic because they give priority to unit trains and other long<br />
hauls. Short lines often don’t reach places where fuel is available. As a rule, hauls shorter<br />
than a few hundred miles are cheaper and quicker by truck. Sites on rail are fewer and<br />
more expensive than those on road. Nevertheless, a plant designed for municipal solid<br />
waste might choose to be on rail in order to import feedstocks from far-flung<br />
communities.<br />
• Barge and ship routes. In a few places in Minnesota, like ports on Lake Superior and on<br />
the larger rivers, cheap water shipping might be an option. Ports already have docks<br />
and equipment to handle wood and agricultural material, and some ports, like the Port<br />
of Duluth, have land available for plant sites. Port facilities usually have good<br />
connections to the grid and to other modes of transportation like rail and highway.<br />
• The electric grid. A connection to the grid provides a power plant with a national<br />
market, but its cost has to be carefully scrutinized. In certain locations, higher<br />
connection costs can more than offset lower operating costs. Therefore, from a financial<br />
perspective, the output side of the equation is at least as important as the input side in<br />
choosing a site.<br />
• Local transmission networks. Small local municipal or co-operative utilities may be the<br />
best customers for biomass plants. By providing jobs and markets for local growers, the<br />
biomass plant becomes a key player in the local economy that supports the local utility.<br />
The plant developer does, however, have to emphasize the plant’s role as a local<br />
amenity because NIMBY confrontations with local residents can unravel an entire<br />
project. (We do not map these local networks.)<br />
• Water. Another potential tie-in to a local community is the possible use of its gray water<br />
for process steam and cooling. The plant’s use of waste water might reduce the city’s<br />
treatment costs and keep its effluents within permitted limits. But permitting cuts both<br />
ways. Some environmental regulations ban the use of untreated gray water. So it’s<br />
important to check with permitting authorities before considering that option. Natural<br />
streams of course provide another source of non-potable water, but DNR regulates their<br />
use.<br />
Electric transmission maps are provided by the Land Management Center (LMIC, 2004) at the<br />
Minnesota Department of Administration. They show electric substations and transmission lines<br />
greater than 60 kV, which seem adequate for a power plant supplying energy to the grid.<br />
This information is presented with information from the Minnesota Department of Transportation<br />
on railways, roadways, and waterways, all ways to ship large volumes of biomass fuel on a<br />
continuing basis. Besides transportation, waterways can supply water for process steam and<br />
cooling. Ground water is also a potential source for process cooling and that information is<br />
included as well.<br />
These are but a sample of the data compiled as part of this project. Please refer to gopher, as<br />
discussed in Chapter I, for additional maps.<br />
Identifying Effective <strong>Biomass</strong> Strategies: Page 51<br />
Quantifying Minnesota’s Resources and Evaluating Future Opportunities
Figure IV-7: Infrastructure Maps<br />
Page 52<br />
Identifying Effective <strong>Biomass</strong> Strategies:<br />
Quantifying Minnesota’s Resources and Evaluating Future Opportunities
CHAPTER V : BIO-POWER CONVERSION<br />
TECHNOLOGIES<br />
Human beings have used biomass fuel since cavemen learned how to set wood on fire.<br />
<strong>Biomass</strong> eventually was supplanted with coal, gas and petroleum, which remain the<br />
predominant fuels for generating power to the present day. Until recently, advances in energy<br />
technologies meant extracting more energy from the combustion (or burning) of hydrocarbon<br />
fuels, not inventing other ways of extracting it.<br />
Most non-nuclear power plants still rely on combustion; they burn fossil fuels (coal, oil, natural<br />
gas) in boilers to turn water into steam that drives turbines connected to electrical generators.<br />
Back in the gaslight era, engineers began to develop a different way to produce energy.<br />
Instead of burning fuel in oxygen-rich boilers, carbonization or gasification heated coal to high<br />
temperatures in oxygen-lean “anaerobic” vessels. Since the vessels lacked oxygen to support<br />
combustion, the superheated coal didn’t burn. Rather it gave off a synthetic gas, called “town<br />
gas” or “coal gas,” that could be used for lighting, heating and cooking. The remaining<br />
charcoal could fuel heat-intensive industrial processes like smelting. In the 1930s and 1940s,<br />
German scientists made further innovations in order to replace petroleum supplies cut off by the<br />
war.<br />
Our discussion divides into those two main topics: combustion and gasification. Both conversion<br />
technologies are in use today. But combustion systems far outnumber gasification systems, and<br />
within combustion plants, fossil fuels (coal, natural gas, petroleum) far overshadow biomass fuels.<br />
Recently, however, the environmental consequences of burning fossil fuels have created new<br />
interest in humankind’s original fuel source, biomass.<br />
In a combustion power plant, differences in processing the two classes of fuels, fossil and<br />
biomass, appear in the front end where fuel is handled, processed and burned. Beyond the<br />
boiler, both fuels drive power generation in exactly the same way. So we focus on the<br />
distinctive characteristics of biomass fuels that affect their handling, processing, burning and<br />
waste removal in a power plant.<br />
A more recent technology than combustion, gasification, has a host of potential applications in<br />
waste reduction, biorefining, transport fuels and so on. But we are concerned here with only its<br />
application to the generation of electric power. As is the case of combustion, biomass in a<br />
gasifier usually substitutes for fossil fuel. And since gasification can produce both gaseous and<br />
liquid fuels, that means it can offer substitutes for natural gas, oil, and diesel fuel.<br />
The diagram below illustrates our selection of topics. Issues in boldface are subjects of this<br />
chapter.<br />
Identifying Effective <strong>Biomass</strong> Strategies: Page 53<br />
Quantifying Minnesota’s Resources and Evaluating Future Opportunities
<strong>Biomass</strong> Conversion<br />
Technologies<br />
Direct<br />
Combustion<br />
Co-Firing w/<br />
Coal<br />
Liquefaction<br />
Co-Firing w/<br />
Diesel<br />
Gasification<br />
Co-Firing w/<br />
Natural Gas<br />
Pile Burner<br />
Fluidized Bed<br />
Pyrolysis<br />
Biological<br />
Gasification<br />
Thermal<br />
Gasification<br />
Grate Burners<br />
(Stokers)<br />
Suspension<br />
Anaerobic<br />
Digesters<br />
Aerobic<br />
Digesters<br />
Fixed Bed<br />
Fluidized Bed<br />
(adapated from Schmidt and Pinapati, 2000)<br />
DIRECT COMBUSTION<br />
Figure V-1: Bio-Power Tree Diagram<br />
Direct combustion systems burn biomass in boilers to make steam, which spins turbines that drive<br />
electric generators. Today’s biomass-fired steam cycle plants typically use a single pass steam<br />
turbine (Bain, Amos, and Downing, 2003).<br />
<strong>Biomass</strong><br />
Steam<br />
Exhaust<br />
Air<br />
BOILER<br />
TURBINE<br />
Electricity<br />
GENERATOR<br />
AIR<br />
PREHEAT<br />
WATER<br />
PREHEAT<br />
CONDENSER<br />
Cooling<br />
Water<br />
BLOWER<br />
Condensate<br />
PUMP<br />
PUMP<br />
(Williams and Larson, 1993)<br />
Make-up<br />
Water<br />
Figure V-2: Steam-Turbine (Direct Combustion) System<br />
Each of the several types of direct combustion systems in use has positives and negative and<br />
negative attributes.<br />
Page 54<br />
Identifying Effective <strong>Biomass</strong> Strategies:<br />
Quantifying Minnesota’s Resources and Evaluating Future Opportunities
Pile Burners<br />
Pile burners are a very simple – as the term implies, they contain a pile of fuel, usually wood, on a<br />
stationary grate under a boiler. Combustion air is fed upward through the grate and walls, and<br />
fresh fuel is added continually to the top of the pile or to its bottom through a screw auger. This<br />
latter “underfeed” method makes for more even burning, but it raises the cost of equipment and<br />
maintenance and lowers its reliability. Removing ash involves shutting down the combustion<br />
chamber until it is cool and dumping the ash manually.<br />
Pile burners handle fuels that are dirtier or wetter (up to 65% moisture), have less stringent fuel<br />
processing requirements, and cost less to build and operate than other systems. But they are less<br />
efficient, take more downtime, and are harder to regulate. Their erratic combustion cycles and<br />
slow response times make them unsuited to load-following operations connected to power<br />
transmission networks.<br />
Stoker Grates<br />
Stoker grates are widely used in bio-power plants like the Laurentian <strong>Energy</strong> Authority’s facilities<br />
in Hibbing and Virginia, MN because they distribute fuel more evenly for efficient burning and<br />
don’t have to shut down for ash removal. A further refinement of the stoker grate, The Kabliz<br />
grate, slopes down from the fuel feed and reciprocates to tumble the pile continually forward<br />
and incorporates cooling water within its structure. Its relative simplicity and low fly ash carryover<br />
make it an attractive option.<br />
Fluidized Beds<br />
Atmospheric fluidized bed combustion (FBC) systems are increasingly used to burn biomass. In<br />
this system, the grate is replaced by a bed of inert granular material, usually sand or crushed<br />
limestone. Air is blown upwards through the granular bed with such force that the granules in<br />
the bed circulate and bubble randomly, like a boiling liquid. Finely-ground fuel is blown into the<br />
combustion chamber to burn in suspension. Because the fuel particles are tiny, their surface<br />
area is large relative to their mass, assuring complete combustion.<br />
Identifying Effective <strong>Biomass</strong> Strategies: Page 55<br />
Quantifying Minnesota’s Resources and Evaluating Future Opportunities
(<strong>Energy</strong> Products of Idaho, 2007)<br />
Figure V-3: Fluidized Bed Boiler System<br />
FBC systems can handle a wide variety of fuels -- singly or in blends -- that have high ash<br />
contents, irregularly shaped particles, and high moisture contents (Badger, 2002). They respond<br />
quickly to changing load requirements, burn fuels efficiently, and are inexpensive to maintain.<br />
But they do cost more to build than other types.<br />
The usual reason for adopting fluidized bed systems is to reduce emissions. Their consistent low<br />
combustion temperatures keep NOx emissions low, and some types of FBC systems use limestone<br />
and tune temperatures to optimize limestone/sulfur reactions in order to control SO2. Process<br />
controls like those eliminate the need for equipment to remove sulfur at the stack.<br />
Suspension Burners<br />
Suspension burners inject dry, finely ground biomass fuel high into the boiler to burn in mid-air.<br />
This makes for very efficient burning in a small space, and it allows for quick responses to<br />
changing energy demands because only a small amount of fuel is burning at any given<br />
moment. (Badger, 2002). But drying the fuel and reducing it to small, uniform particles adds<br />
capital and operating costs at the front end.<br />
All suspension burners burn fine particles suspended in a turbulent stream of air, but they come in<br />
two different versions: cyclone burners and pneumatic spreader-stoker systems. Cyclone<br />
burners inject fuel particles pneumatically into horizontal or vertical cylinders where swirling air<br />
Page 56<br />
Identifying Effective <strong>Biomass</strong> Strategies:<br />
Quantifying Minnesota’s Resources and Evaluating Future Opportunities
suspends them as they burn. Spreader-stokers blow fuel horizontally into a combustion chamber<br />
where most of it burns in the air.<br />
SOLVING PROBLEMS IN BIOMASS COMBUSTION<br />
The chemical composition of biomass fuels creates some technical problems not seen in fossil<br />
fuels. Some of the problem materials that lead to fouling and slagging in boilers are alkali, water<br />
soluble alkali, sulfates or chlorides, and silica.<br />
Slagging, fouling, and deposits of the boiler need to be reduced as much as possible because<br />
they:<br />
• increase maintenance outages and costs,<br />
• deteriorate steam plant efficiency or capacity,<br />
• clog fuel supply, and<br />
• increase corrosion (Miles et. al. 1995).<br />
These problems sometimes can be minimized by screening fuel. But many agricultural fuels<br />
simply won’t work in unmodified biomass boilers as a large part of the total fuel supply. Straw<br />
and other annual herbaceous plant materials cause rapid fouling of heat transfer surfaces,<br />
furnace slagging, and clumping in fluidized beds (Miles et al. 1995). Superheater fouling is<br />
perhaps the most critical problem.<br />
Alkali Compounds in Conventional Boilers<br />
In coal-fired systems, sodium usually is the most troublesome alkali component. But in biomassfired<br />
systems, potassium and, in some cases, chlorine are the major alkali problems (Miles et al.<br />
1995), especially when burning annual grassy crops and residues. Alkali is less of a concern with<br />
most woody materials and other biomass fuels low in alkali compounds (FEMP, 2004).<br />
Conventional coal boilers are not designed for fuels with a high alkali content, but special<br />
designs with low furnace exit gas temperatures can take the curse off crops and agricultural<br />
residues like grasses and straws. Modifications should include: adequate waterwall surface area<br />
or parallel heat exchange surfaces, combustion air metering to control gas temperatures, grates<br />
that can remove large quantities of ash, and blowers to remove soot.<br />
Problems with high-alkali fuels have led many plants to limit them to no more than a 5% blend.<br />
This level still result in significant operating problems and cleaning costs (Miles et al. 1995). The<br />
industry needs new boiler designs that can better control combustion and furnace exit<br />
temperatures, and remove alkali and alkali compounds as they form on boiler grates, walls, or<br />
other convective surfaces (Miles et al. 1995). Fluidized beds can fire somewhat higher<br />
percentages of alkali fuels, but deposits still form. In biofuels production, gasification or pyrolysis<br />
may reduce alkali volatilization, but retrofitting an existing boiler with the necessary equipment<br />
has yet to be demonstrated (Miles et al. 1995).<br />
Calcium Deposits in Fluidized Bed Boilers<br />
Calcium can deposit on the boilers convection surfaces (as CaCO3, CaSO4). Limestone added<br />
to fluidized bed boilers appears to reduce deposition, but does not prevent it. High alumina<br />
sand also reduces clumping in a circulating fluidized beds but does not change the composition<br />
of deposits on the superheater tubes.<br />
Identifying Effective <strong>Biomass</strong> Strategies: Page 57<br />
Quantifying Minnesota’s Resources and Evaluating Future Opportunities
Curing Deposition<br />
Plant operators can use a variety of methods to reduce fouling and slagging (Miles, et. al.<br />
1995):<br />
Fuel Management<br />
• eliminating worst-acting fuel components;<br />
• diluting “dirty” fuels with clean fuels;<br />
• scheduling worst fuels prior to scheduled outages;<br />
• analyzing ash chemistry;<br />
• limiting suspected fuels in fuel mix to less than 5%; and<br />
• screening to remove particulates.<br />
Boiler Controls<br />
• operator training and sensitivity<br />
• tuning combustion controls to limit temperature deviation.<br />
Cleaning and additives<br />
• blowing down fluidized bed media with compressed air,<br />
• sootblowing and hydroblasting<br />
• addition of limestone<br />
Fly Ash<br />
Ash from coal-fired power plants can be sold to the concrete products industry as an additive,<br />
but according to ASTM standards, only if it is 100% from coal (FEMP, 2004).<br />
Emissions<br />
<strong>Biomass</strong> fuels produce fewer emissions than coal. The table below compares the environmental<br />
impacts of seven technologies. Actual emissions will depend on feedstock types, operating<br />
conditions, and other factors. We also include in this table emissions from gasification, a<br />
technology we discuss in the following section.<br />
The table cites stack emission values normally used in comparative analyses. Thus CO2 shows a<br />
positive number as a point source emission at the plant. But that of course doesn’t take into<br />
account the argument that biomass is a net zero carbon source because carbon emitted is<br />
matched by carbon consumed by new biomass growth, a claim that can’t be made for natural<br />
gas, coal, and fuel oil.<br />
Page 58<br />
Identifying Effective <strong>Biomass</strong> Strategies:<br />
Quantifying Minnesota’s Resources and Evaluating Future Opportunities
Technology<br />
Type<br />
Table V-1: Emission Rates (lbs/MWh) for Various <strong>Energy</strong> Technologies<br />
Natural<br />
Gas (1)<br />
Generic<br />
Natural<br />
Gas Fired<br />
Turbine<br />
Combined<br />
Cycle<br />
Plant<br />
Coal (1) Oil (1) Direct<br />
Combustion<br />
<strong>Biomass</strong> (1)<br />
Generic Generic Typical<br />
Utility Utility Stoker<br />
Boiler Boiler Grate<br />
Firing Firing Wood-Fired<br />
Bituminous Only <strong>Biomass</strong><br />
Coal Plant No. 6 Plant<br />
Fuel<br />
Gasification (2)<br />
Combined<br />
Cycle<br />
<strong>Biomass</strong><br />
Gasification<br />
Plant<br />
Landfill<br />
Gas/Biogas<br />
(3)<br />
Typical<br />
Gas<br />
Turbine (>3<br />
MW)<br />
Landfill<br />
Gas/Biogas<br />
(3)<br />
Fuel Cell<br />
(PAFC)<br />
NOX 0.06 3.1 2.5 1.5 1.08 0.44-2.2 0.003<br />
CO 0.03 0.21 0.35 3.556 0.001 0.6 0.015<br />
SO2 0.02 15 10.4 0.4 0.58 0.65 0.006<br />
PM 0.08 1.5 0.87 1.5 0.05 0.07 Negligible<br />
CO2 750 2,296 1,708 3,407 1,962 1,958-3,132 1,078<br />
(Xenergy and Energetic Management Associates, 2003)<br />
1. Massachusetts <strong>Biomass</strong> <strong>Energy</strong> Working Group Technology Assessment, 2001<br />
2. Mann, M & Spath, P. “Life Cycle Assessment of a <strong>Biomass</strong> Gasification Combined-Cycle System,” December 1997.<br />
3. Arthur D. Little, Inc. “Profiles of Leading Renewable <strong>Energy</strong> Technologies for the Massachusetts Renewable <strong>Energy</strong> Trust<br />
Fund,” October 10, 1998.<br />
GASIFICATION<br />
Biological Gasification<br />
Anaerobic digestion falls within a general category called biological gasification, the process of<br />
generating biogas from decomposing organic matter. It can take place in a vessel containing<br />
oxygen, in which case it is called aerobic digestion, or in a vessel deprived of oxygen, in which<br />
case it is called anaerobic digestion.<br />
The process of anaerobic digestion is simple: a conveyor meters sludge, garbage and other<br />
wastes into the end of a long revolving sealed cylinder. The inside of the cylinder is heated to<br />
grow bacteria that decompose waste to produce methane. The cylinder slants down from the<br />
infeed end. That combines with the tumbling action to move the waste slurry slowly from the<br />
high end, where it has entered the cylinder, to the far end where the remaining waste is<br />
removed.<br />
As it usually is practiced, anaerobic digestion is an imperfect process. Most anaerobic digesters<br />
are used to dispose of waste, not produce energy. So they just flare off methane and CO2 or<br />
release them into the air (Xenergy and Energetic Management Associates, 2003). Not only does<br />
that waste energy, it also puts two of the worst greenhouse gasses into the atmosphere. Two<br />
other drawbacks of anaerobic digestion are its slow rate of decomposition and its incomplete<br />
conversion of organic waste.<br />
Nevertheless, anaerobic digesters do play a beneficial role in managing wastes. They take up<br />
little space, use little energy, and dispose of nasty waste streams, like animal manure, sewage<br />
sludge and industrial effluents, that we don’t want to see in our groundwater. Many municipal<br />
wastewater treatment plants across the U.S. use anaerobic digesters to reduce solids in sewage<br />
sludge (Dayton, 2001).<br />
Concerns about the environmental impacts of livestock wastes have rekindled interest in<br />
anaerobic digestion. Manures from dairy and swine farms make good feedstocks for anaerobic<br />
Identifying Effective <strong>Biomass</strong> Strategies: Page 59<br />
Quantifying Minnesota’s Resources and Evaluating Future Opportunities
digesters because they contain a lot of liquids whereas poultry manure which is higher in solids is<br />
harder to process. Gas from digesters can heat farm buildings or fuel internal combustion<br />
generator sets (gensets) for electric power. Biogas-fueled gensets convert uncleaned bio-gas to<br />
electricity at an efficiency of 18 to 25% (Schmidt and Pinapati, 2000).<br />
Thermal Gasification<br />
In a way, thermal gasification is just the opposite of combustion: instead of burning biomass in an<br />
oxygen-rich chamber to heat a separate vessel, a gasifier heats biomass to a high temperature<br />
inside an oxygen-lean vessel. Starved of oxygen, biomass, rather than burning, gives off<br />
combustible gasses that can be used as fuel for further processes. In power plants, for example,<br />
bio-gas can fuel simple-cycle or combined-cycle turbines that couldn’t burn straight biomass<br />
because it would foul their blades.<br />
Fuel (Gas)<br />
COMBUSTOR<br />
COMPRESSOR<br />
TURBINE<br />
Electricity<br />
GENERATOR<br />
Intake Air<br />
Exhaust<br />
(Williams and Larson, 1993)<br />
Figure V-4: Simple-Cycle Gas Turbine<br />
Page 60<br />
Identifying Effective <strong>Biomass</strong> Strategies:<br />
Quantifying Minnesota’s Resources and Evaluating Future Opportunities
Fuel (Gas)<br />
COMBUSTOR<br />
COMPRESSOR<br />
TURBINE<br />
Electricity<br />
GENERATOR<br />
Intake Air<br />
Steam<br />
HEAT RECOVERY<br />
STEAM<br />
GENERATOR<br />
Exhaust<br />
PUMP<br />
Make-up<br />
Water<br />
TURBINE<br />
Electricity<br />
GENERATOR<br />
Cooling<br />
Water<br />
CONDENSER<br />
PUMP<br />
Condensate<br />
(Williams and Larson, 1993)<br />
Figure V-5: Combined-Cycle Gas Turbine System<br />
A lot of research has been done on gasification of coal, but little of it transfers to biomass; the<br />
two are too different. The same isn’t true of natural gas and biogas. In the ethanol industry,<br />
several pilot gasification projects are underway that substitute biogas for expensive natural gas<br />
without significant changes in burners.<br />
Gasified biomass can do more than just substitute for natural gas in existing applications,<br />
however. According to some experts, gasification can release enough energy that it could turn<br />
pulp and paper mills into substantial exporters of power to the grid just by gasifying liquid<br />
residues it now burns. But at this writing, that industry has yet to install its first gasifier (Jordan and<br />
Taff, 2005).<br />
Thermal Gasifier Designs<br />
The basic process of gasifying biomass thermally doesn’t vary significantly from one design to the<br />
next, but designs differ in the ways they feed fuel and air in relation to one another. The design<br />
types are:<br />
• fixed-bed-updraft,<br />
• fixed-bed-downdraft,<br />
• fluidized bed, and<br />
• low pressure.<br />
Fixed-bed-updraft. In these systems, fuel enters from the top of the vessel and air or oxygen from<br />
the bottom. Updraft gasifiers have high grate temperatures, so air needs to be cooled to<br />
Identifying Effective <strong>Biomass</strong> Strategies: Page 61<br />
Quantifying Minnesota’s Resources and Evaluating Future Opportunities
prevent grate damage. Updraft gasifiers work well with fuels with high water and inorganic<br />
content as long as they are large, dense, and uniformly sized.<br />
Fixed bed-downdraft. These gasifiers are best for processing biomass with high volatile content.<br />
They introduce both the biomass fuel and the air/oxygen mixture from the top of the combustion<br />
chamber.<br />
Fluidized bed. This design can handle a wide range of relatively unprocessed feedstocks.<br />
<strong>Biomass</strong> fuel feeds continuously into the chamber and air rises through a bed of inert sand or<br />
crushed limestone that distributes heat evenly. In a directly heated design, char burns in the<br />
gasifier vessel to heat it. In an indirectly heated design, char burns in a separate vessel.<br />
There is good news and bad news about fluidized bed gasifiers. The good news is their superior<br />
operating performance. They confer temperature uniformity, tolerance of wet fuels with<br />
moisture contents up to 55%, and short reaction times. But fluidized bed gasifiers don’t produce<br />
gas of the highest quality. The high temperature of the gas exiting the gasifier leaves alkali<br />
compounds in a vapor phase, and the gas is high in particulates that have to be filtered<br />
(Williams and Larson, 1996).<br />
Low pressure. In this process, two separate chemical reactions occur in two separate reactors.<br />
In the first reactor, hot sand surrounds biomass, whose volatile gasses in pyrolysis arise from the<br />
char, ash and sand to enter a cyclone that divides them into their separate constituents. In the<br />
second reactor, the remaining char is burned to heat the first reactor. Gas from this process has<br />
a BTU content of around 550 per square foot. Scrubbed of impurities, it can power a gas turbine.<br />
Operational Concerns in Gasification<br />
Alkali can cause as much trouble in biogas fueling a turbine as it does in biomass fueling a<br />
boiler. Since alkali fouls turbine surfaces, it must be chemically scrubbed from gas going into a<br />
turbine. Another way to control alkali is to keep gas at a cooler temperature as it exits the<br />
gasifier. Research in the coal industry discovered that at low exit temperatures, alkali<br />
compounds condense on particulates in the gas stream instead of on surfaces of equipment<br />
(Williams and Larson, 1996). Certain chemical additives also might reduce alkali (Miles et al.<br />
1995).<br />
Research on gas exit temperatures hasn’t been incorporated into the design of equipment yet.<br />
Until it is, alkali compounds are removed by electrostatic filters, barrier filters, or wet scrubbers.<br />
Those devices can’t go to work until hot gas from the gasifier has cooled (Stevens, 2001).<br />
Unfortunately, however, losing that heat reduces the overall efficiency of the system. Alkali<br />
“getters” that can remove alkali at high temperatures may resolve that problem, but they<br />
haven’t yet been tried in a commercial system (Stevens, 2001).<br />
Tars are organic materials in the product stream of the gasification process, mostly aromatic<br />
compounds. If the tar condenses, it can do a number of undesirable things:<br />
• form coke on fuel reforming catalysts;<br />
• deactivate sulfur removal systems in co-firing systems;<br />
• erode compressors, heat exchangers indirect combustion systems, and ceramic filters;<br />
• damage gas turbines and engines; and<br />
• frustrate compliance with emissions standards.<br />
In a well designed combustion boiler, tar clean-up is not a critical issue. But in a gasifier, it has<br />
critical importance. Cleaning tar brings:<br />
Page 62<br />
Identifying Effective <strong>Biomass</strong> Strategies:<br />
Quantifying Minnesota’s Resources and Evaluating Future Opportunities
• increased thermal to electrical efficiencies,<br />
• lower emissions, and<br />
• lower treatment costs.<br />
Tars in a gasification system are removed either by a fuel reformer or by tar-destroying catalysts<br />
(Dayton, 2001). The lack of a more effective, less expensive tar removal process remains the<br />
primary barrier to widespread commercialization of combined-cycle power generators<br />
integrated with biomass gasifiers (Klein, 2002). Catalytic processes for reforming tar need to be<br />
better understood (Dayton, 2002). For the time being, conditioning hot gas with known catalysts<br />
is the best way to mitigate tars from biomass gasification (Dayton, 2002).<br />
Particulates. Like emissions from boilers, gasifier exhausts have to be treated by cyclone filters,<br />
barrier filters, electrostatic filters, or wet scrubbers (Stevens, 2001). Removing particulate from<br />
both biomass and coal efficiently will alleviate problems with them.<br />
LIQUEFACTION<br />
Pyrolysis<br />
By decomposing biomass in a vacuum at high temperatures, the process called pyrolysis can<br />
produce raw material for fuels to generate electricity. Pyrolysis creates a solid char, liquids<br />
called pyrolitics, oxygenated oils, and bio-oils, and the gases methane, CO, and CO2.<br />
Bio-oil<br />
On that menu, the liquid, bio-oil, has interesting potential as a fuel. It is not a hydrocarbon but a<br />
single phase, low pH liquid containing as many as 400 different chemical compounds. 2 It<br />
includes more water (15 to 40%) than hydrocarbon fuels, and less energy by volume (Ensyn<br />
Group, Inc., 2001; Diebold, 2000). That high water content and low pH dictate the use of<br />
corrosion-resistant materials in its handling and storage.<br />
In storage, bio-oils can change chemically and physically, increasing in viscosity, losing volatile<br />
compounds, polymerizing, and separating into tarry, sludgy, waxy and thin aqueous phases<br />
(Diebold, 2000). Thus storage can compromise bio-oil’s use as a fuel source. But certain<br />
treatments, like solids filtration, alcohol dilution, and emulsification with diesel fuel, can help<br />
preserve the stability and combustion properties of bio-oils in storage (Chiaramonti, Oasmaa,<br />
and Solanausta, 2007).<br />
Bio-oil has been used successfully in internal combustion engines, boilers and combustion<br />
turbines to generate electricity, but its effect on generating equipment can be a problem<br />
(Oasmaa, Peacocke, Gust, Meier, and McLellan, 2005). Bio-oil has a well-documented ability to<br />
corrode fuel lines and gaskets, as well as foul and corrode fuel injectors and other metal surfaces<br />
(Chiaramonti, et. al. 2007).<br />
2 The composition of bio-oils varies considerably with the initial biomass source materials. One consequence of this<br />
variability of bio-oil composition is significant variability in storage stability and combustion characteristics.<br />
Identifying Effective <strong>Biomass</strong> Strategies: Page 63<br />
Quantifying Minnesota’s Resources and Evaluating Future Opportunities
To date at least three commercial facilities have successfully used bio-oil as a fuel source. One<br />
has used bio-oil to generate electricity, one has used it for heat, and one has used it for<br />
combined heat and power.<br />
• In Wisconsin, the Manitowoc Public Utilities Power Generation Station successfully co-fired<br />
bio-oil from the nearby Red Arrow Products Company at a 5% rate in a 20 MW coal-fired<br />
boiler (Ensyn Group, Inc. 2001; Sturzl, 1997).<br />
• Red Arrow eventually began to use bio-oil to make their own heat and discontinued<br />
deliveries to Manitowoc Public Utilities.<br />
• In West Lorne, Ontario, the DynaMotive <strong>Energy</strong> Systems Corporation has installed at a<br />
wood floor manufacturing facility a fast pyrolysis plant that converts sawdust to bio-oil.<br />
The bio-oil provides heat and fuels a 2.5 MW combustion turbine (Stephens, 2006).<br />
DynaMotive recently signed a contract with the Ontario Power Authority, under Ontario’s<br />
Standard Offer Program, to provide power to the grid ("Dyanmotive", 2007).<br />
Biodiesel<br />
Biodiesel, which is refined from bio-oil, is best known as a bio-based transportation fuel that<br />
substitutes for petroleum diesel fuel. But it also can power an electric generator through an<br />
internal combustion engine, combustion turbine, or boiler.<br />
Minnesota’s Biodiesel Mandate requires that all diesel fuel sold for use in an internal combustion<br />
engine contain at least 2% biodiesel fuel by volume (Biodiesel Content Mandate, 2006). This<br />
means that all utilities and institutions in Minnesota operating diesel-powered generators, or<br />
gensets, now consume B2 fuel. Blended at low levels (
Biodiesel has somewhat different material characteristics than petroleum diesel. Its energy<br />
content is lower on a volume basis than petroleum diesel’s, but its lubricity is greater Blended<br />
with petroleum at low levels, biodiesel raises lubricity enough to offset the lubricity loss resulting<br />
from the Ultra Low Sulfur diesel fuel mandate. Biodiesel fuel typically reduces emissions of<br />
carbon monoxide, carbon dioxide, aromatic hydrocarbons, particulates and SOx. It can<br />
increase NOx emissions, but one study found that cooling charge air prior to combustion<br />
actually makes biodiesel’s NOx emissions less than those from petro-diesel (Bickel, et. al. 2004).<br />
Biodiesel is a complete fuel, not just an additive. Some utilities and institutions have successfully<br />
fueled internal combustion gensets with B100 unblended biodiesel (Barrett, 2004; Zeman, 2006).<br />
Some utilities also are interested in using biodiesel in combustion turbines and boilers<br />
("Dynamotive", 2007; "New York", 2007). Users of neat biodiesel report generally good results, but<br />
they stress the importance of fine tuning generators and emissions equipment, and using hoses<br />
and gaskets that don’t deteriorate from contact with biodiesel (Zeman, 2006).<br />
In addition to it’s compatibility with a number of generator types, biodiesel can be used in a<br />
number of generating strategies.<br />
SUMMARY<br />
A summary of the characteristics of different forms of bio-power conversion technologies are<br />
given in Tables 2 and 3 on the following pages. The tables are meant to help the reader<br />
understand general differences among the strategies.<br />
Conversion<br />
Technology<br />
Pile Burner<br />
Stokers<br />
Fluidized Bed<br />
Combustion<br />
Suspension<br />
Coal-Fired Cofiring<br />
Fixed Bed<br />
Gasification<br />
Fluidized Bed<br />
Gasification<br />
Anaerobic<br />
Digestion<br />
Natural Gas Cofiring<br />
Table V-2: Bio-Power Conversion Technology Specifications<br />
Potential Fuels Boiler Efficiency Turbine Efficiency Overall<br />
Conversion<br />
Efficiency<br />
Urban wood waste, mill residue,<br />
forest residue, ag. residue,<br />
energy crops.<br />
Urban wood waste, mill residue,<br />
forest residue, some ag. residue.<br />
(1)<br />
Urban wood waste, mill residue,<br />
forest residue, ag. residue,<br />
municipal sewage. (1)<br />
Urban wood waste, mill residue,<br />
forest residue, ag. residue,<br />
energy crops.<br />
Coal plus biomass (see<br />
combustion fuels)<br />
Urban wood waste, mill residue,<br />
forest residue, ag. residue,<br />
energy crops.<br />
Urban wood waste, mill residue,<br />
forest residue, ag. residue,<br />
energy crops.<br />
Municipal sewage, animal waste<br />
Natural Gas plus gasified<br />
biomass (see gasification fuels)<br />
50% - 60% (2) 20-40% (4) 20% - 22% (1)<br />
65% (2)<br />
68%-80% (1)<br />
20-40% (4) 23% - 30% (1,2)<br />
65% (2) 20-40% (4) 27% - 28% (1)<br />
80% (2) 20-40% (4) 30% - 36%<br />
(see above<br />
combustion<br />
options)<br />
May reduce by<br />
1.5% - 2% (1)<br />
N/A<br />
(see above combustion<br />
options)<br />
22%-36% (4)<br />
(37% CC typical (4) )<br />
22% - 36% (4)<br />
(37% CC typical (4) )<br />
22% - 40% (spark ignition<br />
engine) (4)<br />
(see above gas turbine<br />
options)<br />
22% - 34% (1)<br />
33% - 37% (2)<br />
35% - 36% (1,2)<br />
30% - 40 (3,1,2,5)<br />
18% - 25% (1)<br />
34% - 40%<br />
(37% typical) (4)<br />
(1) Schmidt and Pinapati, 2000 (2) Bain et al. 2003 (3) BTG, n.d. (4) Oland, 2004 (5)Craig and Mann, 1996 (6) FEMP, 2004<br />
Identifying Effective <strong>Biomass</strong> Strategies: Page 65<br />
Quantifying Minnesota’s Resources and Evaluating Future Opportunities
Conversion<br />
Technology<br />
Pile Burner<br />
Stokers<br />
Fluidized Bed<br />
Combustion<br />
Suspension<br />
Coal-Fired<br />
Co-firing<br />
Fixed Bed<br />
Gasification<br />
Fluidized Bed<br />
Gasification<br />
Anaerobic<br />
Digestion<br />
Table V-3: Bio-Power Conversion Technology Benefits and Limitations<br />
Potential Benefits Technical Limitations Economic Limitations<br />
-- Very simple design<br />
-- Cheap to build<br />
-- Can handle wet and/or dirty fuels.<br />
-- More efficient than pile burners<br />
-- Low fly ash carryover<br />
-- Efficiencies could be improved with<br />
higher pressures, higher<br />
temperatures, and reheat.<br />
-- Can handle fuels w/ MCW from 15%<br />
to 65% (1)<br />
-- Handles fuels with high ash content,<br />
irregularly shaped, or high MCW<br />
-- Lower NOX & SOX<br />
-- Fuel flexibility<br />
-- Reduced fuel costs<br />
-- Reduced SOX, CO2, NOX<br />
-- Reduced disposal costs<br />
-- May not affect efficiencies<br />
-- Simplest design<br />
-- Can use fuels up to 55% MCW (1)<br />
-- Higher outputs fixed beds (1)<br />
-- Reduced water and air pollution,<br />
avoidance of odor, onsite power<br />
and heat, reduced treatment costs,<br />
reduced disposal costs<br />
-- Up to 65% MCW<br />
-- Cyclical operations, erratic<br />
combustion, slow response times.<br />
-- Emerging opportunity fuels cannot<br />
be fired. (1)<br />
-- Fuel sizes ≤ 3” (6)<br />
-- Not suitable for more difficult ag.<br />
residues like rice/wheat straw. (1)<br />
-- More prone to NOX. (1)<br />
-- Alkalis and free chlorine. (1)<br />
-- May have maintenance problems<br />
-- Fuel sizes ≤ 3” (6)<br />
-- Small, uniform particle sizes<br />
-- (Fuel sizes ≤ ½”) (6)<br />
-- Fuels with low MCW<br />
-- Benefits of co-firing occur only up<br />
to 15% (by heat content)<br />
-- Sensitive to gas impurities<br />
-- Low-level gas quality.<br />
-- Handles large, dense, uniformly<br />
sized fuels.<br />
-- Tar removal can be significant<br />
-- Sensitive to gas impurities<br />
-- Up to 55% MCW<br />
-- Slow decomposition rate and<br />
incomplete decomposition<br />
-- Variations in gas flow and slow rates<br />
of gas flow<br />
-- Need to separate organics and<br />
inorganics<br />
-- O&M costs<br />
-- Inability to follow loads<br />
-- Variations in fuel cost<br />
can upset profitability (1)<br />
-- High capital costs<br />
-- High O&M costs for fuel<br />
preparation<br />
-- Optimum size: 50 MW<br />
-- Fuel drying equipment<br />
-- Ash composition<br />
changes and may affect<br />
its salability<br />
-- Lower ranges only (< 500<br />
kW). (1)<br />
-- Competitive with DG<br />
power only (1)<br />
-- Gas treatment reqs<br />
-- Not commercially<br />
available<br />
-- Limited to 2-3 MW (1)<br />
-- Electricity generation<br />
alone is viable in niche<br />
applications only (1)<br />
(1) Schmidt and Pinapati, 2000 (2) Bain et al. 2003 (3) BTG, n.d. (4) Oland, 2004 (5)Craig and Mann, 1996 (6) FEMP, 2004<br />
RESEARCH PURSUITS<br />
In 2002, the <strong>Biomass</strong> Research and Development Technical Advisory Committee (BRDTAC)<br />
issued a report detailing a research and development roadmap to identify public policy<br />
measures for promoting and developing biobased fuels, power, and products. The committee,<br />
representing a wide-range of experts, was established by the <strong>Biomass</strong> R&D Act of 2000. As a<br />
result of their efforts, the following table of short-term and long-term bio-power research needs<br />
were identified. These findings are presented here to provide the reader with an understanding<br />
of what future bio-power research may be trying to address and thereby provide insights into<br />
challenges that bio-power faces today.<br />
An updated report from BRDTAC is due out sometime in 2007.<br />
Page 66<br />
Identifying Effective <strong>Biomass</strong> Strategies:<br />
Quantifying Minnesota’s Resources and Evaluating Future Opportunities
Table V-4: Bio-Power Generation Research Areas<br />
Process 0-3 Years 4-10 Years 10+ Years<br />
Demonstrate co-firing systems that<br />
CO-FIRING<br />
Research to improve efficiency of technologies for co-firing have 40% or greater efficiency than<br />
current systems<br />
DIRECT COMBUSTION<br />
ANAEROBIC DIGESTION<br />
Research to improve the efficiency of direct combustion systems.<br />
Research methods to reduce water content of feedstock for direct<br />
combustion systems<br />
Conduct research to increase<br />
rate of decay of resources for<br />
anaerobic fermentation.<br />
Begin research to reduce capital<br />
costs of anaerobic fermenation<br />
systems<br />
Deign technologies to handle<br />
low quality gas<br />
Perform research to reduce<br />
capital costs of biomasss<br />
gasification systems<br />
Test and demonstrate anaerobic<br />
fermentation systems with<br />
improved operating efficiencies<br />
Test and implement<br />
technologies to convert low<br />
quality gas into useful energy.<br />
Demonstrate and deploy<br />
biomass (forest and agricultural<br />
residue) gasification combinedcycle<br />
power generation at<br />
capacities up to 1,000 dry TPD<br />
Enable commercial deployment of<br />
direct combustion systems that are<br />
cost-competitive with competing<br />
systems.<br />
Enable commercial deployment of<br />
anaerobic fermenation systems that<br />
are cost-competitive with competing<br />
systems<br />
Enable biomass gasification systems<br />
that are cost-competitve with<br />
competing commercial systems.<br />
GASIFICATION<br />
Conduct technology<br />
demonstrations<br />
Demonstrate and deploy forest<br />
products black liquor gasification<br />
combined cycle at capacities of<br />
2 million pounds of black liquor<br />
solids per day and larger.<br />
Demonstrate advanced gasification and biosynthesis gas<br />
technology suitable for integrated use for power generation on<br />
large scale and in distributed systems, in a biorefinery, and for the<br />
production of chemicals, matericals, and other products.<br />
Develop and field-test gasification,<br />
fermentation, and pyrolysis<br />
technologies to produce hydrogen<br />
from biomass.<br />
MODULAR SYSTEMS<br />
Evaluate industry standards for<br />
grid connection.<br />
Establish standards for modular<br />
biomass systems that enable<br />
them to connect to the grid.<br />
Continue research to improve<br />
performance of modular<br />
systems.<br />
Enable deployment of modular<br />
systems that can operate in a<br />
regulated, grid-based system.<br />
Conduct testing of modular<br />
systems.<br />
Demonstrate stand-alone power<br />
facilities with 5 - 50 MW capacity<br />
producing electricity from energy<br />
crops at an average costs of<br />
$0.05 / kWh or less<br />
Improve biobased power generation<br />
efficiencies through wider application<br />
in technologies such as fuel cells,<br />
microturbines, and other distributed<br />
systems.<br />
Adapted with modifications from BRDTAC, 2002<br />
Identifying Effective <strong>Biomass</strong> Strategies: Page 67<br />
Quantifying Minnesota’s Resources and Evaluating Future Opportunities
CHAPTER VI : PRESENT APPLICATIONS OF<br />
BIOMASS TECHNOLOGIES<br />
Much of this study deals with future development of biomass power generation; trying to answer<br />
questions about what kinds of biomass there are, where it is, what its characteristics are, how<br />
much it costs, how to collect and process it, what conversion technologies to use, how to plan<br />
and finance a project, and so on.<br />
But there already are a number of biomass projects in Minnesota that are worth knowing about<br />
because they can teach us lessons their developers had to learn the hard way. And there are<br />
many other existing operations that don’t use biomass now but might do so in the future. This<br />
chapter reviews examples of Minnesota projects to show how technology, biomass, engineering<br />
and financing came together.<br />
CO-FIRING<br />
Co-firing is the use of biomass fuel mixed with other fuels, including fossil fuels. For that reason, it<br />
is not only an additional source of energy, it also is a means of conserving and extending fossil<br />
resources. As it currently is practiced, co-firing mixes biomass (usually wood) with another fuel<br />
(usually coal), usually in a boiler designed for coal. The pulp and paper industry long has cofired<br />
coal with wood waste, and so have utility power plants in areas where wood is cheap and<br />
available. In addition to co-firing in combustion boilers, fuels also can be mixed in more<br />
sophisticated gasification and combined-cycle technologies. In those cases, co-gasifying may<br />
be a more precise term than co-firing.<br />
There are several ways biomass can be co-fired with other fuels. In coal-fired plants, the most<br />
common method is simply adding a small percentage of biomass fuel to coal. But for facilities<br />
using natural gas or oil, biomass first must be transformed by gasification and/or biorefining into<br />
gas or liquid fuels. Biofuels then can combine with fossil fuels to power combustion turbines, add<br />
to the steam cycle of a cmbined-cycle power plant, or mix with other fuels in a gas boiler.<br />
(Chiaramonti, et. al., 2007; Hughes, 2002; Sturzl, 1997)<br />
Co-Firing <strong>Biomass</strong> with Coal<br />
At present, by far the most common way to co-fire solid biomass is to blend it with coal.<br />
Hundreds of U.S. industrial plants, like paper mills, burn their own processing wastes with coal to<br />
generate energy and avoid disposal costs. There are several examples of this in Minnesota. The<br />
Federal <strong>Energy</strong> Management Program ranked Minnesota’s potential for co-firing as “Good,”<br />
based on the state’s average delivered price of coal, its supply of low-cost biomass residues,<br />
and its average landfill tipping fees (FEMP, 2004).<br />
Co-firing coal with biomass in combustion boilers offers advantages over burning biomass alone.<br />
Boilers designed exclusively for biomass generally are smaller and less efficient (around 20%<br />
efficiency) than larger coal-fired boilers (33 to 37% efficiency). After a coal boiler is tuned to use<br />
mixed fuels, co-firing does not result in an appreciable loss in output. Co-firing combustion<br />
efficiency still runs at about 33-37% (Bain, et. al., 2003).<br />
Because of the depreciation of existing plants and their connections to existing infrastructure,<br />
like water, sewer, roads, rail, and the electric grid, it is much cheaper to convert an existing fossil-<br />
Page 68<br />
Identifying Effective <strong>Biomass</strong> Strategies:<br />
Quantifying Minnesota’s Resources and Evaluating Future Opportunities
fuel plant to co-fire biomass than it is to build a new biomass plant out of the box. Not only does<br />
co-firing allow coal plants to get into the biomass energy business at low capital costs, it also<br />
improves their emissions by reducing CO2 and other pollutants. On the other hand, biomassonly<br />
plants eliminate fossil fuels altogether.<br />
Adapting a coal plant to co-fire biomass usually requires only minor modifications. If the fuels to<br />
be co-fired have similar characteristics, like chunk wood for a coal stoker plant, or sawdust for a<br />
coal suspension burner, and the biomass is a small fraction of total fuel, both can run through<br />
the same fuel handling equipment. But if biomass becomes more than a small percentage of<br />
total fuel, or if the physical properties of the co-fired fuels differ significantly, the plant will need<br />
dedicated biomass handling and processing equipment. In such cases, co-fired fuels don’t<br />
meet until they reach the boiler or combustion turbine.<br />
Some challenges and limitations that arise from co-firing biomass fuels with hydrocarbons are:<br />
• Intermingling of ash. Plants that burn just one type of fuel can earn income from the sale<br />
of ash. Coal fly ash is an additive to cement; biomass ash is a soil amendment. Blending<br />
the two renders them unusable for either application and sends them to landfills instead<br />
of to paying customers.<br />
• Slagging. The tendency for deposits to form in boilers or combustion turbines varies<br />
considerably depending on the fuels used and their interactions in combustion.<br />
• Deterioration of catalytic reduction (SCR) emissions control equipment. Since SCR<br />
catalysts can become ineffective when exposed to high-alkaline fuels, SCR<br />
manufacturers may void warranties in cases of co-firing (European Commission, 2000.)<br />
• Limitations of the existing plant’s design. An exhaust system provides a good example of<br />
the kind of imbalance that can be created by co-firing biomass. Because biomass fuels<br />
have a lower ratio of energy-to-mass than hydrocarbons, biomass fuels give off greater<br />
volumes of flue gasses – probably more than the plant was designed to handle. The cost<br />
of rebuilding an exhaust system may make co-firing financially unfeasible.<br />
Preparing Solid <strong>Biomass</strong> Fuel for Co-Firing<br />
The two basic ways to process biomass fuel for combustion in general, drying and sizing, were<br />
described in a preceding chapter on handling. Here we review their implications for co-firing.<br />
Drying. We have discussed drying as a way to reduce degradation and shipping weight of<br />
biomass, but it has no bearing on preparation of fuel for co-firing. According to a recent<br />
evaluation of the bio-power industry, drying is not necessary for co-firing because:<br />
• The gain in fuel efficiency doesn’t justify its cost.<br />
• Industrial wastes that fuel most co-firing operations usually are fairly dry to begin with<br />
(between 6 and 28% moisture content by weight).<br />
• <strong>Biomass</strong> is only a small percentage of the total fuel used (Bain, et. al., 2003).<br />
Sizing. When the percentage of co-fired biomass is low (
Table VI-1: Fuel Size Requirements by Combustion Type<br />
Boiler Type<br />
Fuel Size<br />
Required<br />
(inches)<br />
Pulverized coal ≤ ¼<br />
Stoker ≤ 3<br />
Cyclone<br />
≤ ½<br />
Fluidized bed ≤ 3<br />
(FEMP, 2004)<br />
Examples of Co-Firing in Minnesota<br />
According to the eGRID database published by the Environmental Protection Agency, ten<br />
baseload power plants in Minnesota burn coal to generate electricity. Studies show that, with a<br />
few modifications to its boiler and fuel handling equipment, a coal-fired power plant of an<br />
appropriate design can co-fire up to 5% biomass without any problems. If all ten plants<br />
converted to co-firing at that level, they could produce 260 MW, or 1.5 million MWh, of baseload<br />
biomass power annually (2.4% of Minnesota’s annual retail electric sales) from 1.1 million tons of<br />
biomass.<br />
Alan S. King plant, Oak Park Heights. At least one Minnesota power plant has successfully cofired<br />
biomass (in this case wood waste) with coal. From 1988 until 1998, the Allen S. King power<br />
plant in Stillwater co-fired 3 to 5% sawdust and sander dust mixed with coal.<br />
The King plant no longer co-fires sawdust, a fact that illustrates the contingent nature of biomass<br />
energy economics. Co-firing presented no technical problem. The boilers at the King plant<br />
were well suited to burn sawdust because they were designed for pulverized coal in suspension.<br />
Handling wasn’t a problem, either, because the sawdust would literally blow in, dry, through a<br />
pneumatic pipe from a large supplier that happened to be next door, Andersen Window.<br />
Andersen reworked its dust collection system to separate pure sawdust from plastic<br />
contaminants that would give off corrosive chlorides, and it paid for the blowline so it could<br />
capture its waste’s value as energy through a favorable contract with NSP subsidiary NRG, the<br />
operator of the power plant.<br />
The arrangement seemed like a marriage made in heaven, but it ended in divorce in 1998<br />
because sawdust had become more valuable as animal bedding than it was as boiler fuel. Like<br />
any other fuel, biomass is subject to price swings. But unlike most other fuels, biomass prices can<br />
swing because of factors having nothing to do with energy.<br />
District <strong>Energy</strong>, St. Paul. District <strong>Energy</strong>’s central heating and power plant operates four gas/oilfired<br />
boilers, two boilers co-firing gas and coal, a fuel-oil backup plant and mobile boiler, which<br />
together generate a combined total of 289 megawatts of thermal energy (987 million BTU per<br />
hour) and drive an 860-kilowatt turbine generating electricity for internal needs. Since it installed<br />
wood-burning capacity in 2003, District <strong>Energy</strong> has increased its use of woody biomass until it has<br />
become more than 80% of its total fuel. The wood comes from tree removals and trimmings in<br />
the metropolitan area. (For more details, see the full account in the following section on CHP<br />
applications.)<br />
Page 70<br />
Identifying Effective <strong>Biomass</strong> Strategies:<br />
Quantifying Minnesota’s Resources and Evaluating Future Opportunities
Co-Firing Gasified or Liquefied <strong>Biomass</strong><br />
Co-firing solid biomass with coal may cost less, but converting biomass to a liquid or gas fuel for<br />
co-firing offers important benefits:<br />
• It separates streams of residual fly ash that can be sold rather than landfilled;<br />
• It can generate high-value byproducts.<br />
New technologies for turning biomass into liquid and gaseous fuels have multiplied the number<br />
of ways it can be co-fired with other fuels. If cleaned by well known chemical processes, biogas,<br />
bio-oil and bio-diesel can drive combined-cycle turbines without fouling. They also can<br />
add energy to combined-cycle facilities during down cycles when the turbine isn’t running. In<br />
processes other than fueling turbines, biogas doesn’t even have to be cleaned.<br />
Liquid and gaseous biomass fuels also can be co-fired with other fuels in internal combustion<br />
applications like diesel-fueled gensets and Stirling engines. Blends up to B20 (20% bio-diesel)<br />
don’t detract from engine performance. Liquid and gaseous biomass fuels also can be co-fired<br />
with coal or other fossil fuels in boilers. One innovative design proposes to combine a biomass<br />
gasifier with a stoker boiler to burn bark and syngas and generate steam. Recovered heat from<br />
the gasifier and boiler would preheat air for two gas-fired, externally-recuperated gas turbines<br />
generating electricity. This configuration would reduce consumption of fossil fuel, cut emissions<br />
of NOx, and increase energy production. (Bryan, Rabovitser, Ghose, and Patel, 2003)<br />
COMBINED HEAT AND POWER (CHP)<br />
By definition, co-firing refers to the practice of mixing bio-fuels with other fuels. Combined Heat<br />
and Power (CHP), on the other hand, may not involve biomass fuel at all. It refers not to the fuels<br />
that create energy but to the way a facility employs energy. Combined heat and power, or cogeneration,<br />
captures some of the heat left over after electric generation to meet thermal<br />
requirements (ie. space heating, district heating, process heat and steam, etc.). By capturing<br />
steam for further uses, a CHP system dramatically increases its overall efficiency.<br />
Some CHP plants, like those in paper mills, may use biomass, and others, like municipal power<br />
plants, seldom do. But biomass may come to play a larger role in all CHP plants in the future.<br />
<strong>Biomass</strong> Co-Generation in Industrial Plants<br />
In the energy crisis of the 1970’s, some planners envisioned dedicated stand-alone facilities,<br />
sometimes called “central stations,” built for the specific purpose of converting biomass to<br />
electric energy. During that time, California led the nation in developing such stand-alone<br />
plants by offering subsidies to developers of biomass generation. By the early 1990s, utilities and<br />
investors banking on subsidies had built 61 biomass plants in California.<br />
When the state withdrew those subsidies, leaving biomass plants to compete head to head<br />
against fossil fuel plants, many of them shut down. By 2004, 29 of California’s original 61 biomass<br />
plants had been idled, dismantled, or converted to natural gas. Most shuttered plants were<br />
stand-alones built by investors and power companies. Most survivors are adjuncts of<br />
manufacturing plants, like lumber mills.<br />
Co-generation plants survived because they have lower costs than stand-alone plants. Their<br />
operating costs are lower because they use manufacturing or processing wastes as fuel,<br />
avoiding the costs of waste disposal and power purchases. Furthermore, since they are adjuncts<br />
Identifying Effective <strong>Biomass</strong> Strategies: Page 71<br />
Quantifying Minnesota’s Resources and Evaluating Future Opportunities
of plants that make profits in other ways, co-generation plants don’t have to carry the full<br />
financial load of their enterprises.<br />
Capital costs are lower, too, because co-generation takes advantage of existing infrastructures,<br />
like:<br />
• An existing site.<br />
• Management and workforce.<br />
• Electrical substations and transmission lines.<br />
• Roads and transportation.<br />
• Supply chains, like loggers or farmers.<br />
• Ability to buy additional biomass fuels, like timber slash, thinnings, wheat straw, or corn<br />
stover, from those same suppliers.<br />
• Water and sewer connections and back-up or start-up fuels.<br />
• A large internal power customer.<br />
Sources of Renewable <strong>Energy</strong> and Fuels for <strong>Biomass</strong><br />
Because so many U.S. timber and crop processors co-generate power from organic wastes,<br />
biomass ranks second only to hydro among renewable fuels for power.<br />
Table VI-2: United States Renewable <strong>Energy</strong> Generating Capacity<br />
Renewable<br />
Resources<br />
Hydro<br />
<strong>Biomass</strong><br />
Wind<br />
Geothermal<br />
Solar thermal<br />
Photovoltaic<br />
Total, 2002<br />
(NREL, 2006)<br />
Generating Capacity<br />
(MW)<br />
93,445 MW<br />
11,869 MW<br />
5,078 MW<br />
2,079 MW<br />
354 MW<br />
58 MW<br />
112,883 MW<br />
Among biomass fuels, timber residues predominate.<br />
Table VI-3: MW of Generating Capacity from U.S. <strong>Biomass</strong> Resources<br />
<strong>Biomass</strong><br />
Resources<br />
Timber residues<br />
Municipal solid waste<br />
Biogas<br />
Agricultural residues<br />
Landfill gas<br />
Total 2002 U.S. biomass capacity<br />
(NREL, 2006)<br />
Generating<br />
Capacity (MW)<br />
7,497 MW<br />
2,970 MW<br />
880 MW<br />
373 MW<br />
150 MW<br />
11,870 MW<br />
Underlying the figures above are several important points. The first is that existing biomass power<br />
generation is overwhelmingly a byproduct of manufacturing. Of those 7,497 MWs of capacity<br />
for timber residues, only 245 belong to utilities owned by the federal government, cooperatives,<br />
municipalities, or investors or public authorities. The remaining 7,252 MWs are tied to<br />
manufacturing plants, mostly pulp and paper mills. Since virtually all plants burning timber<br />
Page 72<br />
Identifying Effective <strong>Biomass</strong> Strategies:<br />
Quantifying Minnesota’s Resources and Evaluating Future Opportunities
esidues leave energy on the table by using inefficient technologies, their power output could<br />
grow significantly by using newer systems.<br />
The second point is that industries processing crops instead of wood generate very little biomass<br />
power from their wastes. In 2002, agricultural residues accounted for only 373 MWs of capacity.<br />
That quantity may soon increase, however. The rapid growth of ethanol and biodiesel has set<br />
the stage for more co-generation with agricultural biomass in bio-fuels plants. Fortuitously, just as<br />
ethanol and bio-diesel are coming of age, advanced energy technologies also being<br />
perfected.<br />
<strong>Biomass</strong> Co-Generation in Minnesota<br />
Unlike California, Minnesota never developed a fleet of stand-alone biomass plants. Most of<br />
Minnesota’s biomass power is generated, as it always has been, in manufacturing plants. The<br />
largest of these are five pulp and paper mills. They are old, well established contributors to<br />
northern Minnesota’s economy, but not to the electric grid.<br />
Minnesota’s ethanol plants, on the other hand, are relative newcomers to the state. The oldest<br />
one dates from the 1990s. Ethanol has brought new income – but not new electricity – to<br />
farmers and rural communities in southern and central Minnesota.<br />
A third Minnesota industry, municipal power, resembles the model of a stand-alone power plant<br />
in that it buys fuel rather than tapping an internal waste stream. But municipal plants usually cogenerate<br />
power as as an adjunct of their established facilities. District <strong>Energy</strong> St. Paul, for<br />
example, built America’s largest municipal biomass CHP plant by adding a large wood-fired<br />
boiler to its existing district heating system. Recently, a joint powers authority of the Iron Range<br />
cities of Virginia and Hibbing added wood-fired boilers to their existing municipal CHP plants. In<br />
addition to providing power to their own cities, all three municipal plants sell electricity to <strong>Xcel</strong><br />
<strong>Energy</strong>.<br />
Those three industries, paper, ethanol and municipal CHP, may provide a larger share of<br />
Minnesota’s electrical energy in the future. But so far, ethanol is the only one making a start in<br />
advanced, high efficiency technologies. We’ll review those three industries in their global,<br />
national and Minnesota contexts and then focus on specific Minnesota plants that already have<br />
developed biomass power or that show the potential to do so.<br />
THE U.S. PULP AND PAPER INDUSTRY<br />
Because the paper industry is global in scope, we can understand Minnesota’s industry best in its<br />
larger setting. The paper industry is one of the largest industrial consumers of electricity in the<br />
U.S., satisfying some of its huge needs internally by burning biomass in the form of bark, wood<br />
and pulping wastes, and supplementing that with power purchased from the grid. At present,<br />
generators in pulp and paper mills only displace power from the grid; they very rarely export it to<br />
the grid.<br />
Although they collectively represent a huge block of biomass power capacity in the United<br />
States, present-day pulp and paper mills offer few, if any, examples of advanced energy<br />
technologies. They rely on simple, reliable, robust direct-combustion boilers to burn rough,<br />
unprepared and undifferentiated wood wastes in a wide range of particle sizes, moistures, and<br />
BTU contents. In an industry whose huge capital investments -- often more than $1 billion per mill<br />
– dictate 24/7 operation, reliability trumps efficiency. Pulp and paper mill managers don’t want<br />
Identifying Effective <strong>Biomass</strong> Strategies: Page 73<br />
Quantifying Minnesota’s Resources and Evaluating Future Opportunities
to experiment, especially since they view boiler/generator systems as waste disposals as much<br />
as power sources.<br />
Wood nevertheless is the favored fuel of the paper industry. Mills usually back it up with natural<br />
gas, oil, coal, or some combination thereof – the mix varies from season to season and year to<br />
year – but wood waste always is preferred because of its low cost. Since the alternative to<br />
burning waste is hauling it to an expensive landfill, wood actually enters the boiler at a negative<br />
value. As disposal costs increase and fossil fuels become more expensive, the gap between the<br />
two grows. So mills use backup fuels only when wood wastes run low.<br />
By burning wood wastes backed up by or blended with fossil fuels, some mills have become<br />
nearly self-sufficient in electrical energy. For example: Sappi’s mill in Cloquet buys only a few<br />
percent of its electric power; a Domtar mill in Arkansas with its own generating capacity of 100<br />
MW purchases only 13.8 MW; a GP mill in Georgia with a capacity of 83 MW buys 6.8 MW; a<br />
Temple Inland mill in Louisiana with a capacity of 96 MW buys 10 MW; and a MeadWestvaco mill<br />
in Maryland with a capacity of 65 MW buys 8.8 MW (RISI, 2006).<br />
Challenges Facing the U.S. Paper Industry<br />
Considering how much power pulp mills already produce using traditional technologies, one<br />
can imagine how much more they could produce with newer, more efficient technologies. But<br />
at the moment, the U.S. pulp and paper industry is confronting distracting economic challenges.<br />
Some of those longstanding challenges are:<br />
• The cyclicality of a commodity industry;<br />
• Chronic overcapacity;<br />
• Fierce price pressures;<br />
• The highest production costs in the world; and<br />
• An industry-wide scramble to consolidate strong mills and shutter weak ones.<br />
Globalization has brought new challenges:<br />
• New international competitors that exacerbate global overcapacity;<br />
• New competitors located within fast-growing Asian markets;<br />
• The loss of U.S. customers, especially in packaging papers, because of off-shore<br />
manufacturing;<br />
• Lower costs of labor and timber in developing countries;<br />
• More efficient equipment in new foreign mills;<br />
• Dependency on ever-more-costly foreign oil; and<br />
• The transfer of domestic mill ownerships to global corporations.<br />
Other new challenges emerge from environmental concerns:<br />
• The need to reduce greenhouse gas emissions;<br />
• Timber set-asides that make pulpwood scarce and expensive;<br />
• The fragmentation of timberlands into small private ownerships;<br />
• Sustainable harvest guidelines; and<br />
• More stringent emissions regulations.<br />
These challenges are taking their toll on the American paper industry. Over the past decade,<br />
more than 100 mills – mostly old, small, inefficient ones located in the northeastern U.S. – have<br />
shut down. More are expected to follow. Many mills still operating have changed hands, some<br />
of them several times.<br />
Page 74<br />
Identifying Effective <strong>Biomass</strong> Strategies:<br />
Quantifying Minnesota’s Resources and Evaluating Future Opportunities
The industry’s most strenuous challenge, however, comes from Wall Street. Investors consider the<br />
paper industry a poor performer relative to its huge capital assets in timberlands and mills.<br />
Faced with shareholder demands to liquidate assets, paper companies have had to choose the<br />
real estate business or the manufacturing business and so a great round of selling off timberland<br />
and plants is under way. Some companies, like Potlatch – formerly Minnesota’s largest forest<br />
products manufacturer – have sold mills and become real estate investment trusts. Others are<br />
doing the opposite: selling timberland and buying mills. Others are selling both. International<br />
Paper, the country’s largest paper company, sold its Minnesota mill and two Wisconsin mills in<br />
June, 2006, along with 12,000 acres of Minnesota land planted in hybrid poplars. The former<br />
owner of a mill in International Falls, Boise Cascade, left the paper industry altogether and<br />
bought the retail chain Office Max.<br />
<strong>Biomass</strong> Power in Pulp Mills<br />
Pulp mills fall into two distinct categories: chemical (or kraft) or mechanical (or groundwood).<br />
Chemical mills use a chemical process to separate cellulose for paper from lignin, the organic<br />
glue that holds wood fibers together. The lignin-rich liquid residue of the pulping process, “black<br />
liquor,” is burned in recovery boilers (sometimes called Tomlinson boilers) to make steam and<br />
retrieve pulping chemicals for re-use. Steam from these recovery boilers is expanded through<br />
turbines to generate electricity before it is piped on to serve mill processes.<br />
Recovery boilers in chemical mills currently used have low thermal efficiencies of just over 10%.<br />
Research into black liquor gasification techniques has produced new technologies that raise<br />
thermal efficiencies to 20 to 30%, and gasification also can recover processing chemicals more<br />
efficiently.<br />
Mechanical mills differ from chemical mills in that they don’t separate lignin from pulp. Rather,<br />
they defibrate wood mechanically by steaming and grinding it. Some mills add chemicals in a<br />
thermo-chemical-mechanical-pulping process (TCMP), but that isn’t to be confused with<br />
chemical (or kraft) pulping. Unlike chemical mills, even TCMP mechanical mills leave lignin in the<br />
wood. Therefore they don’t produce black liquor to use as fuel.<br />
Chemical and mechanical mills are alike, however, in their treatment of bark and wood wastes.<br />
They burn them in simple direct-combustion boilers to make steam for plant processes and<br />
turbine generators.<br />
Potential for Increased Power Generation in Pulp and Paper Mills<br />
The problems of the paper industry may discourage some companies from making large<br />
investments in new energy technologies, but on the other hand they may drive some<br />
companies to exploit them. Some paper companies reportedly are studying new energy<br />
technologies, like fluidized-bed combustion, gasification, and biorefining, that could transform<br />
mills from net importers of electricity into net exporters. With biorefining or cellulosic<br />
technologies, they could even make transport fuels from their wastes. There are technology<br />
companies seeking partnerships with paper mills to do exactly that.<br />
The time is right. Simple direct combustion boilers burning black liquor and wood wastes have<br />
proven to be reliable and durable for many decades, but their time is running out. 67 boilers<br />
currently operating in American pulp and paper mills were built before 1960, eight of them<br />
before 1931 (NREL, 2006). Those old boilers now are reaching retirement age. The majority of<br />
recovery boilers will end their 30- to 40-year lifetimes over the next 10 to 20 years, and many<br />
wood waste boilers are older than that. As boilers age and power costs increase, mills have<br />
Identifying Effective <strong>Biomass</strong> Strategies: Page 75<br />
Quantifying Minnesota’s Resources and Evaluating Future Opportunities
oth the opportunity and the motive to install systems that extract more energy from wood<br />
waste (Larson, Consomi, and Katosfky, 2003).<br />
The economics of paper making will drive it to increased energy efficiency. Purchased power is<br />
a major cost for pulp and paper mills. It accounts for as much as 20% of their cost of goods sold,<br />
about the same as the timber that forms the product itself. An investment in an efficient power<br />
system is likely to pay for itself quickly.<br />
Research to Turn Pulp and Paper Mills into Power Plants<br />
Collaboration among the U.S. Department of <strong>Energy</strong>, research universities, and industry<br />
laboratories has led to the development of several biomass gasification techniques that now are<br />
near commercialization. Several of these technologies have undergone two or more years of<br />
full scale commercial testing and are ready for wider adoption.<br />
A number of studies have evaluated the potential impact of new energy technologies on the<br />
financial performance of pulp and paper mills. An important Agenda 2020 paper, sponsored by<br />
the paper industry calculates that a hypothetical mill now importing 36 MW to meet its electricity<br />
needs could export 15-22 MW by using a mill-scale Black Liquor Gasification-Combined Cycle<br />
(BLGCC) system, with no increase in the volume of black liquor it processes (Larson, 2003). In<br />
short, by using a gasifier, a pulp mill could turn electricity from an expense into a revenue stream.<br />
The next step, adding a larger gas turbine co-firing natural gas with syngas made from black<br />
liquor (this would require the purchase of additional wood waste like harvest residues), would<br />
increase the mill’s power exports to 126 MW, enough to make it small utility-scale power plant.<br />
The implications of biomass technologies extend far beyond the economics of the mills<br />
themselves. They presage an era of national energy independence. Sweden hopes to reach<br />
that goal by 2030. A Swedish engineer, Ingvar Landalv, visited Minnesota several times in 2005 to<br />
talk about a $30 million pilot plant his firm, Chemrec, has built for the Swedish government. It is a<br />
biorefinery attached to a chemical pulp mill’s recovery boiler to produce liquid fuels. By 2030,<br />
Sweden plans to make all its liquid fuels in pulp mills and all its electricity in nuclear plants (as it<br />
largely does already). An American firm, Thermochem Recovery International, is working on a<br />
somewhat different biorefining technology with funding from the U.S. Department of <strong>Energy</strong>.<br />
Enzymic cellulosic processes also may a future role in using mill and forest wastes to make liquid<br />
fuels.<br />
Not every mill will adopt advanced energy technologies. Chemical paper mills probably will<br />
lead because of their high power consumption and valuable black liquor wate stream. The<br />
Upper Midwest will not benefit as greatly from this trend as the Southeastern United States, where<br />
two-thirds of the nation’s chemical pulping capacity resides. Chemical mills aside, however,<br />
more energy-efficient use of wood wastes could help any mill survive this difficult period of shutdowns<br />
and consolidations.<br />
Minnesota’s Pulp and Paper Industry<br />
Minnesota is home to eight paper mills. Two of them, Liberty Paper in Becker and Rock-Tenn in<br />
St. Paul, recycle paper and thus have no wood waste to burn. (They do remove contaminants,<br />
like adhesives and inks, that can be used in Refuse Derived Fuel (RDF), but that is not our<br />
subject.) Another paper mill, Wausau Paper in Brainerd, also does not generate wood waste<br />
because it buys all of its pulp. Three mechanical mills, UPM Blandin in Grand Rapids, Stora Enso<br />
in Duluth and International Paper in Sartell, do have wood waste to burn because they make<br />
Page 76<br />
Identifying Effective <strong>Biomass</strong> Strategies:<br />
Quantifying Minnesota’s Resources and Evaluating Future Opportunities
pulp from logs. Minnesota’s two chemical mills, Sappi in Cloquet and Boise in International Falls,<br />
burn black liquor in recovery boilers and wood waste in combustion boilers.<br />
Table VI-4: Minnesota's Five Papermills Burning Wood Residues to Generate Power<br />
Name Location Type Headquarters Primary Product<br />
Boise Paper Int‘l Falls Chemical Chicago Business papers<br />
Sappi Fine<br />
Paper<br />
Cloquet Chemical South Africa Coated publication paper<br />
Stora Enso Duluth Mechanical Finland Catalogue and insert paper<br />
UPM Blandin<br />
Grand<br />
Lightweight coated magazine<br />
Mechanical Finland<br />
Rapids<br />
paper<br />
Verso Sartell Mechanical Memphis<br />
Lightweight coated magazine<br />
paper<br />
Opportunities to Increase Power in Minnesota Mills<br />
As the headquarters listed in the above table show, Minnesota mills are part of a global industry.<br />
Therefore owners of Minnesota’s mills make investments based on global strategies, not local<br />
loyalties; they send their capital to any point on the globe where they find financial advantage.<br />
Stora Enso, for example, the Finnish owner of Duluth’s super-calendered papermill, recently<br />
announced it will build the world’s largest pulp mill in Chile. And Stora Enso’s Duluth mill has<br />
to compete for investment capital against sister mills around the world.<br />
Minnesota’s Chemical Paper Mills<br />
Because mills vary in engineering design, financial circumstances and business strategies,<br />
specific prospects for biomass power investments can be identified only on a case-by-case<br />
basis. Sappi and Boise Cascade, Minnesota’s only chemical mills and therefore our only<br />
candidates to gasify and/or biorefine black liquor, exhibit basic differences.<br />
Sappi Fine Paper, Cloquet. Sappi’s pulp mill is more modern than its paper mill. In the 1990s, the<br />
pulp mill’s former owner, Potlatch, invested more than $500 million to rebuild it. Potlatch later<br />
sold the pulp mill and its adjoining paper mill to Sappi North America. Sappi’s president,<br />
Kathleen Walters, called the pulp mill the “jewel” that attracted her to the deal.<br />
One of the most modern pulp mills in the U.S., Sappi Cloquet has made itself nearly self-sufficient<br />
in energy. The huge investments that already have been made in the mill make it unlikely that<br />
the company would install new technologies. But the energy landscape is changing quickly,<br />
and since Sappi does a lot of business in Europe, where modern gasification was first developed,<br />
the company must be aware of its potential.<br />
Boise Cascade, International Falls. Boise’s mill is the opposite of Sappi’s – a modern paper mill<br />
linked to an old pulp mill. Two of Boise’s five boilers were installed in 1927, and the other three<br />
date from 1947, 1948 and 1957. Three burn natural gas, one burns bark and wood waste, and<br />
the fifth, a recovery boiler, burns black liquor. The recovery boiler received a $30 million<br />
refurbishing in 2002, but its basic technology remains traditional. The papermaking side of the<br />
mill, on the other hand, was modernized in 1990 with a huge new $1 billion paper machine<br />
which at the time was the fastest in the world.<br />
The corporation once called Boise Cascade, then just Boise, and now Office Max, sold the mill to<br />
Madison Dearborn, a Chicago investment group, in 2004. The new owners restored its original<br />
name of Boise. It’s hard to divine whether the new owners will want make major new<br />
Identifying Effective <strong>Biomass</strong> Strategies: Page 77<br />
Quantifying Minnesota’s Resources and Evaluating Future Opportunities
investments, but the old boilers probably need updating. Perhaps a partnership of the City of<br />
International Falls and Boise Cascade could build a gasifier to generate more power and help<br />
the city dispose of municipal solid waste, a hard thing to do in an area with a very high water<br />
table.<br />
Minnesota’s Mechanical Pulp and Paper Mills<br />
Since mechanical mills don’t produce black liquor, their biomass fuel is limited to bark and wood<br />
waste stripped from pulpwood feedstock. Mill sludge, a wet “fuel” containing 50-60% moisture<br />
even after dewatering, might also be burned, although that is done more to avoid landfill than<br />
to produce power. Some plants supplement mill wastes with harvest residues (limbs, tops, and<br />
unmerchantable wood), providing extra income to loggers while avoiding the high costs of fossil<br />
fuels. (see “Laurentian <strong>Energy</strong> in Hibbing and Virginia,” below).<br />
UPM Blandin/Rapids <strong>Energy</strong> Center, Grand Rapids. Blandin provides a good example of power<br />
company/ paper mill cooperation. Minnesota Power bought UPM Blandin’s internal power<br />
facilities consisting of two boilers co-firing wood and coal, two natural gas boilers, two steam<br />
generators and a small hydro turbine. The mill now buys steam and electricity from the power<br />
plant, which is called the Rapids <strong>Energy</strong> Center. On rare occasions when demand is very high<br />
and so are energy prices, the Center may sell to the grid a very small amount of power from the<br />
gas boilers, perhaps one-tenth of 1% of the plant’s output. At those times the <strong>Energy</strong> Center is a<br />
de facto peaking plant, and when it sells wood-fired power to the mill it is a base-load plant that<br />
serves one captive customer.<br />
Its partnership with Minnesota Power frees Blandin to do what it does best, make paper, and<br />
leave power plant operation to the utility. This could be the first step toward turning a paper mill<br />
into an exporting biomass power plant.<br />
Blandin recently announced an $800 million expansion with a large new paper machine that will<br />
increase the mill’s power demand. This might be an opportune moment for the power utility<br />
install more efficient equipment.<br />
Stora Enso, Duluth. The Stora Enso mill, which manufactures super-calendared paper for<br />
newspaper inserts, catalogues and magazines, provides another example of a utility/paper mill<br />
partnership. The pulp and paper mill originally began as a partnership between Minnesota<br />
Power, the City of Duluth, and Pentair, a holding company headquartered in Minnesota. Later,<br />
the partnership sold the mill to Wisconsin’s Consolidated Paper, which in turn sold its entire<br />
business to Stora Enso of Finland.<br />
The three founding partners, Pentair, Duluth, and Minnesota Power, combined several facilities<br />
to make up the power package. The paper mill was built from scratch, together with an<br />
adjacent de-inking mill owned by a consortium of paper companies. But the new mill did not<br />
have to include a boiler plant because the City of Duluth refitted two 1930s-vintage coal stoker<br />
boilers at its nearby Hibbard Power Station to co-fire wood waste with western coal. After<br />
Consolidated sold the mill to Stora Enso, Duluth continued to own the boilers, and Minnesota<br />
Power continues to operate them as “Duluth Steam District Number Two.”<br />
This cooperative arrangement spared the original partners the cost of a new boiler plant and<br />
turbine generator. Stora Enso sends its bark and waste wood, plus market chips and railroad-tie<br />
chips, to the boilers, and the Steam District generates power and steam for the mill.<br />
Page 78<br />
Identifying Effective <strong>Biomass</strong> Strategies:<br />
Quantifying Minnesota’s Resources and Evaluating Future Opportunities
The result has been satisfactory, if not ideal. The boilers occasionally break down, and wood fuel<br />
occasionally forms clumps on the grate which call for a blast of extra combustion air from<br />
below. Slagging, however, has not been a problem.<br />
The paper mill would like to see the boilers replaced eventually, but its immediate priority is a<br />
system to dry and burn the 150 tons of mill sludge it sends each day to landfill. Longer term,<br />
Stora Enso’s partnership with Minnesota Power could lead eventually to higher and better uses<br />
of waste biomass.<br />
Verso Paper, Sartell. A former owner of this mechanical mill, Champion, embarked in 1990 on an<br />
ambitious program. It would lease or purchase 22,000 acres of farmland to raise hybrid poplars<br />
that reach harvest size in ten years. Each year, one-tenth of the acreage would be planted. On<br />
the eleventh year, the first tenth would be harvested and the hybrids would begin to<br />
regenerate. The year after that, the second year’s planting would be harvested, and so on<br />
through the ten-year cycle when the first stand again would be ready to harvest.<br />
This plan was strategic for several reasons. Champion’s self-sufficiency in hardwood would<br />
insulate it from the volatility of aspen prices. (Aspen is half the mill’s furnish. The other half is<br />
softwoods which the mill would continue to purchase). By controlling more of its supply, the<br />
corporation would raise its stock price, and waste from the hybrid harvests could become<br />
biomass fuel.<br />
That plan has been somewhat revised by successive changes of ownership. In 2000, Champion<br />
sold the Sartell mill to International Paper (IP), which put the hybrid poplar program on hold. IP<br />
then resold the mill in June, 2006, to CMP Holdings LLC, a holding company which purchased<br />
three other mills to form a new paper company called Verso. The sale included the 12,000 acres<br />
of hybrids that Champion had planted, and Verso will begin to harvest that next year.<br />
The Sartell mill has a lot of room for more electric generation. Of its three boilers, the largest cofires<br />
combinations of bark and wood waste, stoker coal, and dewatered paper mill sludge at 50-<br />
60% moisture content. The second burns natural gas, and the third burns coal. The plant<br />
consumes all its capacity of 22 MW.<br />
Rock Tenn/The City of St. Paul/Ramsey County. Like Stora Enso in Duluth, Rock Tenn may enter<br />
into a partnership between a paper mill and a municipality, but at this writing that is still in the<br />
talking stages. A recycling paperboard mill with no wood residues to burn, Rock Tenn long has<br />
bought process and power-generating steam through a pipe from <strong>Xcel</strong> <strong>Energy</strong>’s High Bridge<br />
power plant. But that arrangement ends in mid-2007 when the <strong>Xcel</strong> <strong>Energy</strong> plant converts to<br />
natural gas. Rock Tenn’s continued operation depends on finding a new steam source. For the<br />
short term, it will get by with an existing oil-fired boiler. But expensive fuel oil is only a stopgap<br />
until something more economical can installed.<br />
For the long term, Rock-Tenn’s engineers considered first an on-site biomass power plant burning<br />
agricultural wastes. The Minnesota Department of Employment and Economic Development<br />
called on the Agricultural Utilization Research Institute to consult. But the high landed cost of<br />
agricultural wastes, along with the logistical and permitting problems in using them in the center<br />
of a large metropolitan area, made that idea unworkable.<br />
Then discussions among company, state, city, Port Authority and county officials led to the idea<br />
of an RDF gasification plant. The Green Institute recently completed a study investigating the<br />
possibility of using biomass at the plant (Nelson, 2007).<br />
Identifying Effective <strong>Biomass</strong> Strategies: Page 79<br />
Quantifying Minnesota’s Resources and Evaluating Future Opportunities
The fate of the paper mill has yet to be settled, but the effort to save it displays the kind of<br />
cooperative effort needed to move biomass projects forward.<br />
Table VI-5: Boilers in Forest Products Plants or Municipal CHP Plants in Minnesota<br />
Plant Name Utility City Year Unit(s) Capacity<br />
Operational<br />
(kW)<br />
Blandin Paper Blandin Paper Co. Grand Rapids 1969 1 15,000<br />
Blandin Paper Blandin Paper Co. Grand Rapids 1980 2 16,500<br />
Boise Cascade Boise Cascade Corp. International Falls 1927 1 4,000<br />
Boise Cascade Boise Cascade Corp. International Falls 1927 2 4,000<br />
Boise Cascade Boise Cascade Corp. International Falls 1948 3 7,500<br />
Boise Cascade Boise Cascade Corp. International Falls 1947 4 7,500<br />
Boise Cascade Boise Cascade Corp. International Falls 1957 5 6,300<br />
Verso Paper Verso Paper Sartell 1982 3 24,000<br />
Sappi Fine Paper Sappi North America Cloquet 1976 1 21,400<br />
Sappi Fine Paper Sappi North America Cloquet 1997 2 40,000<br />
Hibbard, M.L. Minnesota Power Duluth 1949 3 3,300<br />
Hibbard, M.L. Minnesota Power Duluth 1951 4 3,750<br />
Ainsworth Corporation Potlatch Corporation Bemidji 1992 1 12,500<br />
St. Paul District <strong>Energy</strong> St. Paul District <strong>Energy</strong> St. Paul 2002 1 25,000<br />
Laurentian <strong>Energy</strong><br />
Authority<br />
Hibbing And Virginia<br />
Public Utilities<br />
Hibbing And Virginia 2006 2<br />
15,000 -<br />
20,000<br />
Total Capacity (kW) 190,750<br />
From NREL’s Renewable Electric Plant Information System (REPiS), http://www.nrel.gov/analysis/repis/<br />
MINNESOTA’S ETHANOL INDUSTRY<br />
Within the past twenty years, Minnesota has become home to 16 ethanol and 3 biodiesel plants<br />
that together produce 620 million gallons of biofuel (551 million gallons of ethanol and 69 million<br />
gallons of biodiesel). Development of new plants is accelerating, and their capacities are<br />
skyrocketing. Early plants might produce 20 million gallons per year. Today, 150-million-gallon<br />
plants have been built. Older plants were dominated by local farmers’ co-ops, but now Wall<br />
Street, large agribusinesses like ADM and Cargill, and even a few petroleum companies have<br />
also entered the business.<br />
Page 80<br />
Identifying Effective <strong>Biomass</strong> Strategies:<br />
Quantifying Minnesota’s Resources and Evaluating Future Opportunities
City (plant name)<br />
Table VI-6: Ethanol Plants & Capacities<br />
Capacity<br />
Million<br />
Gallons/year<br />
Million Bushels<br />
Corn/year<br />
Start-up<br />
year<br />
New Generation<br />
(Co-op Members)<br />
Marshall (ADM) 40 14.8 1988 (Public Corp)<br />
Morris (DENCO) 25 9.0 1991 Corporation<br />
Winnebago (Corn Plus) 47 17.4 1994 750<br />
Winthrop (Heartland) 100 37 1995 692<br />
Benson (CVEC) 46 17 1996 850<br />
Claremont (Al-Corn) 38 12.6 1996 354<br />
Bingham Lake (Ethanol2000) 35 13 1997 241<br />
Buffalo Lake (MN <strong>Energy</strong>) 19 7.0 1997 325<br />
Melrose (Dairy Proteins) 3.0 Cheese whey 1986 (Regional Coop)<br />
Preston (Pro-Corn) 42 16 1998 159<br />
Luverne (Corn-er Stone) 22 8 1998 197<br />
Little Falls (CMEC) 22 8.1 1999 820<br />
Albert Lea (Exol/Agri Resources) 41 15.2 1999 496<br />
Lake Crystal 54 20 2005 Private LLC<br />
(Granite Falls <strong>Energy</strong>) 48 18 2005 LLC<br />
Atwater (Bushmills Ethanol) 48 18 2005 LLC<br />
TOTAL 619 230 4,880 members<br />
(DOA, 2007, updated May 2007)<br />
Figure VI-1: Map of Minnesota's Ethanol and Bio-Diesel Plants<br />
Identifying Effective <strong>Biomass</strong> Strategies: Page 81<br />
Quantifying Minnesota’s Resources and Evaluating Future Opportunities
Ethanol has been hailed as a move toward energy independence, which is an important<br />
geopolitical goal. But from an environmental standpoint, ethanol is a paradox: a renewable<br />
biomass fuel that replaces one fossil fuel, petroleum, by using two other fossil fuels, natural gas<br />
and coal in the form of electricity. These are American fossil fuels rather than Middle Eastern<br />
fossil fuels, but they are fossil fuels nonetheless.<br />
Some critics argue that making ethanol takes as much energy as the finished product contains.<br />
Industry spokespersons counter that the ratio really is more like one unit of input energy to 1.3<br />
units of ethanol energy. However, it is clear that the most ethanol plants draw on fossil fuels from<br />
distant regions and neglect renewable biomass fuels that lie around the plants.<br />
Ethanol expansion will run into natural limitations at some point because even renewable<br />
resources are finite. Ethanol plants consume lots of water – four to six gallons of it per gallon of<br />
fuel produced. Lack of adequate groundwater already is limiting the development of ethanol<br />
plants in some areas of southwestern Minnesota. Another problem is the very select feedstock<br />
used to make ethanol. It is becoming difficult to site a new plant without overlapping another<br />
plant’s corn procurement area. Recent coverage of the industry suggests that if all of the<br />
ethanol plants seeking permits in Minnesota are built, they will consume more than 40% of the<br />
state’s corn crop (Webb, 2006). The food and feed industries are concerned that they are<br />
being priced out of their traditional markets by fuel producers.<br />
The ethanol industry will continue to expand, however, as it learns to conserve water, expand its<br />
raw material base with wastes like stover and straw by adopting cellulosic processes, and<br />
generate its own gas and electricity through gasification of agricultural biomass. Like paper<br />
mills, ethanol plants may even become power plants of the future, generating electricity not just<br />
for themselves but also for surrounding communities.<br />
<strong>Biomass</strong> <strong>Energy</strong> in Ethanol Plants<br />
The ethanol industry already is moving toward greater energy efficiency. Three Minnesota<br />
ethanol producers are working toward becoming self-sufficient in energy by installing new<br />
technologies. One is using a fluidized-bed boiler, one is using a gasifier, and another is planning<br />
to install one. The immediate goals for projects are reducing costs and meeting tougher<br />
environmental regulations. But there is a longer-term justification as well. If subsidies for ethanol<br />
production eventually decline or even disappear, these plants will be better prepared to<br />
compete head-on against other fuels.<br />
There is another potential benefit from investments that capture more energy through<br />
advanced technologies like gasification and biorefining. Once a plant becomes self-sufficient<br />
in electric power, exporting power is just one step further along the same path. At the moment,<br />
only one Minnesota ethanol plant is exporting power – Central Minnesota Ethanol Cooperative<br />
(CMEC), which sells all of one megawatt to <strong>Xcel</strong> <strong>Energy</strong>. Like most other ethanol plants<br />
considering gasification, CMEC’s primary interest is in substituting syngas for ever more expensive<br />
natural gas. That is an easy substitution because once it is cleaned, syngas burns well in an<br />
existing, unmodified natural gas boiler. In the future, a gasifier might fuel a turbine generator<br />
producing enough electricity to power the plant and sell to the grid besides. To get to that<br />
export stage, however, a plant will have to find additional sources of biomass fuel.<br />
Corn Plus Ethanol in Winnebago<br />
Corn Plus General Manager Keith Kor has taken several steps to make Corn Plus’ 44-milliongallon<br />
plant more energy-efficient, beginning with the installation of internal heat transfers that<br />
Page 82<br />
Identifying Effective <strong>Biomass</strong> Strategies:<br />
Quantifying Minnesota’s Resources and Evaluating Future Opportunities
cut energy consumption 10%. But his biggest energy-saving measure so far is a fluidized-bed<br />
boiler that burns an ethanol byproduct, syrup, to reduce his purchases of natural gas. Corn Plus,<br />
according to Kor, is the first company in the industry to adopt fluidized-bed technology. It has<br />
received a patent on its application in ethanol production.<br />
The fluidized bed boiler has raised the plant’s energy efficiency dramatically. Its ratio of outside<br />
energy inputs to product energy output is down to one-to-six, and natural gas consumption has<br />
dropped 55%. Kor now is working on a plan to make the plant completely independent of<br />
outside energy, but details are not public.<br />
Central Minnesota Ethanol Cooperative (CMEC) in Little Falls<br />
Kerry Nixon, General Manager of Central Minnesota Ethanol Coop, is taking a different route to<br />
energy independence. Working with engineer Cecil Massie, he has eliminated all natural gas<br />
purchases by installing a gasifier fueled by wood wastes – sawdust, slabs, shavings, off-fall and<br />
trimmings from loggers, sawmills and wood shops – available within a 20-mile radius of Little Falls.<br />
It’s ironic that an ethanol plant, not a paper mill or a lumber mill, is the first facility in Minnesota to<br />
gasify wood waste.<br />
Gasification has acquired a reputation for being finicky about fuel, but Massie says it can handle<br />
pretty much any kind of biomass as long as it contains less than 30% moisture. Slagging of silica<br />
in the wood supply has been a challenge, though. Besides wood, the gasifier is set up to run<br />
also on dried distillers grains (a byproduct of ethanol production), stover (corn stalks and leaves),<br />
or straw. Since stover and straw contain silica, too, more tweaking will be needed to resolve the<br />
slagging problem.<br />
Stricter EPA permitting requirements and higher costs of natural gas are driving CMEC’s project.<br />
The gasifier will enable the plant to meet lower VOC emissions levels without adding a thermal<br />
oxidizer, which would use more natural gas; avoid $3.5 million per year in natural gas costs; and<br />
co-generate about 30% of the mill’s electric load. The gasifier’s syngas also dries DDGs, and<br />
conversely, DDGs could fuel the gasifier if getting wood fuel became a problem. <strong>Xcel</strong> <strong>Energy</strong><br />
will purchase 1 MW from the mill, but the plant will purchase 3 MW from the grid. The plant also<br />
may sell steam to the city of Little Falls. Payback on the gasifier is estimated at three years.<br />
Chippewa Valley Ethanol Company (CVEC)/Frontline Bio<strong>Energy</strong>, LLC, Benson<br />
This is an important project not only in its own right, but also for the multiplier effect it might have<br />
throughout the ethanol industry. A Minnesota cooperative ethanol producer, CVEC, and an<br />
Iowa biomass gasification engineering firm, Frontline Bio<strong>Energy</strong>, have formed a joint venture to<br />
design and install a prototype gasification system in CVEC’s Benson plant to process biomass<br />
feedstocks like corn stover, distillers dried grains, corn, wheat straw and wood waste. The syngas<br />
produced will replace $20 million worth of natural gas annually.<br />
CVEC will pay the Iowa firm, Frontline, $3.4 million for research, $12.4 million for equipment, and<br />
$1 million for working capital. In return, Frontline will give CVEC an equity position in its company<br />
and licensing rights for a limited number of future installations in other plants. Both partners thus<br />
will have an incentive to spread gasification technology to as many other plants as they can.<br />
MUNICIPAL COMBINED HEAT AND POWER<br />
European countries, especially Denmark, provide many examples of CHP plants that gasify local<br />
biomass, like wood waste and crop wastes, to produce heat and power for small towns. Some<br />
Identifying Effective <strong>Biomass</strong> Strategies: Page 83<br />
Quantifying Minnesota’s Resources and Evaluating Future Opportunities
of those Danish plants are tiny, generating only a few MW of power and just enough heat to<br />
serve a few thousand residents. They show that biomass economics can work even in smallscale,<br />
distributed-energy applications.<br />
The real challenge in biomass CHP is not so much justifying the plant itself as it is justifying the<br />
heating pipes. Few small American cities have steam or hot water pipes in their streets, and<br />
larger cities are distant from biomass fuel and cannot easily handle it in an urban area.<br />
Fortunately, several Minnesota cities are exceptions.<br />
<strong>Biomass</strong> Municipal CHP Plants in Minnesota<br />
It would be difficult for most Minnesota cities to develop the kind of centralized combined heat<br />
and power (CHP) plants seen in Europe because, in a typical sprawling U.S. city, the costs of<br />
installing underground pipes and the line losses they would suffer are daunting. Therefore CHP<br />
plants usually appear in cities that already have municipal district heating systems and/or high<br />
population densities, things rarely found in American communities.<br />
Minnesota does, however, contain some communities with CHP plants using wood wastes for<br />
fuel in pre-existent municipal systems: St. Paul, Virginia and Hibbing. Minneapolis has district<br />
heating in its downtown, but it burns natural gas for fuel and doesn’t generate power.<br />
District <strong>Energy</strong> in St. Paul<br />
District <strong>Energy</strong>, an independent, non-profit CHP plant located on West Kellogg Boulevard in<br />
downtown St. Paul, is the largest of its type in the U.S. It provides heat to more than 170 buildings<br />
and 300 single-family homes, including the Capitol Complex, Empire Builder Industrial Park, West<br />
Side Flats and the Phalen Corridor. That adds up to more than 29 million square feet of building<br />
space occupying 80% of St. Paul’s central business district and surrounding areas.<br />
District <strong>Energy</strong> pumps hot water through 97,600 feet of pipes to buildings equipped with heat<br />
exchangers that can transfer the heat into their own internal systems. After it gives off its heat,<br />
the water returns to District <strong>Energy</strong>’s main plant to be reheated and recirculated.<br />
The plant operates four gas/oil-fired boilers, two coal/gas-fired boilers, a fuel-oil backup plant<br />
and mobile boiler, which generate a combined total of 289 megawatts of thermal energy (987<br />
million BTU per hour) and drive an 860-kilowatt turbine generating electricity for internal needs.<br />
In 2003 District <strong>Energy</strong> added boilers that burn urban tree waste, like trimmings and felled trees,<br />
along with clean post-industrial wood wastes like pallets. The plant generates 25 MW of<br />
electrical energy for <strong>Xcel</strong> <strong>Energy</strong> and 65 MW of thermal energy to heat buildings.<br />
St. Paul’s CHP system benefits the city’s environment by replacing polluting fossil fuel furnaces<br />
with heat from pollution-controlled biomass. At the same time, it benefits developers, building<br />
owners and residents by eliminating the need for expensive boilers, auxiliary equipment, and<br />
space to house them.<br />
Ironically, District <strong>Energy</strong>’s success may prevent further development of woody biomass plants in<br />
the metro area. There is evidence that District <strong>Energy</strong> consumes most of the area’s available<br />
tree waste. But other streams, like municipal solid waste, source-separated organics, or sewage,<br />
might generate biogas in gasifiers or anaerobic digesters to serve the same kinds of uses.<br />
Page 84<br />
Identifying Effective <strong>Biomass</strong> Strategies:<br />
Quantifying Minnesota’s Resources and Evaluating Future Opportunities
Laurentian <strong>Energy</strong> in Hibbing and Virginia<br />
Two municipal power companies, Hibbing Public Utilities and the Department of Public Utilities in<br />
Virginia, have joined forces to create the Laurentian <strong>Energy</strong> Authority. The Authority has installed<br />
a wood-fired boiler in each city’s CHP plant to make steam for electrical generation and district<br />
heating. Since the power plants are located in downtown areas that don’t have room for fuel<br />
storage, loggers deliver harvest waste (limbs, tops, unmerchantable species) to a concentration<br />
yard between the cities where it is weighed, tested, screened, and kept at a 30-60-day supply<br />
level for just-in-time truck delivery to the power plants.<br />
(Steve Downer, MMUA’s The Resource) May 2006<br />
Figure VI-2: Laurentian <strong>Energy</strong> Authority Construction<br />
The managers of the Hibbing and Virginia municipal utilities, Jim Kochevar and Terry Leoni,<br />
developed the biomass conversion plan. In particular, the apparent benefits included:<br />
• A 20-year contract with <strong>Xcel</strong> <strong>Energy</strong> for 35 MW of electricity to meet the state‘s biomass<br />
mandate;<br />
• An average price of 10.2 cents/kWh;<br />
• $704,369,000 in gross revenues over the 20-year period;<br />
• A $20 million annual contribution to the communities’ economies in labor, fuels and<br />
materials;<br />
• 70 jobs retained and 100 new ones added;<br />
• Environmental benefits from replacing coal with biomass;<br />
• Avoidance of a $40 million expense for environmental controls;<br />
• A biomass supply of more than 500,000 green tons within a 75-mile radius (per a study by<br />
Bill Berguson of Duluth’s Natural Resources Research Institute).<br />
Identifying Effective <strong>Biomass</strong> Strategies: Page 85<br />
Quantifying Minnesota’s Resources and Evaluating Future Opportunities
Besides buying harvest waste, the utility is planning to develop a “closed loop” biomass supply<br />
from hybrid poplar and willow plantations. A total of 1,650 acres were planted by LEA in 2004-<br />
2005. The poplar harvest will begin 5 years later.<br />
Laurentian <strong>Energy</strong>’s selection of boilers demonstrates that real-world constraints sometimes<br />
matter more than efficiency. The project is using traditional direct-burn stoker-grate boilers<br />
because a short financing timeline precluded a lengthy design process. The equipment also<br />
had to fit within limited spaces at the Authority’s existing plants. Even with 1970’s technology,<br />
however, the facility should be profitable. It will sell biomass power to <strong>Xcel</strong> <strong>Energy</strong> at the price of<br />
10.2 cents/kWh (PUC, 2005); more than double the market price of power from other fuels.<br />
BIO-SOLIDS<br />
Two factors suggest that bio-solids will play an increased role in energy production in Minnesota.<br />
The first is an increasing interest in using them, and the other is the development of new<br />
technologies that convert them into useful energy without consuming too much of it in the<br />
process. Bio-solids soon may begin to generate marketable electricity and thermal energy.<br />
Incinerators, anaerobic digesters and gasifiers all can be used to convert bio-solids, which in<br />
Minnesota are found mainly in wastewater treatment facilities and animal barns. Most of<br />
Minnesota’s smaller waste water treatment plants use anaerobic digesters to process bio-solids.<br />
But three large facilities that process 58% of the state’s municipal waste use incinerators.<br />
Anaerobic digesters are used most often to convert animal manures, but a new facility in<br />
Benson, Minnesota, is incinerating turkey litter (manure mixed with bedding) to generate<br />
electricity.<br />
Converting Bio-Solids into <strong>Energy</strong><br />
Considering that around 70% of dry bio-solids are volatile solids containing around 10,000 BTUs<br />
per pound, one would expect wastewater to be a great source of renewable fuel. But the<br />
amount of energy needed to dry wet bio-solids has discouraged their use as fuel. Waste water<br />
entering treatment facilities typically contains only 2% solids. New dewatering technologies<br />
involving clarifiers, polymers, filter presses and other means can increase solids content to a<br />
range of 8% to 45%. That helps, but solids have to reach 85% for bio-solids to work as combustion<br />
fuel. Drying to that level takes much of the energy that bio-solids can produce in combustion.<br />
Gasification might become an alternative to combustion in converting bio-solids to energy.<br />
Heavy metals in bio-solids would be released in gasification, but most bio-solids in Minnesota are<br />
quite free of them. Gasifiers have lower capital and operating costs than other advanced<br />
technologies like fluidized bed incinerators, but since they are less tolerant of moisture, their biosolids<br />
fuel also must be dried to 85% solids.<br />
WASTEWATER TREATMENT<br />
The possibility of creating electric and thermal energy from wastewater treatment may become<br />
a reality, however, with some recent innovations in treatment technologies. Upflow sludge<br />
blanket digesters, wetland treatment systems, and the Cannon Process use up to 70% less<br />
energy than the older systems now in use. In addition to these more energy efficient<br />
technologies, advances have been made in maximizing the distribution of heating and cooling<br />
in waste water facilities. New plants can distribute heat from heat pumps and chillers much<br />
more efficiently than plants built just ten years ago. Retrofits in the commercial sector often<br />
Page 86<br />
Identifying Effective <strong>Biomass</strong> Strategies:<br />
Quantifying Minnesota’s Resources and Evaluating Future Opportunities
achieve a 50 reduction in overall energy consumption. When 70% less energy is used in<br />
treatment, more is available for producing electricity.<br />
<strong>Energy</strong> Generation in Minnesota Plants<br />
A number of water reclamation facilities in Minnesota process wastewater in anaerobic<br />
digesters. Most use the resulting biogas only as a heat source. But five wastewater treatment<br />
plants -- the Metro Plant in St. Paul, the Rochester Water Reclamation Plant, the Western Lake<br />
Superior Sanitary District Wastewater Treatment Plant in Duluth, the Empire Waste Water<br />
Treatment Plant in Dakota County, and the Owatonna Waste Water Treatment Plant -- use<br />
biogas to generate electricity as well. While these five do not currently sell excess electricity to<br />
the grid, they do supply a portion of their own internal demands. By adding turbines to<br />
anaerobic digesters, wastewater treatment plants throughout the state could generate<br />
electricity from biosolids.<br />
The Metro Plant, St. Paul<br />
The Metro Plant, which has burned biosolids since the 1940’s, is a part-time generator of<br />
electricity. In 2004-05, the Metro Plant replaced old multiple hearth incinerators with a fluidized<br />
bed incinerator. Currently, the Metro Plant generates steam in the new boiler to supply all its<br />
heating and some of its processes. During the summer, when the facility doesn’t need heating,<br />
the incinerator generates 5 MW of electrical power, the net energy from the equivalent of 200<br />
dry tons per day of biosolids.<br />
The Empire Waste Water Treatment Plant, Dakota County<br />
The Empire Plant receives municipal wastewater from five communities with a total population of<br />
approximately 99,000 people. The plant currently can process 12 million gallons per day, but as<br />
urban development continues to spread throughout central Dakota County, that soon will<br />
double to 24 million gallons per day. The facility extracts biosolids by settling solids in a primary<br />
clarifier and secondary clarifier. After some additional thickening, the solids are pumped into an<br />
anaerobic digester at a rate of 10 dry tons per day. Like the majority of wastewater digesters in<br />
Minnesota, the one at Empire is a low-solids mesophyllic digester operating at roughly 95<br />
degrees F.<br />
For the past 25 years, the Empire plant has burned biogas from the digester in a boiler that<br />
makes steam for plant heating and other uses. But now it is beginning to produce electricity as<br />
well. As part of an expansion, it has installed two 60 kW microturbines to supply the plant’s<br />
power. When the expansion is complete the microturbines will consume about 40% of the gas<br />
produced by the digester.<br />
In the past, planners have built anaerobic digesters because they reduce biological oxygen<br />
demand, nitrogen, and phosphorus in wastewater by 50% or more. In the future, planners will<br />
look to them for energy as well. The Empire Wastewater Treatment Plant is a prime example of<br />
anaerobic digestion serving both purposes.<br />
Identifying Effective <strong>Biomass</strong> Strategies: Page 87<br />
Quantifying Minnesota’s Resources and Evaluating Future Opportunities
AGRICULTURAL WASTES FOR POWER PRODUCTION<br />
Turkey Litter<br />
Fibrowatt, Benson, MN<br />
Fibrowatt, a $202 million 55 MW plant in Benson, Minnesota, is generating electricity from turkey<br />
litter and other agricultural biomass fuels. The plant, a project of Fibrominn LLC, Fibrowatt LLC, a<br />
subsidiary of Homeland Renewable <strong>Energy</strong> LLC and Fibrowatt Ltd., has created 30 new jobs in<br />
this western Minnesota city. <strong>Xcel</strong> <strong>Energy</strong> has signed a 21 year power purchase agreement for<br />
electricity from the facility.<br />
Dairy Manure<br />
(Post, 2007)<br />
Figure VI-3: The Fibrominn Plant<br />
The dairy industry increasingly is using anaerobic digesters to process manure. In many cases<br />
they serve primarily to reduce odors and other environmental problems. But even small dairy<br />
operations can generate enough energy from biogas to reduce their purchases from utilities.<br />
Larger dairy operations (750 head or greater) could generate enough to satisfy its own needs<br />
and sell a surplus to the local utility.<br />
The Haubenschild Dairy Farm<br />
The Haubenschild Dairy Farm processes manure from its 750-cow herd in an anaerobic digester<br />
to produce biogas fuel for a 135 kW engine generator set. The genset powers the entire dairy<br />
operation, and the local electric cooperative, East Central <strong>Energy</strong>, buys enough surplus to<br />
power 75 homes. Marketing the electricity as “cow power,” the utility sells it at a slight premium<br />
to subscribing customers. In addition to electricity, the genset heats the barn with hot water<br />
from its cooling system.<br />
Page 88<br />
Identifying Effective <strong>Biomass</strong> Strategies:<br />
Quantifying Minnesota’s Resources and Evaluating Future Opportunities
(Nelson and Lamb, 2002)<br />
Figure VI-4: The Anaerobic Plug-Flow Digester<br />
Municipal Solid Waste/Food Processing Residues<br />
Anaerobic digesters are versatile enough to handle source-separated organics in municipal<br />
solid waste treatment and waste streams high in organic matter from food processing plants.<br />
American Crystal Sugar currently digests beet tailings and pulp anaerobically at its East Grand<br />
Forks/Moorhead facility and uses the resulting biogas for internal processes. A number of other<br />
food processing facilities are considering anaerobic digestion systems.<br />
FUTURE TECHNOLOGY OPTIONS<br />
Fuel cells would use extracted hydrogen from a fuel supply such as natural gas or a bio-gas and<br />
generate heat and electricity through electrolysis. Fuel cells have been used in some niche<br />
markets, but their commercial availability is limited. Their ability to use syngas from biomass or<br />
coal hasn’t been demonstrated. Impurities in syngas might preclude its use. (Dayton, 2001).<br />
Modular power systems are small, portable electric generators that can be moved to remote<br />
locations. This approach could be particularly attractive for biomass fuels that are widely<br />
dispersed.<br />
Identifying Effective <strong>Biomass</strong> Strategies: Page 89<br />
Quantifying Minnesota’s Resources and Evaluating Future Opportunities
CHAPTER VII : GOVERNMENT ACTIONS<br />
MINNESOTA’S BIOMASS MANDATE OF 1994<br />
Introduction<br />
The history of Minnesota’s <strong>Biomass</strong> Mandate teaches a number of lessons both for policy makers<br />
and project developers. On the policy front, the history illustrates difficulties that may arise when<br />
policy mandates overstep technical and economic realities, calling for results that can’t be<br />
achieved within the current state of the industry. For project developers, the history provides<br />
useful lessons regarding the intersection of politics, policy, and markets and the influences and<br />
limitations that each of these spheres places on the others.<br />
History<br />
Minnesota’s 1994 <strong>Biomass</strong> Mandate arose from a pitched legislative battle over a request by<br />
Northern States Power (now <strong>Xcel</strong> <strong>Energy</strong>) to allow storage of spent nuclear fuel in dry casks at its<br />
Prairie Island power plant. In other states, regulatory agencies like Public Utilities Commissions<br />
respond to such requests, but Minnesota law required legislative approval. That opened the<br />
door to political debate, and a coalition of environmentalists, renewable energy activists,<br />
nuclear opponents and Indian tribes opposed NSP’s request. Some opponents saw this as an<br />
opportunity to close the nuclear plants entirely, while others saw this as an opportunity to extract<br />
environmental concessions from the utility. The result, which came on the final day of the<br />
session, was a compromise called “The Prairie Island Agreement:” NSP could store nuclear<br />
waste in 17 dry casks in exchange for a commitment to build ~425 MW of wind power by 2003<br />
and a further 400 MW if the PUC found that wind power was a least-cost resource. In addition,<br />
NSP agreed to contract for 125 MW of biomass power.<br />
The original biomass mandate read as follows:<br />
Sec. 3. [216B.2424] [BIOMASS POWER MANDATE.] A public utility, as<br />
defined in Minnesota Statutes, section 216B.02, subdivision 4, that operates<br />
a nuclear powered electric generating plant within this state must, by<br />
December 31, 1998, construct and operate, purchase, or contract to<br />
construct and operate (1) 50 megawatts of electric energy installed<br />
capacity generated by farm grown closed-loop biomass; and (2) an<br />
additional 75 megawatts of installed capacity so generated by<br />
December 31, 2002.<br />
In the years since, the original mandate has been amended and modified in twelve legislative<br />
sessions. Some of those amendments clarified sketchy language in the original law. For<br />
example, plants now would be permitted to use a certain percentage of non-biomass fuels, like<br />
natural gas during plant startup. Other amendments responded to the interests of project<br />
developers seeking to build biomass plants under the mandate and very reasonably loosened<br />
the unworkable requirement of “farm grown closed-loop biomass,” which ruled out wastes. But<br />
other amendments suggest that project choice was driven more by considerations that were<br />
more political than commercial.<br />
Two of the first three plants to sign Power Purchase Agreements (PPA’s) with NSP abided by the<br />
terms of the original mandate. The Minnesota Valley Alfalfa Producers (MnVAP) project was to<br />
Page 90<br />
Identifying Effective <strong>Biomass</strong> Strategies:<br />
Quantifying Minnesota’s Resources and Evaluating Future Opportunities
e a 75 MW plant using alfalfa stems as fuel, and the EPS/Beck project was to burn cultivated<br />
whole trees. The third project, St. Paul District <strong>Energy</strong>, required the first amendment to the<br />
statute, allowing the use of waste wood as fuel. The utility argued that the high efficiency of a<br />
CHP plant justified a weakening of the fuel standard. The MNVAP and EPS/Beck projects<br />
eventually came to an end when they couldn’t secure financing. NSP cancelled the MNVAP<br />
PPA for non-performance, but the EPS/Beck PPA transferred to other developers with the<br />
Laurentian <strong>Energy</strong> Authority ultimately acquiring it. In the ensuing years, political and market<br />
forces both had a role in deciding which projects would be built under the <strong>Biomass</strong> Mandate.<br />
The <strong>Project</strong>s<br />
The following brief history of <strong>Biomass</strong> Mandate projects is drawn largely from documents from<br />
Public Utilities Commission dockets. Other sources include news reports and interviews with<br />
interested parties. The history of these projects teaches lessons that policy makers and project<br />
developers might heed as they consider the future of biomass power in Minnesota.<br />
MnVAP<br />
Interest in developing a power plant fired by alfalfa stems arose a year or more before the 1994<br />
Prairie Island agreement created the <strong>Biomass</strong> Mandate. In 1993, NSP asked researchers at the<br />
University of Minnesota to identify agricultural products that potentially could be used as fuel.<br />
The researchers quickly settled on alfalfa, and that led NSP to conduct an informational meeting<br />
with farmers in the Southwestern corner of the state that summer. The outlined project would<br />
strip alfalfa leaves from stems and pelletize them for use as high-protein animal feed. The stems<br />
would then be gasified to generate up to 75 MW of power. In the following year, a group of<br />
farmers formed a cooperative called MnVAP, and a study of the project was conducted by<br />
NSP, the University of Minnesota, DOE and EPRI.<br />
Initially MnVAP had seen NSP as a partner, but before the end of 1993 NSP had explained that<br />
the utility would not develop the project themselves but would invite MnVAP to participate in<br />
the competitive bidding process for biomass power projects (Kokmen, 1999). MnVAP chose to<br />
pursue the project, and in mid-1996 won in competitive bidding. They received $4 million from<br />
the Department of <strong>Energy</strong> for design work and permitting ("Northern States", 1996), and became<br />
eligible for up to $40 million in construction financing ("Minnesota Farmers'", 1996). After<br />
negotiating for a year and a half, MnVAP and NSP agreed to a PPA, which they filed in February<br />
of 1998. The Public Utilities Commission then took 14 months to approve the project (PUC,<br />
1999b). The long approval period was due in large part to the intervention of Minnesota <strong>Energy</strong><br />
Consumers (MEC), a coalition of large energy customers, who complained that MnVAP’s power<br />
would cost Minnesota’s ratepayers $30 million more than power from natural gas (PUC, 1998).<br />
Although MEC failed to prevent the PUC’s approval of the PPA, the delay was largely<br />
responsible for the project’s slow unraveling over the course of 1999. In early 1999 Enron, a major<br />
financial backer of the project, pulled out. The Department of <strong>Energy</strong> then followed suit by<br />
freezing its funding of the project (Kokmen, 1999). By the end of the year NSP had terminated its<br />
PPA with MnVAP for nonperformance (NSP, 1999), and MnVAP announced that it would no<br />
longer pursue the project. <strong>Report</strong>s of the episode suggested that the added costs of the<br />
prolonged debate over the PPA caused Enron to pulling out of the project. Others conceded<br />
that this was a factor, but that the project was probably too ambitious, and that PUC’s delay<br />
simply gave the financiers an opportunity to reconsider the risks and costs of the project<br />
(Kokmen, 1999; Mooney, 2000).<br />
MnVAP’s involvement in biomass power continued beyond the termination of their PPA. The coop<br />
actually was close to signing an agreement with Fibrominn for the transfer of their PPA when<br />
Identifying Effective <strong>Biomass</strong> Strategies: Page 91<br />
Quantifying Minnesota’s Resources and Evaluating Future Opportunities
NSP cancelled it. In the following year MnVAP and Fibrominn came to an agreement that<br />
MnVAP would supply Fibrominn with 50,000 tons of alfalfa stems annually to the plant at<br />
Fibrominn’s call ("Agreement Could", 2000). MnVAP continues to function. It has developed a<br />
business selling pelletized alfalfa leaves for animal feed.<br />
EPS/Beck<br />
NSP’s second round of bidding led to the selection of two biomass projects: St. Paul District<br />
<strong>Energy</strong> and the EPS/Beck Whole Tree <strong>Energy</strong> project. Each was initially approved to supply 25<br />
MW of biomass power. The EPS/Beck project, located in St. Peter, was to dry and burn whole<br />
trees using proprietary harvesting, drying and processing technologies. The trees would be<br />
plantation grown hybrid poplars. Approximately 25,000 acres of land would be planted for each<br />
25 MW of capacity. (Ragland, Ostlie, and Berg, 2000)<br />
The original contract specified a 25 MW facility but it gave NSP the option of increasing its size up<br />
to 75 MW. As the EPS/Beck and District <strong>Energy</strong> PPAs were presented to the PUC, the 75 MW<br />
MnVAP project was unraveling. This confluence of events ultimately unraveled the EPS project<br />
as well.<br />
The Department of Public Service (DPS), which advises PUC, expressed concern at the costs of<br />
both the EPS and District <strong>Energy</strong> PPAs. The Department felt that the mandate had given the<br />
projects undue market power because, since NSP could fully recover costs of the mandated<br />
projects through rate increases, they had little incentive to negotiate the best price from them.<br />
The Department recommended approval of the EPS PPA with modifications, which included a<br />
lower price cap and an increase in project size to 50 MW (DPS, 1999). The PUC then deferred<br />
both PPA’s, encouraged District <strong>Energy</strong> to improve upon its proposal, encouraged EPS/Beck to<br />
develop a 50 MW proposal, and ordered NSP to clarify the status of the MnVap proposal (PUC,<br />
1999a). Both projects returned with PPAs, and the PUC approved them in January of 2000. The<br />
order approving EPS/Beck’s PPA noted that, except for DPS, the parties involved, NSP and<br />
EPS/Beck, favored the 25 MW plant size over a larger plant (EPS/Beck argued that DOE and<br />
private lenders might not fund a larger facility). The PUC asked NSP to return to the PUC in a few<br />
months to declare their position on the option to increase the size of the project (PUC, 2000a).<br />
Despite the protestations of EPS, the PUC approved its project at 50 MW. Perhaps as a<br />
consequence, EPS never was able to secure enough financing to move forward. EPS eventually<br />
sold its rights and obligations under the contract to NGPP (<strong>Xcel</strong> <strong>Energy</strong>, 2003), which was<br />
ultimately purchased by the Laurentian <strong>Energy</strong> Authority.<br />
<strong>Biomass</strong> project developers should note one important item that appeared in the PUC docket<br />
during the approval of NSP’s choice to increase the project size to 50 MW from 25 MW. District<br />
<strong>Energy</strong> objected to the approval of the modified PPA. At that time the <strong>Biomass</strong> Mandate<br />
statute disallowed approval of new biomass plants that would adversely affect the fuel supply of<br />
an existing biomass plant. District <strong>Energy</strong> argued that modification of the PPA meant that EPS 50<br />
MW plant was a new facility, and that its plan to use Metro Area wood waste until its tree<br />
plantations matured would have an adverse commercial effect on District <strong>Energy</strong> and its<br />
customers (St. Paul Cogeneration, 2000).<br />
The challenge became moot when the PUC ruled that the modified PPA did not create a new<br />
project (PUC, 2000a). But the statutory language protecting the fuel supplies of existing projects<br />
along with District <strong>Energy</strong>’s use of that language to intervene in another project sends two<br />
messages to project developers: first, that the legislature has been willing to intervene in market<br />
competition where biomass is concerned, and may do so again if lobbied by biomass<br />
consumers; second, that a competitor for fuel may intervene to protect its supplies.<br />
Page 92<br />
Identifying Effective <strong>Biomass</strong> Strategies:<br />
Quantifying Minnesota’s Resources and Evaluating Future Opportunities
District <strong>Energy</strong>’s intervention reveals its concern about the sufficiency of available feedstocks in<br />
the Twin Cities Metropolitan Area. A recent study for the Rock Tenn plant supports the notion<br />
that the woody biomass growing in the Twin Cities Metro Area is almost fully utilized (Nelson,<br />
2007). This reminds us that biomass fuels sometimes are in limited supply. Potential consumers of<br />
those fuels conduct due diligence to confirm that sufficient fuels are available, and that<br />
competition for them is unlikely to develop.<br />
St. Paul District <strong>Energy</strong><br />
In 1997 District <strong>Energy</strong> and Trigen-Cinergy proposed to NSP a wood fired CHP plant to satisfy part<br />
of the <strong>Biomass</strong> Mandate. At that time, wood waste from the Twin Cities was landfilled or burned<br />
in open fires. But the <strong>Biomass</strong> Mandate and new regulations banning open burning were<br />
suggesting that the time had come to use urban wood waste as fuel. The wood-burning plant<br />
would adjoin District <strong>Energy</strong>’s existing coal fired boilers that provided much of downtown St.<br />
Paul’s heat. The new boilers would supplant up to 80% of the coal used to fuel the district<br />
heating system and consume up to 280,000 tons of chipped urban wood waste per year.<br />
In early 1999 NSP submitted a PPA for PUC approval. In March of that year the Department of<br />
Public Service proposed substantial modifications to the PPA, and recommended approval of<br />
the PPA if those modifications were accepted. The PUC in August of 1999 deferred<br />
consideration of the PPA and encouraged District <strong>Energy</strong> to improve upon its proposed terms<br />
(PUC, 1999a). In early October NSP submitted updated terms of the PPA and in January of 2000<br />
the PUC approved the PPA (PUC, 2000b). The plant planned to begin operation in 2001 ("Trigen-<br />
Cinergy", 1999); but regulatory delays delayed start-up until May of 2003 ("Cinergy Business",<br />
2003).<br />
Two episodes in the project’s history illustrate (1) the need for biomass plants to prove they are<br />
good neighbors and (2) the challenges biomass consumers face in securing their fuel supplies.<br />
The plant is located in downtown St. Paul, clearly visible from the river. As the start of<br />
construction approached, people involved in redeveloping St. Paul’s downtown began to<br />
express concerns about how well an industrial facility would fit in. The utility explained that they<br />
were designing the plant to blend in with its surroundings. They also sought suggestions from<br />
their neighbors and other downtown groups (Karlson, 2001). District <strong>Energy</strong> appeared to<br />
successfully allay the concerns of the downtown communities.<br />
Another neighborhood incident concerned the location of a fuel processing facility near a<br />
residential area. The boiler plant opened several months later than planned. Meanwhile, one of<br />
its wood suppliers had gathered and chipped several months worth of wood fuel on a lot near<br />
some houses. Exposed too long to the elements, the chip piles began to smolder and emit<br />
odors, leading to fire department calls and neighborhood opposition to a conditional use permit<br />
for the processing facility (Monsour, 2003).<br />
The other lesson that St. Paul District <strong>Energy</strong> teaches is that obtaining a consistent, high-quality<br />
fuel supply can be difficult. District <strong>Energy</strong> initially relied upon independent contractors to<br />
deliver wood to their processing yard, but its inconsistent quality became a problem. So the<br />
utility created a for-profit subsidiary to manage its fuel supply. Environmental Wood Processing<br />
instituted several improvements. They still accept fuel deliveries from independent parties, but<br />
they reprocess those to meet plant specifications (Deering, 2006). They also manage the St. Paul<br />
transfer station and seek fuels at other municipal transfer stations and compost sites either by<br />
signing on as facility managers or by simply offering to chip materials at municipal sites and<br />
remove them free of charge (City of St. Louis Park, 2007; City of Albertville, 2007).<br />
Identifying Effective <strong>Biomass</strong> Strategies: Page 93<br />
Quantifying Minnesota’s Resources and Evaluating Future Opportunities
NGPP<br />
EPS/Beck assigned its PPA to NGPP in early 2003. NSP’s petition for approval of the reassignment<br />
explained that NGPP intended to abandon the Whole Tree <strong>Energy</strong> scheme and burn<br />
conventional chipped wood from tree plantations (<strong>Xcel</strong> <strong>Energy</strong>, 2003). They also planned move<br />
the facility’s location to Waseca. NGPP pursued the Waseca plan through 2003; but found that<br />
rights to land in the Waseca area cost more than anticipated, and that landowners wanted<br />
higher lease payments for tree plantations than the developers could afford. By early 2004<br />
NGPP discussing with the cities of Virginia and Hibbing the best way to transfer the PPA to them<br />
(<strong>Xcel</strong> <strong>Energy</strong>, 2004). In the ensuing months the legislature reduced the size of the mandate to<br />
110 MW while encouraging NGPP to reduce its project to 35 MW. In early 2004 the PUC put<br />
consideration of the docket on hold until negotiations to transfer ownership of the PPA to the<br />
cities of Virginia and Hibbing were completed.<br />
Laurentian <strong>Energy</strong> Authority<br />
In February of 2004 the Hibbing Public Utilities were pondering the long term future of their power<br />
generation facilities. All options were on the table, from closing them to installing natural gas<br />
combustion turbines. Among the options was a partnership with NGPP, then stymied in its<br />
biomass project in Waseca. ("<strong>Project</strong>s Wait", 2004b) By Mid-April of that year the cities of Virginia<br />
and Hibbing had agreed to enter into a joint venture to replace their aging coal boilers with<br />
wood boilers ("Public Utilities Meeting", 2004a), and by late April the cities were lobbying the<br />
state legislature to fund their project (Swanson, 2004). After exploring their options, NGP Power<br />
transferred their interest in NGPP Minnesota <strong>Biomass</strong>, LLC to the Laurentian <strong>Energy</strong> Authority.<br />
NGPP then announced it would abandon the project in Waseca and fulfill their contract by<br />
leasing and retrofitting the Laurentian <strong>Energy</strong> Authority’s coal fired boilers. The cities formed the<br />
Laurentian <strong>Energy</strong> Authority to develop the project and eventually purchased NGPP to eliminate<br />
the complications of working with a third party.<br />
The Laurentian project involved replacing coal fired boilers used by each city’s district heating<br />
system with boilers that would eventually burn “closed loop biomass” in the form of plantation<br />
grown hybrid poplars. Until the poplar plantations become available, the cities will burn logging<br />
residues and other wood wastes. They anticipate that by the end of the 20 year PPA, more than<br />
half of the plant’s fuel will have come from plantations. Besides powering each city’s district<br />
heating system, the two projects will generate a combined 35 MW of biomass boiler for <strong>Xcel</strong><br />
<strong>Energy</strong>, which finally will fulfill the 1994 Prairie Island Mandate. Since the two plants are in the<br />
cities’ business districts, the wood fuel will be received and processed in a rural wood yard<br />
between the two.<br />
The Laurentian <strong>Energy</strong> Authority’s projects came to fruition quite quickly after the second<br />
amendment to the PPA was approved in August of 2005. In October of that year a contract for<br />
the construction of the new boilers was announced ("Foster Wheeler", 2005). Construction was<br />
completed and power generation had begun at the Laurentian <strong>Energy</strong> Authority in December<br />
of 2006 (“<strong>Biomass</strong> generation”, 2006).<br />
In previous years the facility has been the recipient of funding from the federal government. The<br />
funding has included:<br />
• A grant of $250,000 from the U.S. Department of Agriculture to fund the harvest of timber<br />
from 180 acres within Superior National Forest. ("Rep. Oberstar", 2005)<br />
• A grant of $1,200,000 from the U.S. Department of <strong>Energy</strong> to study potential wood<br />
resources and the effects of using “forest waste products for biomass burning projects at<br />
the Virginia and Hibbing public utilities.” ("Grant Will Help", 2006)<br />
Page 94<br />
Identifying Effective <strong>Biomass</strong> Strategies:<br />
Quantifying Minnesota’s Resources and Evaluating Future Opportunities
Fibrominn<br />
Concerns about the environmental effects of stored turkey litter (manure and wood shavings<br />
used as bedding) at regional turkey producers led to the development of a 55 MW Fibrominn<br />
plant in Benson. The turkey litter in question often was used as a fertilizer, particularly by organic<br />
farmers. Since growers had a narrow window of time to apply the fertilizer each year, it had to<br />
be stockpiled year round by the turkey producers until it was called for. The resulting odors and<br />
flies were beginning to aggravate local residents, who complained to local authorities. Poultry<br />
producers then reached out to FibroWatt, a UK firm that had built three power plants fueled by<br />
turkey litter (Crosby, 2007; Dale, 2007).<br />
These efforts arose around the time the MnVAP project was beginning to unravel. During the<br />
2000 legislative session, after the MnVAP PPA had been cancelled, Fibrominn successfully<br />
lobbied the legislature to let them supply those MW’s under the biomass mandate. The resulting<br />
amendments to the <strong>Biomass</strong> Mandate:<br />
• Allowed poultry litter to satisfy up to 50 MW of the biomass mandate.<br />
• Enabled NSP to forgo a competitive bidding process for their remaining MW of<br />
compliance under the mandate.<br />
• Required the PUC to grant preliminary approval of a PPA with a turkey litter fired plant<br />
within 30 days of filing, provided the PPA was filed prior to September 1, 2000. Such<br />
approval would be based solely on the cost of the PPA being less than or equal to the<br />
cost of prior PPA’s approved for the satisfaction of the biomass mandate.<br />
• Required all contracts for biomass powered facilities filed with the PUC by September 1,<br />
2000 be approved by July 1, 2001.<br />
On August 31, 2000, <strong>Xcel</strong> <strong>Energy</strong> and Fibrominn executed a PPA and submitted it to the PUC for<br />
preliminary approval. On May 8 th of 2001 the PUC approved the PPA (PUC, 2001). On August<br />
28 th of that year Fibrominn applied to the Minnesota Pollution Control Agency for an air emissions<br />
permit. The process for acquiring the air emissions permit took significantly longer than<br />
expected. A draft air emissions permit was not released for public comment until August 2, 2002,<br />
and the final permit was not received until October.<br />
This delay in permitting resulted in a number of complications for Fibrominn and <strong>Xcel</strong> <strong>Energy</strong>.<br />
Fibrominn’s next major milestone was to be a financial closing by July 1, 2002. That couldn’t take<br />
place because the air emissions permit hadn’t yet been granted. A series of extensions<br />
followed, and the project did not complete its financing until December 15, 2004 (<strong>Xcel</strong> <strong>Energy</strong>,<br />
2005).<br />
The project hit a small snag in the fall of 2005 when Hurricane Katrina threatened to delay a<br />
shipment of Chinese-made boiler components that were headed toward the port of New<br />
Orleans. Fortunately, the components were running ahead of schedule (<strong>Xcel</strong> <strong>Energy</strong>, 2006).<br />
Since then the project has proceeded as planned and began operation in 2007.<br />
The project’s record indicates that Fibrominn handled quite adeptly the politics necessary to<br />
bring the project to fruition. At the state level, the developers inserted language that allowed<br />
turkey litter to satisfy the biomass mandate and eliminated the competitive bidding process. The<br />
project’s success at the local level is notable as well. The project began as a partnership<br />
between Fibrominn and the city of Benson. The city owns the land and facility and leases them<br />
to Fibrominn on a long term contract. The record also shows that Fibrominn made a concerted<br />
effort to involve the townspeople and provide them with a communications channel to the<br />
project developers. A Citizen’s Advisory Panel, consisting of twelve independent community<br />
members, convened in April of 2001 and began to hold regular meetings. It gave the<br />
Identifying Effective <strong>Biomass</strong> Strategies: Page 95<br />
Quantifying Minnesota’s Resources and Evaluating Future Opportunities
community a sounding board for their concerns with issues like noise, odors and truck traffic<br />
(Fibrominn, n.d.).<br />
Northome <strong>Biomass</strong> Plant (Itasca Power)<br />
Concerned about the long delays in the Fibrominn project, <strong>Xcel</strong> <strong>Energy</strong>, the legislature, and the<br />
PUC began to worry that projects to meet the mandate might be completed late, or not at all.<br />
They designed an emergency process to use in the event that attempts to meet the mandate<br />
failed. The delays also brought a number of developers to offer their projects to the PUC and<br />
the legislature as solutions to <strong>Xcel</strong> <strong>Energy</strong>’s difficulties. One interesting offer came from<br />
Minnesota Power, which offered to sell biomass power to <strong>Xcel</strong> <strong>Energy</strong> from their existing biomass<br />
boilers (Minnesota Power, 2003). <strong>Xcel</strong> <strong>Energy</strong> rejected that offer, but the political efforts of one<br />
project developer were more difficult to ignore.<br />
In May of 1999 Itasca Power Company and Great River <strong>Energy</strong> entered in to an agreement<br />
under which GRE would purchase the output of a proposed Northome <strong>Biomass</strong> plant, and GRE<br />
would build a transmission line to connect the project to the regional grid ("Great River <strong>Energy</strong>",<br />
1999). The Northome plant was to be a small (15 MW) facility, fired with waste wood from<br />
nearby wood products mills. In addition to generating electricity, the facility would provide<br />
steam to nearby industrial customers (IPC, 2005).<br />
Despite their agreement with Great River <strong>Energy</strong>, Itasca Power lobbied the legislature to make<br />
<strong>Xcel</strong> <strong>Energy</strong> enter into a PPA with Itasca Power in 2001 “on an equal basis” with other projects<br />
<strong>Xcel</strong> <strong>Energy</strong> was working with to meet the mandate. Over the course of the following five years,<br />
<strong>Xcel</strong> <strong>Energy</strong> and Itasca Power engaged in a series of negotiations and regulatory proceedings<br />
but never were able to arrive at a mutually agreeable PPA. Itasca Power’s continual efforts to<br />
convince both the state legislature and the PUC to force <strong>Xcel</strong> <strong>Energy</strong> to sign a PPA with them<br />
were no more successful. A press release from December of 2005 on Itasca Power’s website<br />
announced the cancellation of the project IPC, 2005). The final mention of Itasca Power in the<br />
PUC’s regulatory record comes in a Progress <strong>Report</strong> to the PUC in the first quarter of 2006 in<br />
which <strong>Xcel</strong> <strong>Energy</strong> mentions that Itasca Power indicated that the price of any PPA would “have<br />
to be substantially higher than previously discussed, primarily due to a shortage in the area of<br />
wood residue fuel” (emphasis added). (<strong>Xcel</strong> <strong>Energy</strong>, 2006).<br />
Page 96<br />
Identifying Effective <strong>Biomass</strong> Strategies:<br />
Quantifying Minnesota’s Resources and Evaluating Future Opportunities
1994 Legislature –<br />
As part of the<br />
Prairie Island<br />
Agreement, NSP is<br />
mandated to<br />
generate 125 MW of<br />
biomass power from<br />
farm grown closed<br />
loop biomass.<br />
1995 Legislature –<br />
1996 Legislature –<br />
Farm grown closed-loop<br />
biomass is defined.<br />
Interim fuel exemptions<br />
are provided for. Nonbiomass<br />
fuel use is<br />
capped at 25%. <strong>Project</strong>s<br />
mandated to demonstrate<br />
financial viability.<br />
Single project MW<br />
limitation of 75 MW<br />
established, and waste<br />
wood is allowed as a fuel<br />
source for 25 MW power<br />
from St. Paul district<br />
heating system.<br />
1998 Legislature –<br />
Ratepayer recovery of<br />
utility expenses incurred<br />
in meeting the mandate<br />
is permitted. Act of God<br />
exemption form<br />
requirement to use<br />
biomass fuels is<br />
included.<br />
2000 Legislature –<br />
Agricultural cropwaste is<br />
permitted to fulfill 25%<br />
of project fuel<br />
requirements. Use of<br />
turkey litter is permitted<br />
by Fibrominn plant. The<br />
Fibrominn plant is<br />
limited to 50 MW, and<br />
the PPA price is capped.<br />
Co-firing with nonbiomass<br />
fuels is<br />
permitted. New projects<br />
restricted if they will<br />
adversely impact<br />
existing projects. 75<br />
MWs mandated to come<br />
from “Agricultural<br />
<strong>Biomass</strong>”.<br />
2001 Special<br />
Legislative Session –<br />
NSP ordered to<br />
“consider on an equal<br />
basis” the Northome<br />
<strong>Biomass</strong> <strong>Project</strong>. The<br />
project is required to<br />
be operational by<br />
December 31, 2002.<br />
Facilities datisfying<br />
the biomass mandate<br />
are exempted from<br />
property taxes.<br />
2003 Legislature –<br />
Operational date for the<br />
Northome <strong>Biomass</strong> <strong>Project</strong><br />
changed to construction<br />
start date of December 31,<br />
2005.<br />
2003 Legislature –<br />
NSP ordered to sign PPA<br />
for Northome <strong>Biomass</strong><br />
project under Reneweable<br />
<strong>Energy</strong> Objective.<br />
2003 Special Session –<br />
Legislature Reduces<br />
mandate to 110 MW,<br />
requires approval of<br />
EPS/Beck transfer to<br />
NGPP if the project size is<br />
reduced.<br />
2005 Legislature–<br />
The use of “sustainably<br />
managed woody biomass” by<br />
mandated projects is<br />
permitted. State agencies and<br />
project developers are<br />
mandated to define best<br />
practices for “sustainably<br />
managed woody biomass”.<br />
December 1998 - NSP<br />
and EPS Beck execute<br />
a PPA for 25 MW to<br />
be powered by a<br />
Whole Tree Burner<br />
January 2000 –<br />
EPS/Beck project<br />
increased to 50<br />
MW<br />
February 2003 - EPS/Beck<br />
PPA transferred to NGPP.<br />
The project will now use<br />
chipped wood, at least 50%<br />
from closed loop biomass.<br />
March 2005 –<br />
NGPP Purchased<br />
by Laurentian<br />
<strong>Energy</strong> Authority.<br />
June 2006 –<br />
Construction<br />
underway at<br />
LEA<br />
November 1997<br />
- NSP and<br />
MNVAP<br />
execute a PPA<br />
for 75 MW to<br />
be fueled by<br />
Alfalfa Stems<br />
December 1998 -<br />
NSP and St. Paul<br />
Cogeneration<br />
execute a PPA for<br />
25 MW to be fueled<br />
by waste wood<br />
December 1999 –<br />
MNVAP contract<br />
terminated for<br />
noncompliance.<br />
August 2000 –+<br />
Fibrominn PPA<br />
Signed<br />
Summer 2001 –<br />
Construction begins on<br />
St. Paul District<br />
<strong>Energy</strong> plant.<br />
Spring 2003 –<br />
Construction<br />
completed on St. Paul<br />
District <strong>Energy</strong> plant.<br />
November 2004<br />
– Fibrominn<br />
Construction<br />
begins<br />
Early<br />
Fibro<br />
proje<br />
comp<br />
expe<br />
1994 1995 1996 1997 1998 1999 2000 2001 2002 2003 2004 2005 2006<br />
Figure VII-1: A Timeline of Minnesota's <strong>Biomass</strong> Mandate<br />
Identifying Effective <strong>Biomass</strong> Strategies: Page 97<br />
Quantifying Minnesota’s Resources and Evaluating Future Opportunities
GOVERNMENT ECONOMIC DEVELOPMENT INCENTIVES FOR<br />
BIOMASS POWER PROJECTS<br />
Government incentives for renewable power generation are a moving target. The Minnesota<br />
State Legislature and the United States Congress currently are deliberating a flurry of bills<br />
encouraging all varieties of renewable energy. So any account of incentives must be updated<br />
frequently as some of those bills pass into law. Rather than provide only a snapshot of today’s<br />
programs, which will be superseded by tomorrow’s, we supply addresses of websites that will<br />
supply current information.<br />
Another reason to check with the agencies before planning a project around government<br />
programs is that some of those programs which look good on paper have no funding. That<br />
seems to be true especially of federal programs. They survive on the page in the hope that<br />
some day the Congress will see fit to replenish them.<br />
Most existing government incentives promote energy efficiency and conservation on the<br />
demand side, not renewable capacity on the supply side. Even when incentives are designed<br />
to encourage the production of renewable energy, they tend to focus on efforts by small<br />
communities, farms, private businesses and family households to generate power for internal<br />
consumption using small technologies like wind generators, photovoltaic and solar thermal<br />
panels, and anaerobic digesters. Few programs target biomass plants large enough to export<br />
power to the grid.<br />
In the aggregate, local initiatives and small technologies can make valuable contributions to<br />
our overall renewable energy portfolio. But since boilers, turbines and gasifiers are expensive,<br />
biomass plants generally operate at utility scale or else co-generate power as adjuncts of<br />
substantial manufacturing or processing enterprises.<br />
Aside from programs targeting renewable energy projects, however, there are many larger<br />
economic development programs that can help any kind of project, including biomass energy.<br />
Minnesota through the years has been in the forefront nationally in establishing agencies and<br />
programs to help businesses grow.<br />
Those programs can work well for co-generation, which probably will continue to be the<br />
dominant form of biomass project, because they tend to favor expansions by existing businesses<br />
rather than start-ups. Therefore we begin with a survey of generic economic development<br />
programs and follow that with a look at programs specifically aimed at renewable energy<br />
development.<br />
General-Purpose Economic Development Programs<br />
Though incentives designed specifically for large scale biomass power generation are few,<br />
developers of biomass plants can take advantage of many generic economic development<br />
programs. Fortunately for Minnesota biomass energy developers, one of the nations most<br />
powerful is available through the Minnesota Department of Trade and Economic Development<br />
(DEED). It’s commonly know as JOBZ<br />
Page 98<br />
Identifying Effective <strong>Biomass</strong> Strategies:<br />
Quantifying Minnesota’s Resources and Evaluating Future Opportunities
Minnesota Jobs Opportunities Building Zones (JOBZ)<br />
The JOBZ program exempts sales, property, and state corporate income taxes, offering the<br />
biomass power developer several advantages unusual among economic development<br />
incentives:<br />
• Unlimited project scale. Many government programs target small businesses, either by<br />
putting a top limit on the cost of the project, like the $20 million cap of the federal<br />
Industrial Development Bond program, or by offering loans too small to be attractive to a<br />
large project, like the $500,000 maximum advance of the Minnesota Investment Fund.<br />
But JOBZ works for very large as well as very small projects<br />
• Substantial economic benefit. Many government programs consist of below-market<br />
loans at rates somewhat lower than those of conventional financing. Usually those take<br />
the form of gap loans supplemental to more substantial first-position commercial<br />
financing. In both their amount of funding and their interest-rate advantages, those<br />
programs operate on the margins and appeal primarily to relatively small projects. With<br />
JOBZ, however, the larger the project, the larger the value of its tax exemptions. In the<br />
case of costly biomass power plants, they could be worth millions of dollars. .<br />
• Minimal paperwork. For a property tax exemption, the business signs a simple contract<br />
with the city called the Business Subsidy Agreement. The Minnesota Department of<br />
Revenue issues a certificate for the sales tax exemption. And by including a schedule<br />
with its state tax return, the company takes its corporate income tax deduction.<br />
• Criteria based on capital investment and financial performance rather than body count.<br />
Some programs base financial assistance quid pro quo on the number of jobs the project<br />
creates – this many dollars for that many jobs. While cities offering JOBZ in fact may set a<br />
minimum number of jobs or a minimum wage level, most do not. A highly automated<br />
project with high capital costs and healthy profits -- but relatively few workers -- can take<br />
full advantage of all tax deductions.<br />
• Eligibility. Many economic development programs benefit only manufacturers, but<br />
power generation facilities are eligible for JOBZ. The only type of business specifically<br />
excluded is local retail. The program has been applied to non-manufacturing projects,<br />
like distribution warehouses.<br />
• Focus on Minnesota regions with biomass potential. The seven Metro counties, plus<br />
Wright and Sherburne, are excluded from the program. The rest of the state’s 87<br />
counties are eligible, and those happen to be the likeliest counties to attract biomass<br />
power development.<br />
JOBZ Zones and Subzones<br />
JOBZ benefits attach to specific parcels of land, or to vacant buildings, that have been<br />
designated by communities throughout Minnesota. Those locally designated sites, called<br />
“subzones,” are organized into ten large administrative “zones” that cover the entire state, with<br />
the exception of the metro counties referred to above. Ten Zone Administrators provide support<br />
services to the total of more than 300 communities enrolled in the program at its inception on<br />
January 1, 2004.<br />
JOBZ benefits attach to specific subzones. To receive tax-exemptions, the business activity must<br />
occur on the JOBZ site. That excludes, for example, contractors whose work occurs at remote<br />
jobsites. It also would rule out the gathering of biomass feedstocks away from the plant.<br />
But the magic circle of tax benefits can be moved if a developer prefers a particular site not<br />
currently enrolled in JOBZ. The local city council, school board and county board can pass<br />
resolutions that transfer JOBZ status from one place to another within the city, to locations<br />
Identifying Effective <strong>Biomass</strong> Strategies: Page 99<br />
Quantifying Minnesota’s Resources and Evaluating Future Opportunities
elsewhere in the county, or even to other cities. In the case of a co-generation plant attached<br />
to manufacturing or processing facility, JOBZ status could be conferred to a generation site as<br />
long as it can be clearly delineated. The program can’t designate equipment mixed in with an<br />
existing plant.<br />
The city exercises total and arbitrary discretion over JOBZ in its community. It does not have to<br />
extend exemptions to any project that it doesn’t want. Once it does approve a project,<br />
however, it must provide the whole JOBZ exemption package for the entire term of eligibility. It<br />
can’t pick and choose certain benefits or terms.<br />
When it comes to state taxes, as distinct from local taxes, even if the JOBZ project is fully<br />
approved by local taxing authorities and the Minnesota Department of Employment and<br />
Economic Development, it ultimately must conform to rules of the Minnesota Department of<br />
Revenue regarding JOBZ exemptions. For questions on state tax treatment, contact Anne<br />
Gravelle, 651-556-6836.<br />
Prevailing wage<br />
An important caveat to anyone considering a greenfield project in JOBZ: in order to qualify for<br />
exemptions, the building must be constructed by workers paid prevailing wages for that county.<br />
Equipment installation, however, does not fall under that requirement. The Minnesota<br />
Department of Labor and Industry, which promulgates lists of prevailing wages, makes a<br />
straightforward distinction between construction and equipment installation. If the work is done<br />
under a construction contract, it is construction and therefore subject to prevailing wage; if it is<br />
done under an installation contract, it is installation and therefore not subject to prevailing<br />
wage.<br />
For details on prevailing wages, go to: www.doli.state.mn.us, click on Prevailing-Wage Rates,<br />
click on the Minnesota map labeled Commercial, and then click on the county where you plan<br />
to build.<br />
JOBZ Tax Exemptions<br />
JOBZ exemptions fall into three categories: 1) Sales and Use; 2) Real Estate; and 3) Corporate<br />
Franchise (income). The program also provides a tax credit against income or a cash payment<br />
in the absence of income provided that wages average above a certain annual threshold,<br />
which currently is in the low thirty thousand-dollar range.<br />
Sales and Use Tax<br />
Real estate and corporate income tax exemptions begin once a facility is up and running. But<br />
the Sales and Use Tax exemption takes effect as soon as the developer signs a Business Subsidy<br />
Agreement with the city. Once that is in place, the developer or its contractor can take Sales<br />
and Use Tax exemption on purchases of building material and equipment while the plant is<br />
under construction.<br />
Until the end of the JOBZ period the sales tax exemption applies also to further purchases.<br />
Goods and materials for resale always have been tax-exempt, but JOBZ exemptions include<br />
items not for resale but for consumption at the plant: IT systems, supplies, furniture, material<br />
handling equipment, and even vehicles (except for over-the-road trucks).<br />
Page 100<br />
Identifying Effective <strong>Biomass</strong> Strategies:<br />
Quantifying Minnesota’s Resources and Evaluating Future Opportunities
Real Estate Tax Exemptions<br />
Since real estate taxes are levied by local municipalities, counties and school districts, JOBZ is as<br />
much a local incentive as it is a state incentive. For a greenfield project, taxes currently paid on<br />
the bare land will continue to be paid, but taxes on improvements will be exempt. An addition<br />
to an existing plant can qualify for JOBZ, but the existing plant will continue to pay the same<br />
property tax as before. A vacant building placed by the city in JOBZ will be tax-exempt to a<br />
new user.<br />
Corporate Franchise Tax Exemption<br />
The JOBZ Franchise Tax exemption applies to profits directly attributable to the JOBZ project. A<br />
Minnesota start-up in JOBZ, or a company new to Minnesota, would receive the deduction on its<br />
entire Minnesota profit. But if the company maintains other operations in non-JOBZ Minnesota<br />
locations, the JOBZ exemption is prorated on the basis of the company’s total Minnesota<br />
employment. If the company has shut down at a non-JOBZ site and moved to a JOBZ site, it<br />
must employ 20% more workers and its deduction is prorated by subtracting the number of jobs<br />
at its former location from its new total. Minnesota Department of Revenue Schedule M500<br />
details that calculation.<br />
Note that of the three categories of exemptions -- Sales, Corporate and Property -- only the<br />
Corporate Tax exemption is prorated for a relocating company. Sales and use tax and property<br />
tax connected to the JOBZ project are entirely exempt regardless of the company’s other -- or<br />
previous -- Minnesota employment.<br />
JOBZ Timeframe<br />
The JOBZ program took effect on January 1, 2004. Since then, more than 300 projects have<br />
signed onto it. Under the existing statute, exemptions for all existing and future projects are to<br />
expire at the same time: JOBZ’s expiration date, December 31, 2015. Thus, the nearer we get to<br />
2016, the less cumulative benefit a new JOBZ project will receive. But a bill introduced at the<br />
legislature in 2006 would provide a full 10 years of benefits to any project that begins before<br />
2016.<br />
For detailed information on JOBZ, go to www.deed.state.mn.us and click on the JOBZ logo.<br />
Among many files on that site, you will find a useful calculator to help you estimate the value of<br />
the deductions based on your own company’s numbers.<br />
For a discussion of JOBZ eligibility for your project, call Dentley Haugesag at the Minnesota<br />
Department of Employment and Economic Development, 651-297-1174, or send an email to:<br />
dentley.haugesag@state.mn.us<br />
For information on JOBZ tax forms, go to: http://www.taxes.state.mn.us, click on 2006 income tax<br />
forms and instructions, and click on JOBZ.<br />
Tax Increment Financing (TIF)<br />
TIF is a method used by Minnesota municipalities to help finance business expansions and<br />
developments. Tax increment financing districts are established under the provisions of<br />
Minnesota Statutes, Section 469.174 through 469.179. Under that statute, cities use increased<br />
taxes generated by projects in TIF districts to pay off bonds issued to fund development costs.<br />
Identifying Effective <strong>Biomass</strong> Strategies: Page 101<br />
Quantifying Minnesota’s Resources and Evaluating Future Opportunities
The businesses compensate the cities by paying taxes they normally would have to pay<br />
regardless.<br />
TIF and JOBZ therefore are mutually exclusive. Companies in JOBZ zones do not pay property<br />
taxes that would be captured to pay TIF bonds.<br />
Although TIF is subject to state statute, the project’s home city administers it. The person with<br />
whom to begin a discussion of TIF is the city administrator in the municipality where the project<br />
will be located. A good introduction to the complicated TIF process is online at:<br />
www.fryberger.com/Admin_Gov.<br />
Economic Development Tax Abatement<br />
Minnesota Statutes Sections 469.1812 to 469.1815 created an alternative to TIF. A political<br />
subdivision may “abate” all or a portion of its property tax on one or more parcels of real or<br />
personal property, including machinery, for economic development purposes, subject to a<br />
duration limit and a limit on the amount of abatements. The “abatement” can take a number<br />
of different forms, including:<br />
• A rebate of property taxes to the property owner;<br />
• A reallocation of taxes to pay bondholders;<br />
• A reallocation of taxes to pay for public infrastructure costs; OR<br />
• A deferment of property taxes.<br />
Revision Date: August 23, 2006<br />
Minnesota Small Business Development Loan Program (SMDP)<br />
The Small Business Development Loan Program, administered by the Minnesota Department of<br />
Employment and Economic Development under the federal Revenue Expenditure and Control<br />
Act of 1968, makes fixed-asset, first-lien, fixed-rate loans to aid job growths and manufacturing<br />
expansions. The Minnesota Agricultural and Economic Development Board (MAEDB) funds the<br />
loans by issuing tax-exempt Industrial Development Bonds (IDBs), backed by a state reserve<br />
fund, at the prevailing tax-exempt market rate at the time of issue.<br />
The federal statute authorizing the program limits IDB eligibility to manufacturing industries, but<br />
co-generation projects by manufacturing companies may be eligible, as long as they increase<br />
employment and use some of the electricity in their processes. Bond counsel would determine<br />
eligibility.<br />
Assets financed by IRBs can be real estate, equipment, or a combination of the two. Total<br />
project costs can’t exceed $20 million. Although the program is authorized to lend up to 80% of<br />
project cost, SMBP usually makes loans ranging from $1 million to $5 million with a maximum term<br />
of 20 years. Collateral includes the assets financed and the owners’ personal guarantees.<br />
MAEDB does not charge a fee, but bond issuance costs of 4% are charged against the<br />
advance, and 10% of the bond issue is kept in an escrow account. Funds are disbursed upon<br />
execution of the required loan documents and sale of the bonds. DEED accepts applications<br />
year-round basis, but they must be received by the first of each month to be considered at that<br />
month's MAEDB meeting.<br />
Page 102<br />
Identifying Effective <strong>Biomass</strong> Strategies:<br />
Quantifying Minnesota’s Resources and Evaluating Future Opportunities
For more information, contact Paul A. Moe at 651-297-1391 or toll-free at 800-657-3858. See also:<br />
Small Business Development Loan - Annual Program Summary, report primarily for legislators.<br />
(Several commercial lenders also offer below-market financing using tax-exempt industrial<br />
revenue bonds. Call 651-297-1174 for further information.)<br />
Minnesota Investment Fund<br />
DEED’s Minnesota Investment Fund makes grants on a project-by-project basis to local units of<br />
government that they in turn use to make subordinated below-market-rate loans to expanding<br />
businesses for fixed-assets. (Note that the city receives a grant, but the company receives a<br />
loan.) Cities, counties, townships, and recognized Indian tribal governments are eligible grant<br />
recipients.<br />
The loans can finance 30% of the project’s capital cost up to a maximum of $500,000. 50% of<br />
other debt in the project must come from a commercial lender. The term is usually 10 years or<br />
less, and eligible industries are manufacturing and technology.<br />
For further information, go to: www.deed.state.mn.us/programs/mninvestfund<br />
Or contact:<br />
Meredith Udoibok, Acting Director<br />
Phone: 651.297.4132 or toll-free: 800.657.3858<br />
E-mail: Meredith.Udoibok@state.mn.us<br />
Website: www.deed.state.mn.us/bizdev/InvFd/<br />
Minnesota Border Cities Enterprise Zone Program<br />
The Border-Cities Enterprise Zone Program provides business tax credits (property tax credits,<br />
debt financing credit on new construction, sales tax credit on construction equipment and<br />
materials, and new or existing employee credits) to businesses existing in, or relocating to, the<br />
Border-Cities Enterprise Zone cities of Breckenridge, Dilworth, East Grand Forks, Moorhead, and<br />
Ortonville.<br />
All businesses are eligible except for recreation or entertainment concerns, fraternal or veteran's<br />
establishments, public utilities, financial institutions, and retail food or beverage service business<br />
operating under a franchise agreement that requires a location in the state. Businesses apply for<br />
tax credits through the local Enterprise Zone administrators.<br />
For additional information, contact Meredith Udoibok at 651-296-5005 or toll-free at 800-657-<br />
3858. See also: Border-Cities Enterprise Zone Program - Annual Program Summary, primarily for<br />
legislators.<br />
Minnesota Job Skills Partnership (MJSP)<br />
The Jobs Skills Partnership program makes grants up to $400,000 to accredited training institutions<br />
for customized, on-the-job training of incumbent employees. The company receiving the<br />
training provides a match to the grant, but the match can include in-kind contributions in the<br />
form of certain salaries, equipment, facilities and so on.<br />
Identifying Effective <strong>Biomass</strong> Strategies: Page 103<br />
Quantifying Minnesota’s Resources and Evaluating Future Opportunities
Contact:<br />
Paul D. Moe, Director<br />
Phone: 651-282-9814; Toll-free: 800-657-3858; TTY: 651-296-3900<br />
E-mail: Paul.Moe@state.mn.us Website: www.deed.state.mn.us/mjsp/<br />
Minnesota Indian Business Loan<br />
The Minnesota Indian Business Loan Program supports the development of Indian-owned and<br />
operated businesses to promote economic opportunities for Native American people<br />
throughout Minnesota. Eligible applicants are enrolled members of a federally recognized<br />
Minnesota-based band or tribe. Businesses receiving loans may operate anywhere in the state,<br />
but most are located on reservations. Eligible costs include start-up and expansion expenses<br />
(including those for machinery and equipment), inventory and receivables, working capital,<br />
new construction, renovation, and site acquisition. Refinancing of existing debt is not permitted.<br />
Each band or tribe receives funds from the Indian Business Loan Fund proportional to its number<br />
of enrolled members. The Department of Employment and Economic Development (DEED)<br />
administers the program and services loans, approved by the appropriate tribal council, that<br />
can cover up to 75% of project cost. Owners must provide between 5% and 10% of the<br />
financing needed to undertake the project, depending on the requirements of the lending<br />
band or tribe.<br />
DEED can accept applications, subject to the availability of funds, and forward them to the<br />
appropriate tribal council for further consideration, or applicants can send them directly to the<br />
council. Applications must include a business plan describing the business, its product or service,<br />
management, organization, market, operations, and financial projections. The tribal councils<br />
are:<br />
• Bois Forte Reservation, 218-757-3263;<br />
• Fond du Lac Reservation (Planning Division), 218-879-2642;<br />
• Grand Portage Reservation, 218-475-2279;<br />
• Leech Lake Band of Ojibwe, 218-335-8237;<br />
• Lower Sioux Community, 507-697-6185;<br />
• Mille Lacs Band of Ojibwe (Corp. Commission), 320-532-8817;<br />
• Prairie Island Community, 651-385-2554;<br />
• Red Lake Band of Chippewa, 218-679-3341;<br />
• Shakopee-Mdewakanton Community, 952-445-8900;<br />
• Upper Sioux Community, 320-564-3853;<br />
• White Earth Reservation, 218-983-3285.<br />
Bureau of Indian Affairs (BIA)<br />
Bureau of Indian Affairs Loan Guaranty Program<br />
The federal BIA Loan Guaranty Program guarantees loans made to tribe members up to 90% or<br />
a maximum of $500,000. For details, go to: www.doi.gov/bureau-indian-affairs<br />
Or contact:<br />
Minneapolis Area Credit Office<br />
Bishop Henry Whipple Federal Building<br />
One Federal Drive, Room 550<br />
Page 104<br />
Identifying Effective <strong>Biomass</strong> Strategies:<br />
Quantifying Minnesota’s Resources and Evaluating Future Opportunities
Fort Snelling, MN 55111-4007<br />
612-713-4400, Ext. 1181<br />
Minnesota Regional Development Commissions (RDCs)<br />
Regional development organizations are multi-county planning and development districts that<br />
promote cooperation among citizens, local government officials, and the private sector.<br />
Authorized by legislation in the late ’sixties and implemented in the early ’seventies, Minnesota’s<br />
9 Regional Development Commissions (RDCs) respond to economic development needs in rural<br />
communities.<br />
Each RDC is governed by a policy board that includes elected officials, business leaders and<br />
citizen representatives. Some administer JOBZ zones in their regions, and all provide area<br />
residents with a portal to state and federal development programs.<br />
The RDCs are good places for entrepreneurs to begin the complicated process of putting a<br />
project together. Professional staff provide technical assistance in business planning and<br />
finance. The RDCs are adept at packaging project financing from a host of diverse sources, an<br />
important skill considering that most economic development projects use a patchwork of<br />
programs to secure their necessary funding.<br />
The Regional Development Commissions are:<br />
Region Five Development Commission, serving Cass, Crow Wing, Morrison, Todd and Wadena<br />
Counties. Contact:<br />
Region Five Development Commission<br />
611 Iowa Ave. N.E. · Staples, MN 56479<br />
Phone: 1-218-894-3233, Fax: 1-218-894-1328 Email: info@regionfive.org<br />
Mid-Minnesota Development Commission, serving Kandiyohi,<br />
McLeod, Meeker and Renville Counties. Contact:<br />
MMDC<br />
333 Sixth Street SW, Suite 2<br />
Willmar, MN 56201-5615<br />
Phone: 320-235-8504; Toll Free: 1-800-450-8608; Fax: 320-235-4329<br />
Southwest Regional Development Commission, serving Lincoln, Lyon, Redwood, Pipestone,<br />
Murray, Cottonwood, Rock, Nobles and Jackson Counties. Contact:<br />
Southwest Regional Development Commission<br />
2401 Broadway Ave, Suite 1<br />
Slayton, MN 56172<br />
Phone: 507-836-8547, Fax: 507-836-8866. Email: srdc@swrdc.org<br />
The East Central Regional Development Commission, serving Chisago, Isanti, Kanabec, Mille Lacs<br />
and Pine Counties. Contact:<br />
East Central Regional Development Commission<br />
100 Park Street South<br />
Mora, MN 55051<br />
Phone: 320-679-4065; Fax: 320-679-4120; Bob Voss, Executive Director<br />
Identifying Effective <strong>Biomass</strong> Strategies: Page 105<br />
Quantifying Minnesota’s Resources and Evaluating Future Opportunities
West Central Initiative, serving Becker, Clay, Douglas, Grant, Otter Tail, Pope, Stevens, Traverse<br />
and Wilkin Counties. Contact:<br />
West Central Initiative<br />
1000 Western Avenue<br />
Fergus Falls, MN 56537<br />
Phone: 218-739-2239; Toll-Free: 800-735-2239; Fax:: 218-739-5381. www.wcif.org<br />
Headwaters Regional Development Commission, serving Beltrami, Clearwater, Hubbard, Lake of<br />
the Woods, and Mahnomen Counties. Contact:<br />
Headwaters Regional Development Commission<br />
403 Fourth Street NW, Suite 310 (P.O. Box 906)<br />
Bemidji, MN 56619-0906<br />
Phone: 218-444-4732; Fax: 218-444-4722; Email: hrdc@hrdc.org<br />
Upper Minnesota Valley Regional Development Commission, serving Big Stone, Chippewa, Lac<br />
Qui Parle, Swift, and Yellow Medicine Counties. Contact:<br />
Upper Minnesota Valley Regional Development Commission<br />
323 West Schlieman Ave.<br />
Appleton, MN 56208<br />
Phone: 320-289-1981; Fax: 320-289-1983; Email: umvrdc@umvrdc.org<br />
Arrowhead Regional Development Commission, serving Aitkin, Carleton, Cook, Douglas<br />
(Wisconsin), Koochiching, Lake and St. Louis Counties. Contact:<br />
Arrowhead Regional Development Commission<br />
221 West 1st Street<br />
Duluth, MN 55802<br />
Phone: 218-722-5545; Toll-Free: 800-232-0707; Fax: 218-529-7592(Fax)<br />
Email; info@ardc.org<br />
Region Nine Development Commission, representing Blue Earth, Nicollet, Brown, Faribault, Le<br />
Sueur, Martin, Sibley, Waseca and Watonwan Counties. Contact:<br />
Region Nine Development Commission<br />
410 E Jackson St. P.O. Box 3367<br />
Mankato, MN 56002, Suite 400<br />
Phone: 507-387-5643; Toll-Free:800-450-5643; Fax (507)387-7105<br />
The former Region Ten, encompassing Rice, Goodhue, Wabasha, Steele, Dodge, Olmsted,<br />
Winona, Freeborn, Mower, Fillmore and Houston Counties, is served by Southeastern Minnesota<br />
Development Corporation (SEMDC), which contracts with cities and counties in the region.<br />
Contact:<br />
Southeastern Minnesota Development Corporation<br />
111 West Jessie Street<br />
PO Box 684<br />
Rushford, MN 55971<br />
Phone: 507-864-7557; Fax: 507-864-2091; Email: ron.zeigler@semdc.com<br />
Page 106<br />
Identifying Effective <strong>Biomass</strong> Strategies:<br />
Quantifying Minnesota’s Resources and Evaluating Future Opportunities
USDA Rural Development<br />
Because biomass is mostly agricultural, USDA Rural Development programs can play a role in the<br />
development of biomass power. The agency offers programs both for economic development<br />
in general and for renewable energy development in particular. Following is a summary of<br />
USDA’s general economic development programs. <strong>Energy</strong>-specific programs appear later in<br />
this report.<br />
USDA Rural Development Business & Industry Loan Guarantees (B&I)<br />
Loan guarantees for businesses borrowing to save or create jobs, or to improve the local<br />
economy or environment in rural areas, are available for quality commercial loans of up to $10<br />
million. The Administrator in Washington may increase the limit to $25 million for high-priority<br />
projects, and the cap for agricultural cooperatives that process their commodities in rural areas<br />
increases to $40 million. There is no lower limit.<br />
Eligible areas are rural, as defined at: http://maps.ers.usda.gov/loanlookup/viewer.htm. In<br />
Minnesota, rural areas generally include all except: Duluth and adjacent cities; La Crescent;<br />
Minneapolis/St. Paul and approximately two rings of suburbs; Moorhead; Rochester; and St.<br />
Cloud and adjacent cities.<br />
Eligible lenders include most banks and commercial lenders, plus Farm Credit System institutions,<br />
CoBank, credit unions supervised by the NCUA, regulated insurance companies and the<br />
National Rural Utilities Cooperative Finance Corporation. Rural Utility Service borrowers and<br />
other non-traditional lenders may be considered for eligibility based upon their experience and<br />
expertise.<br />
Eligible borrowers are individuals, cooperatives, corporations, partnerships, non-profit<br />
corporations (except charitable or fraternal ones), Indian tribes or public bodies.<br />
Guaranteed percentage of the loan is negotiated with the agency. The maximum generally is<br />
80% for loans up to $5 million; 70% for loans between $5 and $10 million; and 60% for loans above<br />
$10 million.<br />
Fees charged by USDA Rural Development include a one-time, up-front fee of 2% of the amount<br />
guaranteed. A 0.25% annual fee will be applied to the guaranteed portion of the principal<br />
balance at fiscal year end.<br />
Rates and terms are negotiated between lender and borrower. Rates may be fixed or variable.<br />
Maximum term for working capital is 7 years, for machinery and equipment, 15 years and for real<br />
estate, 30 years. Balloons are not allowed.<br />
Minimum equity of 20% is required in a new business and 10% in an existing business. The<br />
borrower must provide regularly financial statements prepared in accordance with Generally<br />
Accepted Accounting Principles (GAAP).<br />
Collateral sufficient to secure the entire loan, after discounting in accordance with the bank’s<br />
normal policies, must be ensured by the lender, and personal and corporate guarantees are<br />
required of the borrower.<br />
Eligible purposes include buildings, equipment, and permanent working capital. The purchase<br />
of stock in a start-up cooperative is eligible, provided that such purchase is required of all<br />
Identifying Effective <strong>Biomass</strong> Strategies: Page 107<br />
Quantifying Minnesota’s Resources and Evaluating Future Opportunities
members, that the members are family-sized farms, and that commodities produced by its<br />
members are to be processed by the cooperative.<br />
Further Information about USDA business programs in general can be found at<br />
http://www.rurdev.usda.gov/rbs/busp/bpdir.htm. A copy of regulations (RD 4279-A and 4279-B<br />
for loan making and RD 4287-B for loan servicing) can be found on the Web at<br />
http://rdinit.usda.gov/regs/regs_toc.html in pdf, doc, and txt formats.<br />
USDA eForms that can be completed on a computer using Adobe Acrobat are available at<br />
http://forms.sc.egov.usda.gov/. This site lists USDA forms in zip format: www.usa-federalforms.com/itaop-by-form/200.html.<br />
Write to the Business Programs, Suite 410, 375 Jackson Street, St. Paul, MN 55101, call David<br />
Gaffaney at 651-602-7814 (TDD at 651-602-7830), or email: david.gaffaney@mn.usda.gov. You<br />
also may contact Robyn Jensen at 651-602-7812 or robyn.jensen@mn.usda.gov.<br />
USDA Rural Development Intermediary Re-lending Program (IRP)<br />
Program Purpose is to fund soft costs, like working capital, interest, feasibility studies, and<br />
professional services, and hard costs, like land, building construction or repair and equipment,<br />
for innovative business and community development projects.<br />
Intermediaries who borrow funds to relend to projects may be private nonprofit corporations,<br />
state or local governments, Indian tribes, or cooperatives. The ultimate recipients must be<br />
unable to obtain credit elsewhere.<br />
Eligible areas are rural, with a population less than 25,000.<br />
Maximum funding available to any one intermediary is $15 million, but each specific loan to that<br />
intermediary is limited to $750,000. The maximum loan to an ultimate recipient is the lesser of<br />
$250,000 or 75% of the total project cost. However, no more than 25% of an IRP loan approved<br />
may be used for loans to ultimate recipients that exceed $150,000. The interest rate to an<br />
intermediary is 1%. The maximum term is 30 years. Rates to ultimate recipients will be negotiated<br />
with the intermediary, with lower rates encouraged.<br />
Collateral can be real or personal property or other pledged security of the intermediary or<br />
ultimate recipient.<br />
Program funding in FY 2005 was $15.8 million nationwide.<br />
This program is administered by the B&I Division, Rural Development, Washington, D.C. 20250.<br />
However, applications are filed at the USDA Rural Development State Office, Suite 410, 375<br />
Jackson St., St. Paul, MN 55101. Phone: 651-602-7812 or 651-602-7791.<br />
Further Information about USDA business programs in general can be found at<br />
http://www.rurdev.usda.gov/rbs/busp/bpdir.htm.<br />
Iron Range Resources<br />
Headquartered in Eveleth, Minn., Iron Range Resources (IRR) is a unique state agency designed<br />
to help strengthen and diversify the economy of northeastern Minnesota. Specifically, Iron<br />
Range Resources serves the interests of the Taconite Assistance Area (TAA), a geographical<br />
Page 108<br />
Identifying Effective <strong>Biomass</strong> Strategies:<br />
Quantifying Minnesota’s Resources and Evaluating Future Opportunities
egion encompassing approximately 13,000 square miles that stretches from Crosby, Minn.,<br />
across the state's Cuyuna, Mesabi and Vermilion iron ranges to the North Shore of Lake Superior.<br />
The agency and its programs receive no money from the state general fund. The agency's<br />
funding comes from a percentage of production taxes assessed in lieu of property taxes on the<br />
area’s iron mining companies. The production tax provides approximately half of the agency's<br />
budget. The other half comes from non-mining sources, such as revenue from its facilities,<br />
interest earned on its fund accounts, and interest generated from its loan programs.<br />
The TAA includes much of Minnesota’s forests and many of its forest industries. Papermills and<br />
OSB/waferboard plants are biomass energy plants to begin with because they generate heat,<br />
steam and power from wood waste. But they have even greater potential to leverage biomass<br />
resources to produce larger amounts of energy, as we note elsewhere in this paper. A likely ally<br />
in that endeavor is Minnesota Power (MP), the Duluth-based utility that serves most of<br />
northeastern Minnesota. MP already has forged waste-to-energy partnerships with papermills in<br />
Duluth and Grand Rapids.<br />
The Taconite industry also is a player in biomass energy. U.S. Steel’s Minntac plant in Mountain<br />
Iron burns sawdust fuel supplied by Hill Wood Products in Cook, MN. Like papermills, taconite<br />
processing plants have untapped potential. MP is planning a series of co-generation facilities to<br />
capture waste heat from sources like Minntac. Much of that heat derives originally from fossil<br />
fuels, but MP’s plan at least conserves energy that otherwise would be wasted by venting it into<br />
the air.<br />
Two IRR programs that spur economic development will play an important role in the energy<br />
future of northeastern Minnesota: the Business Development Financing Program and the<br />
Venture Capital Investment Program.<br />
Iron Range Resources Business Development Financing<br />
The purpose of the Iron Range Resources' Business Development Financing program is to<br />
increase, expand and diversify the area’s economic base by assisting private investment in<br />
manufacturing or innovative technologies. It can finance up to 50% of eligible project costs for<br />
start-ups or expanding businesses. Preference will be given to:<br />
• Manufacturing or assembly operations<br />
• <strong>Project</strong>s which attract income and investment from outside of the TAA<br />
• Technologically innovative projects<br />
Except in equity stock purchases, Iron Range Resources requires personal guarantees from all<br />
company owners whose interest is 20% or more. Corporate guarantees will be required if a<br />
separate corporation owns 20% of the company seeking financial assistance from the agency.<br />
IRR Business Development Financing takes three forms: Bank Participation, Direct Loans, and<br />
Loan Guarantees.<br />
Bank Participation Loans: Iron Range Resources purchases a portion of a loan originating with a<br />
commercial bank or other regulated lender, sharing with the lender a first position lien on the<br />
financed assets and/or other assets as required. Generally, the participation by Iron Range<br />
Resources in any single project is limited to $250,000.<br />
The interest rate on the agency's purchased participation will be set as low as 3 percentage<br />
points beneath credit obligations of the United States Government with a comparable term, but<br />
Identifying Effective <strong>Biomass</strong> Strategies: Page 109<br />
Quantifying Minnesota’s Resources and Evaluating Future Opportunities
not less than 1%. The interest rate is set at the time the participation loan is approved by Iron<br />
Range Resources. The interest rate on the bank portion of the loan is negotiated between the<br />
business and the bank.<br />
Direct Loans: Iron Range Resources can make loans directly to the eligible business. Collateral is<br />
negotiable, but typically it includes a first lien on financed assets and/or other assets. The<br />
interest rate will be set at one percentage point below U.S. Government obligations with a<br />
comparable term, but not less than 3%. The interest rate is set at the time the loan is approved<br />
by Iron Range Resources.<br />
Loan Guaranties: Iron Range Resources will consider making a limited guarantee on a<br />
commercial loan to an eligible business. Terms and conditions of the guarantee are negotiated<br />
between the lender and the agency.<br />
Allowable Use of Proceeds:<br />
• Land and Building Acquisition<br />
• Building Renovation<br />
• Land Improvements<br />
• Machinery/Equipment Purchase<br />
• New Building Construction<br />
• Inventory Purchase<br />
If a project involves construction, the agency will participate only in take-out financing.<br />
Construction lending must be financed by another lender. Program financing cannot be used<br />
for debt refinancing or acquisition of an existing business.<br />
The approval process begins with review of the pre-application by the agency's Development<br />
Strategies Division. If the pre-application meets guidelines for eligibility, the agency sends a full<br />
application to the applicant.<br />
For more information, contact Development Strategies Division at Iron Range Resources. Phone:<br />
218-744-7400; Toll-free: 1-877-829-3936;<br />
Email: DevelopmentStrategies@IronRangeResources.org.<br />
Iron Range Resources Venture Capital Investment Program<br />
IRR is unusual among public economic development agencies in offering venture capital as well<br />
as debt financing. It seeks to invest its venture funds in technologically innovative firms located<br />
in its region.<br />
Technology-based businesses may qualify for equity investments including, but not limited to:<br />
• common stock<br />
• preferred stock<br />
• convertible debentures<br />
The agency investment is at par with other private and/or public investors. The agency<br />
traditionally partners with a lead investor when considering such investments.<br />
Businesses that seek Venture Capital Investment must have a technology component,<br />
demonstrate a commitment to the region by planning to locate a portion of its business within<br />
Page 110<br />
Identifying Effective <strong>Biomass</strong> Strategies:<br />
Quantifying Minnesota’s Resources and Evaluating Future Opportunities
the boundaries of the Taconite Assistance Area, and employ residents of the area. Iron Range<br />
Resources may require that stock options or warrants be tendered to the agency. Generally,<br />
the agency makes passive investments, but it sometimes requires a seat on the Board of<br />
Directors. The agency's seeks to exit the investment in 5-10 years.<br />
Applications will be evaluated on:<br />
• Management character and capability<br />
• Economic viability of business<br />
• Potential impact to area<br />
• Marketability of product(s)<br />
• Existing or potential competition<br />
• Exit strategy<br />
Contact Development Strategies Division at Iron Range Resources for more information. Phone:<br />
218-744-7400; Toll-free: 1-877-829-3936;<br />
E-mail: DevelopmentStrategies@IronRangeResources.org<br />
New Markets Tax Credits<br />
The New Markets Tax Credit (NMTC) program was enacted in December 2000 as part of the<br />
bipartisan Community Renewal Tax Relief Act. The purpose of the NMTC is to spur private<br />
investment in low-income urban and rural communities. The program is based on the idea that<br />
there are viable business opportunities in low-income communities and that a federal tax credit<br />
would provide attractive incentive to increase the flow of investment capital to such areas.<br />
Between 2002 and 2007, the NMTC will provide for up to $15 billion in investments in low-income<br />
communities. The Community Development Financial Institutions (CDFI) Fund of the U.S. Treasury<br />
Department administers the NMTC program.<br />
What is a Community Development Entity (CDE) and how are CDEs certified The investment<br />
vehicle for the NMTC is a Community Development Entity (CDE). An organization must be<br />
certified by the CDFI Fund as a CDE to be eligible for NMTCs. Two important considerations for<br />
certification are that the organization must have a track record and demonstrate accountability<br />
to the community. After receiving certification, a CDE may then apply for credits through an<br />
annual competition conducted by the CDFI Fund. CDEs successful in receiving an allocation<br />
must have a strong business plan, good management, proven track record of working with<br />
investors and proposed projects that will have a substantial impact in low-income communities.<br />
In March 2003, the CDFI Fund made its first allocation of $2.5 billion in NMTCs to a total of 66<br />
CDEs. Over 300 Community Development Entities (CDEs) applied in the first round, requesting<br />
$26 billion in credits.<br />
How does a CDE market the credit to investors Once an allocation has been awarded, a CDE<br />
must then seek private investment in exchange for the credit. The CDE has five years to place<br />
the credits, after which time the credits can be recaptured and transferred to another CDE.<br />
Corporate and individual taxpayers may receive a federal tax credit of 39% over seven years in<br />
return for their equity investment in a CDE. With the proceeds from these equity investments,<br />
CDEs must provide investments of equity, loans, lines of credit and technical assistance to<br />
qualified businesses. CDEs have one year to place the funds in qualified investments. In<br />
general, if substantially all (i.e. 85%) of the proceeds from the credit are not placed in qualified<br />
investments, the CDE would be out of compliance. At that point, recapture penalties would be<br />
applied to the investor.<br />
Identifying Effective <strong>Biomass</strong> Strategies: Page 111<br />
Quantifying Minnesota’s Resources and Evaluating Future Opportunities
An equity investment qualifies for the tax credit if:<br />
1. such credit is acquired by the investor at its original issue solely in exchange for cash;<br />
2. substantially all of such cash is used by the CDE to make a qualified low-income<br />
community investment; and<br />
3. the investment is designated by the CDE as a qualified equity investment which may also<br />
include the purchase of a qualified equity investment from a prior holder.<br />
What is a Qualified Low-income Community Investment Qualified low-income community<br />
investments may include loans, lines of credit, debt, direct equity investments, purchase of<br />
certain loans made by other CDEs, related services to other businesses, and counseling to other<br />
CDEs.<br />
Substantially all of the investment must be used, meaning 85% of the cash received from the<br />
taxpayer in return for the tax credit must be directly traceable to a qualified low-income<br />
community investment, or 85% of the aggregate gross assets of the CDE must be deployed in<br />
qualified activities.<br />
What areas are eligible for the tax credit Areas eligible for the tax credit are low-income<br />
communities defined as a census tract with a poverty rate of at least 20% or with median<br />
income of up to 80% of area median or statewide median, whichever is greater; or for nonmetro<br />
census tracts 80% of statewide median.<br />
Figure VII-2: Minnesota New Market Tax Credit Map<br />
The NMTC may also be used in target areas. A target area is a community within a census tract<br />
that does not meet the poverty or median income standard. The target area provision allows<br />
Page 112<br />
Identifying Effective <strong>Biomass</strong> Strategies:<br />
Quantifying Minnesota’s Resources and Evaluating Future Opportunities
certain communities located in ineligible census tracts to participate in the program. Such<br />
communities must have pre-existing boundaries such as established neighborhoods, or political<br />
or geographic boundaries; meet the poverty rate or median income standard; and have a<br />
demonstrated lack of investment capital.<br />
What businesses qualify for investments Businesses eligible to receive qualified low-income<br />
investments are those corporations or partnerships (including sole proprietorships or<br />
unincorporated trades or businesses) that are active and located in low-income communities.<br />
The business must derive at least half its gross income from activity (i.e. sales, manufacturing) in<br />
the eligible area. In addition, a substantial portion of its tangible property as well as services<br />
performed by employees of the business must be in an eligible community. CDEs may also<br />
provide investments to qualified active low-income businesses that are owned in whole or in part<br />
by the CDE.<br />
Are there any other investment limitations Financing of low-income rental housing is not<br />
allowed under the NMTC, and the NMTC may not be combined with other federal tax subsidies,<br />
including the Low-income Housing Tax Credit. Rental property that derives 80% or more of its<br />
income from residential tenants is not eligible. However, a mixed-use development, where less<br />
than 80% of the property's gross income is rental income from dwelling units is allowed under<br />
NMTC.<br />
Conclusion. The broad distribution of NMTCs from the first round of allocations allows for any<br />
community in America—urban or rural—to take advantage of this unique opportunity to build a<br />
stronger and more diverse economy. Of the 66 CDEs receiving allocations, 16 target a specific<br />
city or county, six target more than one city or county, 17 will conduct statewide programs, and<br />
27 will work in more than one state. Of those 27, 15 are nationwide. Now that the opportunity<br />
has been made available to previously undercapitalized communities, the challenge is to make<br />
it work. For more information, contact:<br />
Lynne Rudolph<br />
Community Reinvestment Fund<br />
801 Nicollet Mall, Suite 1800W<br />
Minneapolis, MN 55402<br />
Phone: 612-338-3050<br />
e-mail: lynne@crfusa<br />
Website: www.crfusa.com<br />
U.S. Small Business Administration<br />
SBA 7a Term Loan Guaranty Program<br />
The U.S. Small Business Administration's 7a program provides loan guarantees to approved banks<br />
and some other approved lenders. In the event of default by the borrowing Small Business<br />
Concern (SBC), the SBA is willing to reimburse up to 85% of the loss that the lender would<br />
otherwise sustain. Consequently, lenders may be willing to accept a greater credit risk and<br />
grant more favorable terms than they might otherwise. SBA also has a revolving line of credit<br />
loan guaranty program but very few banks are willing to participate. SBCs that are poor credit<br />
risks or fail to clearly articulate their ability to repay the loan will probably be rejected.<br />
Identifying Effective <strong>Biomass</strong> Strategies: Page 113<br />
Quantifying Minnesota’s Resources and Evaluating Future Opportunities
Loan Amount. $100,000 to $2 million. Although the SBA encourages lenders to make loans as<br />
low as $10,000, the paperwork is too extensive and the bank's set up costs too high to make<br />
small loans cost effective. However, smaller banks are often motivated to consider lower loan<br />
amounts conventionally and through SBA for existing customers with creditworthy proposals.<br />
Some large banks consider making smaller Express Loans to existing businesses with a strong<br />
history of cash flow. Two banks make Community Express Loans to under-served borrowers in the<br />
$5,000 to $50,000 range and may accept tainted credit histories and no collateral.<br />
Suitable Borrowers. For-profit SBCs with good credit (business and owners) and a history of<br />
sufficient cash flow. Some small community banks make loans to start-up SBCs and require more<br />
cash assets, collateral and experienced ownership. SBA defines the maximum size of the<br />
business by industry and is based upon ether gross revenues or number of employees. Most SBCs<br />
qualify. A few industry types are excluded from SBA programs.<br />
Purpose of the Loan. To expand, acquire or start a small business. Weaker proposals normally<br />
require substantial collateral, such as real estate while stronger proposals are sometimes<br />
accepted with less substantial collateral, such as fixtures and equipment.<br />
Loan to Collateral Value or Cost. Up to 90% of cost or value is possible for well-established SBCs<br />
with quality collateral. 70-80% more typical for most start-ups. Lenders have other critical ratios<br />
related to cash flow, liquidity and assets that limit the loan amount available. Credit<br />
requirements, collateral prerequisites, cash flow minimums and loan amounts vary among SBA<br />
approved lenders. Most have requirements that are more severe than the minimum<br />
acceptable to SBA. Be sure to understand what your lender requires before you make<br />
application. Please go to www.sba.gov/financing/index.html for details on SBA's financing<br />
programs.<br />
SBA 504 Program<br />
The U.S. Small Business Administration's 504 program is intended to create jobs based upon a<br />
formula that has been modified several times over the years. Particular preference is given to<br />
rural, economically disadvantaged areas and minority and female applicants for which SBA<br />
may waive the job creation requirement. The loan proceeds must be used to finance long-term<br />
assets such as real estate and fixtures which makes the program ideal for construction, for<br />
expansion of manufacturing facilities and other job intensive structures.<br />
Loan Amount. Typically $250,000 and up. Because of the complicated processing, lower loan<br />
amounts are often relegated to other loan programs and higher amounts may be too risky for<br />
most lenders. 504 loans are processed by SBA-licensed Certified Development Corporations<br />
(CDC). The CDC creates a SBA guaranteed subordinated debenture (similar to a 2nd<br />
mortgage). The debenture, up to $1.5 million ($4 million for manufacturing) is piggy-backed with<br />
a conventional first mortgage of any amount. It's usually provided by a local bank. The<br />
borrowing Small Business Concern (SBC) makes one payment to the CDC which is then<br />
proportionately paid to the bank and to the trustee for the debenture holder.<br />
Interest rate. The debenture rate is fixed at closing at a rate close to treasury securities of like<br />
term. Banks may charge a fixed or floating market rate for their conventional portion along with<br />
points and fees. The result is a blended rate to the SBC. The CDC also charges fees.<br />
Term. The SBA portion is usually 20 years and the conventional portion is usually 10 years.<br />
Page 114<br />
Identifying Effective <strong>Biomass</strong> Strategies:<br />
Quantifying Minnesota’s Resources and Evaluating Future Opportunities
Suitable borrowers. For-profit SBCs with a history of success in the same industry for which the<br />
funds are to be used. There are some company size and industry type exclusions.<br />
Loan to collateral value or cost. Up to 90% of the cost for existing SBCs, 85% for start-ups. A<br />
classic percentage approved by SBA is where the bank's conventional loan is 50%, the<br />
debenture is 40% and the SBC provides 10% or more. An example financing of a $1,875,000<br />
plant expansion might look like this:<br />
• $750,000 -- SBA Subordinated debenture @ 6% fixed for 20 years.<br />
• $937,500 -- Bank conventional loan @ 8%, 10 years adjustable every 3 years.<br />
• $1,687,500 -- Total loan @ blended rate and term.<br />
• $187,500 -- Minimum cash requirement from SBC<br />
• $1,875,000 -- Total plant expansion<br />
The 504 loan has numerous fees, requirements and restrictions. Begin by locating the CDC<br />
covering your area to discuss the specific proposal. See www.sba.gov/financing/sbaloan/<br />
cdc504.html for details<br />
<strong>Energy</strong>-Specific Incentive Programs<br />
As noted earlier, many energy incentives promote conservation and efficiency rather than<br />
production. And some that do promote production focus on a broad variety of small<br />
technologies of farm, household or small business scale, not utility scale. The following list of<br />
programs concentrates on those particularly relevant to biomass plants or cogeneration<br />
projects.<br />
For a complete summary of federal and state energy programs, go to: http://www.dsireusa.org<br />
The Federal Renewable Electricity Production Tax Credit (REPC)<br />
Although cogeneration long has been, and probably will continue to be, the predominant<br />
source of renewable biomass energy in the nation, it so far has gotten short shrift from<br />
government programs, perhaps on the theory that cogeneration is its own reward. An example<br />
noted elsewhere in this paper, the U.S. pulp and paper industry, has for more than a century<br />
used waste wood to generate thousands of megawatts of electricity for internal use -- not<br />
because of mandates or incentives, but because cogeneration saves money.<br />
As a result of those intrinsic economic benefits, policy makers haven’t seen fit to create<br />
incentives for co-generation comparable to those for dedicated biomass power. “Closed-loop”<br />
biomass energy from dedicated energy crops rather than residues has received an annual<br />
federal tax credit of 1.9 cents per kWh since 1992. But a credit for “open-loop” biomass (i.e.,<br />
manufacturing residues, agricultural waste, landfill gas and municipal solid waste) didn’t appear<br />
until 2004 in the American Jobs Creation Act (H.R. 4520). It gave a reduced credit of just 1 cent<br />
to open-loop biomass -- but added the full 1.9 cent credit to refined coal.<br />
For the IRS form on the credit, go to: (www.irs.gov/pub/irs-pdf/f8835.pdf.)<br />
The REPC has been extended, expanded or modified through a series of seven federal statutes<br />
beginning with the <strong>Energy</strong> Policy Act of 1992. For a full history, go to: http://www.dsireusa.org/<br />
library/includes/incentive2.cfmIncentive_Code=US13F&State=federal¤tpageid=1&ee=0<br />
&re=1<br />
Identifying Effective <strong>Biomass</strong> Strategies: Page 115<br />
Quantifying Minnesota’s Resources and Evaluating Future Opportunities
The Federal Renewable <strong>Energy</strong> Production Incentive (REPI)<br />
The REPI program, which originated in the same <strong>Energy</strong> Policy Act of 1992 as the REPC outlined<br />
above, differs in that it offers not tax deductions to for-profit companies but cash payments to<br />
non-profit organizations which, having no profits, have no use for deductions. In 1993, the cash<br />
payment was 1.5 cents/kWh, but it is indexed to increase with inflation. Since REPI is the nonprofit’s<br />
alternative to the for-profit REPC, only new facilities owned by state and local<br />
governments like municipal utilities, or by not-for-profit electric co-operatives that began<br />
processing renewables between October 1, 1993, and September 30, 2003, are eligible. In 2005,<br />
Minnesota utilities received a total of $316,847 from the program.<br />
Like the REPC, the REPI program shows a preference for closed-loop biomass. It assigns<br />
renewable projects to one or the other of two tiers. Tier One includes solar, wind, geothermal,<br />
and closed-loop biomass projects. Tier Two includes open-loop biomass projects such as landfill<br />
gas, digester gas, and agricultural and manufacturing wastes, and co-firing with other fuels. If<br />
appropriations fall short of making 100% of payments to all projects, Tier One projects receive<br />
their entire payments first; Tier Two projects divide what’s left.<br />
General information on REPI is available at: http://www.dsireusa.org/library/includes/<br />
incentive2.cfmIncentive_Code=US33F&State=federal¤tpageid=1&ee=1&re=1<br />
While the private sector’s REPC tax deduction program is managed by the IRS, the U.S.<br />
Department of <strong>Energy</strong> administers the non-profits’ REPI program. DOE’s web page REPI is:<br />
http://www.eere.energy.gov/wip/repi.html<br />
Two DOE information officers are assigned to respond to inquiries about the program. The one<br />
to ask about policy issues and the availability of appropriations is: dan.beckley@hq.doe.gov<br />
Implementation questions, like facility qualifications, applications and payments, go to:<br />
christine.carter@go.doe.gov<br />
For general federal information on renewable energy go to: http://www.eere.energy.gov<br />
Minnesota Renewable <strong>Energy</strong> Production Incentive<br />
As its title indicates, this program, dating from1997, mirrors the federal REPI program in offering<br />
cash payments, in this case 1 to 1.5 cents/kWh, to certain types of renewable energy producers<br />
over a ten year term. But it differs in that it offers those incentives not only to non-profits but also<br />
to commercial companies, residences and tribal councils. It differs further in specifying a<br />
narrower selection of eligible project types: wind, hydro and anaerobic digestion. The wind<br />
program was closed to new applicants as of January, 2005.<br />
The program was developed for small-scale projects: wind generators below 2 MW total, and<br />
on-farm anaerobic digesters.<br />
Further information is available at:<br />
http://www.dsireusa.org/library/includes/incentive2.cfmIncentive_Code=MN06F&state=MN&C<br />
urrentPageID=1&RE=1&EE=1<br />
The Minnesota Department of Commerce website has a chart with useful thumbnail descriptions<br />
of all federal and state renewable energy and energy efficiency incentives at:<br />
Page 116<br />
Identifying Effective <strong>Biomass</strong> Strategies:<br />
Quantifying Minnesota’s Resources and Evaluating Future Opportunities
http://www.state.mn.us/portal/mn/jsp/content.doid=-536881350&subchannel=-<br />
536881511&contentid=536885915&contenttype=EDITORIAL&programid=536885394&sp2=y&sc3=<br />
null&sc2=null&agency=Commerce<br />
The Minnesota Department of Commerce <strong>Energy</strong> Info Center is a good source of current<br />
information on energy development incentives in general. Go to:<br />
http://www.state.mn.us/portal/mn/jsp/content.dosubchannel=-536881511&id=-<br />
536881350&agency=Commerce or call Linda Limback at 651-615-1883.<br />
USDA Renewable <strong>Energy</strong> Systems and <strong>Energy</strong> Efficiency Improvements<br />
Loan guarantees and grants may be available to help agricultural producers and rural small<br />
businesses (fewer than 500 employees and less than $20 million in annual sales) purchase<br />
renewable energy systems and improve energy efficiency. “Rural” is defined as an area with<br />
less than 50,000 population.<br />
Renewable energy means energy derived from wind, solar, biomass, or a geothermal source; or<br />
hydrogen derived from biomass or water using one of those energy sources. The program does<br />
not include hydro-power. <strong>Biomass</strong> includes agricultural crops, trees grown for energy<br />
production, wood waste and wood residues, plants (including aquatic plants and grasses),<br />
residues, fibers, animal and other wastes, fats, oils, and greases, but not paper commonly<br />
recycled or unsegregated solid waste.<br />
The grant cannot exceed 25% of the cost of the project cost. To be eligible, the applicant must<br />
demonstrate financial need. Grants for renewable energy systems range from $2,500 to<br />
$500,000 and those for energy efficiency improvements arrange from $2,500 to $250,000.<br />
Applicants must be citizens of the U.S. or legally admitted for permanent residence.<br />
Total funds available nationwide for grants each year are approximately $11.5 million. $175<br />
million in loan guarantees are available each year. Combinations of guaranteed loans and<br />
grants cannot exceed 50% of the eligible project costs. Deadline to apply for grants is usually<br />
May. Loan guarantee applications are received all year.<br />
For further information call Lisa Noty at 507-373-7960, extension 120, or email<br />
lisa.noty@mn.usda.gov. Or go to www.rurdev.usda.gov/rbs/farmbill/06fbnofa.htm.<br />
USDA Rural Development Value-added Producer Grant (VAPG)<br />
The VAPG program assists development of value-added products or renewable energy from<br />
agricultural production, focusing on projects at farm scale.<br />
Grants up to $100,000 are available for planning and feasibility studies and up to $300,000 for<br />
working capital.<br />
Eligible ventures are those that develop renewable energy from agricultural production and/or<br />
use innovative technologies to develop value-added products. All ventures must be<br />
economically viable and sustainable. Of the four categories of value-added under this<br />
program, two are energy-related: (1) adding value through changing the physical state or form<br />
of the products (e.g. processing corn into ethanol); and (2) using agricultural products to<br />
produce renewable energy on a farm or ranch.<br />
Identifying Effective <strong>Biomass</strong> Strategies: Page 117<br />
Quantifying Minnesota’s Resources and Evaluating Future Opportunities
Terms. The grant will not exceed 50% of eligible project costs. Grant recipients must provide<br />
one-to-one matching funds. <strong>Project</strong>s must be completed within one year. Smaller grant<br />
requests receive priority points.<br />
Applications are received at the USDA Rural Development State Office in St. Paul following the<br />
announcement in the Federal Register inviting applications. Selections will be made annually in<br />
the USDA Rural Development National Office for fiscal years 2002-2007.<br />
Further Information is available from Robyn (651-602-7812), Butch (218-681-2843, ext. 114), or Lisa<br />
(507-373-7960, ext.120).<br />
<strong>Xcel</strong> <strong>Energy</strong> Renewable Development Fund Grants<br />
The Renewable Development Fund (RDF) was created in 1999 to provide grants, through a<br />
Request for Proposals process, for research and for new projects to produce renewable energy<br />
including wind, solar, hydroelectric and fuel cells as well as biomass. The program’s first round of<br />
grants in 2001 awarded a total of $16 million to 19 projects. For the second round in 2005, the<br />
Minnesota Public Utilities Commission approved 29 projects totaling nearly $37 million.<br />
Funding is roughly divided equally between R&D and projects that directly result in the<br />
production of renewable energy. In May of 2007, the third round of funding was announced,<br />
with up to $23 million available to invest in new ways to produce electricity from renewable<br />
resources. The Fund is a member of CESA, the Clean <strong>Energy</strong> States Alliance.<br />
This paper was funded through the RDF.<br />
Tribal <strong>Energy</strong> Program<br />
Tribes may take advantage of a number of the programs listed above. But in addition, the U.S.<br />
Department of <strong>Energy</strong>’s Office of <strong>Energy</strong> Efficiency and Renewable <strong>Energy</strong> has developed a<br />
program aimed specifically at tribes, the Tribal <strong>Energy</strong> Program. It offers financial and technical<br />
assistance for feasibility studies and shares the cost of installing renewable energy systems on<br />
tribal lands.<br />
For a full account of the program’s many aspects, go to:<br />
www.eere.energy.gov/tribalenergy/<br />
Or contact the director of the program:<br />
Thomas Sacco<br />
Weatherization & Intergovernmental Program<br />
U.S. Department of <strong>Energy</strong>, EE-2K<br />
Forrestal Building, MS 5G-045<br />
1000 Independence Avenue SW<br />
Washington, DC 20585<br />
Telephone: (202) 586-0759<br />
Fax: (202) 586-1605<br />
Email: Thomas.Sacco@ee.doe.gov<br />
Page 118<br />
Identifying Effective <strong>Biomass</strong> Strategies:<br />
Quantifying Minnesota’s Resources and Evaluating Future Opportunities
NEW POLICY INITIATIVES<br />
Community-Based <strong>Energy</strong> Development (C-BED)<br />
In 2005 the Minnesota Legislature passed legislation requiring Minnesota’s utilities to offer a<br />
community-based energy development (C-BED) tariff for wind power generators. In the 2007<br />
legislative session the tariffs were extended to all renewable energy projects, including biomass.<br />
The original goal of the tariffs was “to optimize local, regional, and state benefits from wind<br />
energy development, and to facilitate development of community-based wind energy projects<br />
throughout Minnesota”. This is accomplished through a specific rate structure made available<br />
to locally owned renewable energy projects that would have difficulty securing financing under<br />
traditional rate structures. A C-BED tariff offers a higher rate during the first 10 years of the<br />
contract than during the final ten years, but is structured in such a way that the present value of<br />
the project for the utility is equal to that of a typical rate agreement. This greatly improves the<br />
viability of the project for project developers by increasing revenues during debt repayment, but<br />
does not detract from the net present value of the project from the utility’s perspective.<br />
The C-BED tariffs are available to projects for which at least 51% of gross revenues from the<br />
power purchase agreement will flow to qualifying owners. Qualifying owners include Minnesota<br />
residents, limited liability companies composed of Minnesota residents, Minnesota cooperatives<br />
and non-profits, or Minnesota political subdivisions and local governments. There are additional<br />
limits to individual ownership of C-BED projects. Minnesota’s public utilities must submit for<br />
approval new C-BED tariffs to the Public Utilities Commission by December 1, 2007. Other utilities<br />
must submit new C-BED tariffs within 90 days of the Commission’s approval of a public utility tariff.<br />
More information concerning C-BED tariffs can be found at:<br />
http://www.revisor.leg.state.mn.us/bin/bldbill.phpbill=S0145.2.html&session=ls85<br />
http://www.c-bed.org/index.html<br />
http://www.dsireusa.org/library/includes/incentive2.cfmIncentive_Code=MN15R&state=MN&C<br />
urrentPageID=1&RE=1&EE=1<br />
Minnesota’s Renewable <strong>Energy</strong> Standard<br />
Minnesota enacted a Renewable <strong>Energy</strong> Standard in 2007 that is among the most aggressive in<br />
the nation. Under the legislation, renewable electricity must account for 30% of <strong>Xcel</strong> <strong>Energy</strong>’s<br />
total retail electricity sales by 2020, and 25% of the retail electricity sales of other utilities by 2025.<br />
Eligible technologies under the standard include solar, wind, hydroelectric facilities less than 100<br />
megawatts (MW), hydrogen and biomass, which include landfill gas, anaerobic digestion and<br />
municipal solid waste as well as plants and trees. The legislation also orders the Public Utilities<br />
Commission to establish a program for tradable Renewable <strong>Energy</strong> Credits (RECs) by January 1,<br />
2008. This will enable utilities which have not generated, or have not contracted for, sufficient<br />
renewable energy to purchase RECs to meet their requirements.<br />
While wind is the renewable energy utilities will use most to meet the RES, biomass power should<br />
get a boost from the legislation as well. <strong>Biomass</strong>’s ability to provide baseload power may be<br />
particularly attractive to utilities because the standard is based on energy sales rather than<br />
capacity. (Because wind blows only part of the time, turbine capacities are much greater than<br />
actual production.) But biomass power costs will have to be reasonably competitive because<br />
Identifying Effective <strong>Biomass</strong> Strategies: Page 119<br />
Quantifying Minnesota’s Resources and Evaluating Future Opportunities
escape clauses in the legislation relax the standard if meeting it will be prohibitively expensive.<br />
This gives utilities leverage to keep the cost of renewable power down.<br />
Information regarding the bill is available at:<br />
http://ros.leg.mn/bin/getpub.phptype=law&year=2007&sn=0&num=3<br />
http://www.dsireusa.org/library/includes/incentive2.cfmIncentive_Code=MN14R&state=MN&C<br />
urrentPageID=1&RE=1&EE=1.<br />
Carbon Emissions Policy<br />
Minnesota’s Next Generation <strong>Energy</strong> Act of 2007 set out specific goals to reduce greenhouse<br />
gas emissions in Minnesota and established a framework to guide the development of policies<br />
to achieve those goals. The act says “it is the goal of the state to reduce statewide greenhouse<br />
gas emissions across all sectors producing those emissions to a level at least 15% below 2005<br />
levels by 2015, to a level at least 30% below 2005 levels by 2025, and to a level at least 80%<br />
below 2005 levels by 2050. The levels shall be reviewed based on the climate change action<br />
plan study.” The law directs state agencies to submit to legislature by February 1, 2008 a climate<br />
change action plan involving a cap and trade system for greenhouse gas emissions and a state<br />
emissions registry. The plan also must develop a statewide or regional inventory of renewable<br />
energy resources.<br />
The legislation induces further legislation establishing an enforceable legal framework for<br />
lowering greenhouse gas emissions over time. It prohibits the construction of any new large<br />
energy facilities that would increase the state’s greenhouse gas emissions prior to the<br />
enactment of such legislation except for those that already have initiated regulatory<br />
proceedings in Minnesota or nearby states.<br />
This law establishes a very clear intent to begin reducing Minnesota’s greenhouse gas emissions<br />
with specific reference to the state’s electrical utilities. In such an environment one would<br />
expect the state’s utilities to show increased interest in creating power from renewable resources<br />
with small carbon footprints.<br />
More information regarding Minnesota’s Next Generation <strong>Energy</strong> Act of 2007 can be found at<br />
http://www.revisor.leg.state.mn.us/bin/bldbill.phpbill=S0145.2.html&session=ls85.<br />
Other State Policies<br />
The 2007 legislature enacted a number of policies of interest to bio-power developers which<br />
included appropriations for bio-energy projects.<br />
NextGen <strong>Energy</strong> Board<br />
The Next Generation <strong>Energy</strong> Act 0f 2007, a $170 million omnibus energy bill signed in May of<br />
2007, will spur research and recommendations on how the state can most efficiently achieve<br />
energy independence. Major items include funds and support for the state’s renewable<br />
resources goal of 25% by 2025; renewable energy research; biomass research and renewable<br />
forest resources feasibility studies; plug-in hybrid electric vehicles demonstrations; increasing the<br />
number of E85 pumps; increasing the number of on-farm biogas recovery facilities or methane<br />
digesters; and increasing the number of certified <strong>Energy</strong> Star commercial buildings in the state.<br />
Page 120<br />
Identifying Effective <strong>Biomass</strong> Strategies:<br />
Quantifying Minnesota’s Resources and Evaluating Future Opportunities
The <strong>Energy</strong> Act also established the NextGen Board charged with addressing the future of<br />
biofuels and the development of grant programs to assist renewable energy facilities throughout<br />
Minnesota.<br />
The NextGen Board was given advisory status to the Department of Agriculture in the allocation<br />
of grant money as well as policy authority to support bioenergy projects. Its role is described<br />
below.<br />
The NextGen <strong>Energy</strong> Board will examine the future of fuels, such as synthetic gases,<br />
biobutanol, hydrogen, methanol, biodiesel, and ethanol within Minnesota; develop<br />
equity grant programs to assist locally owned facilities; study the proper role of the state<br />
in creating financing and investing and providing incentives; evaluate how state and<br />
federal programs, including the Farm Bill, can best work together and leverage<br />
resources; work with other entities and committee to develop a clean energy program;<br />
and report to the legislature with recommendations as to appropriations and results of<br />
past actions and projects (“Governor Pawlenty”, 2007).<br />
For more information see http://www.mda.state.mn.us/renewable/nextgen/default.htm<br />
Reinvest in Minnesota Clean <strong>Energy</strong> Program<br />
A clean energy working lands program will be established to acquire easements for land “based<br />
on its potential benefits for bioenergy crop production, water quality, soil health, reduction of<br />
chemical inputs, soil carbon storage, biodiversity, and wildlife habitat.” Lands enrolled in this<br />
program may attract bio-power facilities to use various biomass fuels through a stepped<br />
incentive.<br />
For more information see<br />
http://ros.leg.mn/bin/getpub.phptype=law&year=2007&sn=0&num=57.<br />
Cellulosic Biofuel Development<br />
Minnesota has established a goal to produce sufficient cellulosic biofuels to equal one quarter<br />
of the ethanol necessary to meet the state’s ethanol content requirement for gasoline.<br />
Cellulosic biofuel facilities built to meet that goal might include biomass power generation.<br />
For more information see<br />
http://ros.leg.mn/bin/getpub.phptype=law&year=2007&sn=0&num=45.<br />
Identifying Effective <strong>Biomass</strong> Strategies: Page 121<br />
Quantifying Minnesota’s Resources and Evaluating Future Opportunities
CHAPTER VIII : ECONOMIC EVALUATIONS<br />
Figure VIII-1: Start-Up Screen<br />
BIO-POWER EVALUATION TOOL (BIOPET)<br />
This computer tool was developed as part of this project’s overall effort to provide general<br />
guidance in estimating costs of various biomass feedstocks and technological strategies. It is<br />
meant to provide a means of comparing various biomass strategies; not cost estimates detailed<br />
enough to use for a specific project. It allows a relative comparison among varying strategies<br />
but not a firm pro forma for a particular one.<br />
The tool allows the user to estimate the annual levelized cost of energy for a proposed power<br />
plant based on supply and cost estimates for a range of biomass fuels and power plant<br />
characteristics. Although we provide default values most characteristics; users can to assign<br />
their own values if they have more specific cost estimates or wish to gauge the effects of<br />
changing parameters on project performance. Factory default values are retained within the<br />
spreadsheet and always can be restored if necessary.<br />
The Bio-Power Evaluation Tool consists of worksheets to estimate feedstock costs and supply,<br />
power plant characteristics and costs, and overall project economics. Users can save feedstock<br />
and power plant scenarios as they work and combine those scenarios to assess what<br />
combinations of feedstocks and power plants will result in the lowest cost of energy. The<br />
Evaluation tool also provides a sensitivity analysis for each final project evaluation so that the<br />
user can evaluate how sensitive the proposed project is to changes in various costs.<br />
Page 122<br />
Identifying Effective <strong>Biomass</strong> Strategies:<br />
Quantifying Minnesota’s Resources and Evaluating Future Opportunities
Overall Structure<br />
Fuel Delivery Path<br />
It is necessary to develop a full-cost approximation for the delivery of a fully-usable fuel to the<br />
power generation facility. This delivery path may take many forms and vary significantly across<br />
feedstocks and projects. The user is free to select which options will be included in the normal<br />
operation of the proposed project.<br />
Feedstock<br />
Site<br />
Processing<br />
Yard<br />
(optional)<br />
Storage<br />
Facility<br />
(optional)<br />
Power<br />
Plant<br />
Figure VIII-2: Feedstock Delivery Path<br />
The most complicated delivery path will include stops at all available stages. If storage will not<br />
take place at a dedicated storage facility, but will instead take place at the Feedstock Site,<br />
Processing Yard or Power Plant, the transport distances under the “Storage” menu should be set<br />
to zero. Similarly, if there is not a separate Processing Yard in the delivery path, the distances<br />
under “Ship to Processing Yard” should be set to zero.<br />
Transportation Costs<br />
The user may define up to three different methods of transportation (road, rail, and barge) and<br />
the associated distances of each for each link in the feedstock delivery chain. The user may<br />
therefore set a delivery path for biomass fuels that includes transporting the feedstock X miles by<br />
truck, Y miles by train, and Z miles by barge.<br />
A single default cost value is provided for each mode of transportation and each feedstock. If<br />
the user anticipates that transportation costs will be different for each link in the feedstock<br />
delivery chain, he or she may define different values for each link. This can be done by entering<br />
a new cost per ton/mile under the “Processing Yard”, “Storage” and/or “Power Plant” screens<br />
and then clicking on the “Save Settings” button. This will assign the new transportation costs to<br />
the relevant link in the supply chain. The user may also enter transportation costs in the “Inputs”<br />
worksheet accessed through the “View All Inputs” link on the “Feedstock Selection” screen.<br />
Different transportation assumptions may be made depending upon the consistency of the fuel.<br />
The user may define the feedstock as a solid or liquid. This distinction was made assuming that<br />
transportation of a liquid would require significantly different equipment for loading and<br />
unloading needs.<br />
The cost impact of omitting a stage of the delivery path can be observed by use of the dropdown<br />
“Yes” and “No” menus for the Processing Yard and Storage Facility. If the value is set to<br />
“No,” the stage will be ignored in calculating the delivered cost per MMBTU. It should be noted,<br />
however, that all costs associated with the stage will be ignored; if the feedstock must be<br />
processed before being used, these costs will need to be added to a different stage in order to<br />
preserve the accuracy of the calculation.<br />
Identifying Effective <strong>Biomass</strong> Strategies: Page 123<br />
Quantifying Minnesota’s Resources and Evaluating Future Opportunities
Processing Yard<br />
Some biomass feedstocks may be shipped to a processing yard prior to shipment to a storage<br />
facility or power plant. There are two general models for processing yards. The first would be a<br />
local processing yard to which materials are hauled over a short distance and from which they<br />
are hauled to a power plant or storage facility. An example of this would be a wood, or<br />
“concentration.” yard that receives logging residues from nearby, chips them and loads them<br />
for transport. The other model for a processing yard is one relatively close and accessible to the<br />
power plant (and perhaps under its management), but not incorporated in to it. Sometimes<br />
these processing yards serve plants that lack room on site for fuel processing or storage, as is the<br />
case with two power plants in northern Minnesota that share a single processing yard located<br />
midway between them. Such partnerships have the added advantage of capturing economies<br />
of scale.<br />
Storage Facility<br />
Some biomass feedstocks will need to be stored at offsite storage facilities until they are needed<br />
by the power plant. This is especially the case for biomass like switchgrass or corn stover ttthat<br />
are harvested during a narrow window of time but are drawn down over the course of a year.<br />
Fuel processing for storage may take place at the storage facility or somewhere else prior to<br />
delivery. Storage facilities can take many forms, from open fields with stacks of uncovered bales<br />
to large fully enclosed storage barns. To estimate storage costs one must estimate the capital<br />
and handling costs associated with each storage method as well as the expected dry matter<br />
loss associated with that method. Storing unprotected bales in the open requires no capital<br />
expenditure and very little handling; but the loss of dry matter from such a storage method can<br />
be quite significant.<br />
Power Plant<br />
<strong>Biomass</strong> fuel ultimately must be shipped to the power plant. Once on site, the fuel may go into<br />
storage bins or proceed directly into the plant’s fuel feeding system. <strong>Final</strong> processing steps often<br />
include screening and size reduction. Default costs for transport to the plant, processing and<br />
unloading are provided, or the user can enter more specific costs if they are available.<br />
The evaluation tool is designed to allow the user to develop different “scenarios” that can be<br />
combined later to evaluate different options. There are three scenario types: Feedstock, Power<br />
Plant, and <strong>Project</strong>. The <strong>Project</strong> Scenario is comprised of a combination of the first two.<br />
Scenario Generation<br />
Feedstock Scenario<br />
The development of a feedstock scenario allows the user to build a feedstock development and<br />
delivery system ending with a cost per MMBTU for a fully-processed fuel at the power plant. You<br />
may make as many Feedstock Scenarios as you wish. All Feedstock Scenarios must be logged if<br />
they are to be used for future analysis.<br />
Power Plant Scenario<br />
The development of a power plant scenario allows the user to define the characteristics of an<br />
operating power plant. This includes such things as power plant size, capital costs, operating<br />
Page 124<br />
Identifying Effective <strong>Biomass</strong> Strategies:<br />
Quantifying Minnesota’s Resources and Evaluating Future Opportunities
expenses, rate of return, inflation, etc. Once a scenario has been defined, it must be logged to<br />
be used for future analysis.<br />
<strong>Project</strong> Summary<br />
Once a Feedstock Scenario and a Power Plant Scenario have been created and logged, it is<br />
possible to calculate the estimated cost of delivered energy. One may select a Power Plant<br />
Scenario and input different Feedstock Scenarios to evaluate the economic impacts of various<br />
options. One may also conduct sensitivity analysis on the <strong>Project</strong> Scenarios to understand the<br />
impacts of fluctuating inputs on the final energy cost. <strong>Project</strong> Scenarios can also be logged for<br />
future reference.<br />
Define<br />
Feedstock<br />
Scenario(s)<br />
Log<br />
Scenario<br />
Results<br />
Define Power<br />
Plant<br />
Scenario(s)<br />
Log<br />
Scenario<br />
Results<br />
Select a Logged<br />
Feedstock and Power<br />
Plant Scenario<br />
RESULT<br />
Estimated Cost of<br />
Delivered <strong>Energy</strong><br />
Figure VIII-3: Evaluation Methodology<br />
Algorithms<br />
Basic Cost Calculations<br />
These are the cost calculations internal to BioPET that estimates project costs throughout the<br />
process. They are offered here to provide the user with enough information to understand the<br />
calculations and allow the user to manipulate the entries to satisfy individual project concerns.<br />
Please refer to the BioPET software manual in Appendix A for even more detail.<br />
Definitions<br />
<strong>Energy</strong> Content (ENC) = BTU/dry pound<br />
MCW = Moisture Content by Weight (%)<br />
Field<br />
Field Costs (Fc) = (Payment/Market Price) – (Avoided Disposal Costs) + (Processing Cost) +<br />
(Collection/Loading Cost)<br />
Identifying Effective <strong>Biomass</strong> Strategies: Page 125<br />
Quantifying Minnesota’s Resources and Evaluating Future Opportunities
Processing Yard<br />
Transportation to the Yard (Yt) = (Miles by Road) * (Transportation Cost ($/ton-mile) +<br />
(Miles by Rail) * (Transportation Cost ($/ton-mile) + (Miles by Barge) * (Transportation Cost<br />
($/ton-mile)<br />
Processing Yard Costs (Yc) = (Processing Cost) + (Collection/Loading Costs)<br />
Storage Facility<br />
Power Plant<br />
Total<br />
Transportation to Storage (St) = (Miles by Road) * (Transportation Cost ($/ton-mile) + (Miles<br />
by Rail) * (Transportation Cost ($/ton-mile) + (Miles by Barge) * (Transportation Cost<br />
($/ton-mile)<br />
Storage Facility Costs (Sc) = (Processing Cost) + (Collection/Loading Costs) + (Storage<br />
Costs) * (Average Number of Months Stored)<br />
Transportation to Power Plant (Pt) = (Miles by Road) * (Transportation Cost ($/ton-mile) +<br />
(Miles by Rail) * (Transportation Cost ($/ton-mile) + (Miles by Barge) * (Transportation Cost<br />
($/ton-mile)<br />
Power Plant Costs (Pc) = (Processing Cost) + (Unloading Cost) + (Payment)<br />
Total Cost (Tc) ($/wet ton) = Fc + Yt + Yc + St + Sc + Pt + Pc<br />
1<br />
T c $ / ton *( )<br />
1 − MCW<br />
<strong>Energy</strong> Cost (Ec) ($/MMBTU) *1,000,000Btu<br />
/ MMBtu =<br />
( ENCBtu / lb *2,000lbs<br />
/ ton)<br />
Utility Economic Evaluation<br />
The power plant economic analysis used the “Generic <strong>Biomass</strong> Power Plant Model” developed<br />
by the California <strong>Biomass</strong> Collaborative and available on their website<br />
(http://biomass.ucdavis.edu/index.html). In addition to the model, the California <strong>Biomass</strong><br />
Collaborative (CBC, n.d.) details the economic variables and methodology as well as providing<br />
an example analysis.<br />
Levelized Annual Costs (LACs)<br />
The Bio-power Evaluation Tool (BioPET) generates estimates of the levelized cost of energy<br />
(LCOE) for a number of bio-power facility types using a generic agricultural residue fuel and a<br />
generic woody residue fuel. An estimate of the LCOE for an anaerobic digester was estimated<br />
as well.<br />
Page 126<br />
Identifying Effective <strong>Biomass</strong> Strategies:<br />
Quantifying Minnesota’s Resources and Evaluating Future Opportunities
$0.350<br />
295 kW CHP<br />
$0.300<br />
$0.250<br />
$0.200<br />
$/kWh<br />
$0.150<br />
$0.100<br />
$0.050<br />
50 MW<br />
70 MW<br />
IGCC<br />
13 MW<br />
Local <strong>Biomass</strong><br />
5.4 MW Gasification<br />
w/ CHP<br />
600 MW Coal<br />
w/ 5% Co-Fire<br />
3.1 MW Gasification<br />
w/ CHP<br />
$0.000<br />
Agricultural Residues Woody Residues Coal<br />
Simple Sensitivity Analysis<br />
Figure VIII-4: Example LAC Runs<br />
The sensitivity analysis performed on each proposal evaluation illustrates the change in constant<br />
levelized cost of energy that one could expect from varying the rate of one of the included<br />
variables, while holding all other variables constant. The sensitivity analysis is presented in terms<br />
of the relative (%) change of each variable, as opposed to an absolute change in value.<br />
Sensitivity Analysis<br />
0.18<br />
Feedstock Costs<br />
0.16<br />
0.14<br />
Cost of <strong>Energy</strong><br />
($/kWh, Constant)<br />
0.12<br />
0.10<br />
0.08<br />
0.06<br />
0.04<br />
0.02<br />
0.00<br />
-50 -40 -30 -20 -10 0 10 20 30 40 50 60 70 80 90 100<br />
Relative Change (%)<br />
Figure VIII-5: BioPET Sensitivity Analysis Example<br />
Identifying Effective <strong>Biomass</strong> Strategies: Page 127<br />
Quantifying Minnesota’s Resources and Evaluating Future Opportunities
MULTIPLE VARIABLE SENSITIVITY ANALYSIS (MONTE CARLO)<br />
BioPet performs one type of sensitivity analysis, allowing the user to see how variations in a single<br />
selected parameter affect outcomes. We also used Monte Carlo techniques to analyze the<br />
effects of several variable assumptions jointly.<br />
The single value assigned to each assumption/parameter may not always reflect the true<br />
condition of the system we are examining. We know all variables with imprecision. In some<br />
cases such as crop yields, the variability is due to stochastic events like climate. In other cases,<br />
such as local production participation rates, we simply are ignorant of the “true” value of the<br />
factor. But in every case, we can assign a probability density function which describes our prior<br />
expectation of each factor’s variability.<br />
The key feature of the Monte Carlo analysis is repetition. Because we don’t know the single<br />
“true” value of certain factors, but only the distribution of the probability for that value (assigned<br />
by us), we can’t simply run the model once and then report the result. Instead, we run the<br />
model over and over, each time sampling from the parameter distributions, according to the<br />
stated form of the distribution. In a given run we might draw from the upper end of one<br />
parameter’s distribution and the mid-point of another’s. In the next run, the draw might be<br />
opposite. And so on, for hundreds or thousands of runs.<br />
For each run, we record the outcomes of the model for that run’s parameter sample selections.<br />
Each new set of parameter values yields a different outcome. After hundreds or thousands of<br />
runs, we obtain a distribution of outcome estimates. This can be interpreted as the spread of<br />
possible outcomes given the stated distributions of the variable assumption. A wide range<br />
suggests that we should be very careful about too quickly adopting the single-value outcome of<br />
the initial parameters. Too, we can compare among scenarios to see if some have narrower<br />
outcome ranges than to others, or if some clearly “outperform” others despite a wide range of<br />
parameter uncertainty.<br />
The Monte Carlo simulations were performed using feedstock and power plant templates<br />
generated with the BioPET software tool. Most of the variables were generated using the default<br />
values within BioPET. For those variables which would be varied within the Monte Carlo<br />
Simulation the mean value of the variable’s range was used as a default. Some of the Monte<br />
Carlo variables are market or processing costs which have considerable variability. In those<br />
cases the mean value is somewhat different than the default value due to fact that the default<br />
values were chosen to be representative of current prices as opposed to average long term<br />
prices.<br />
These templates include all costs incurred to deliver fuel to the power plant. Any processing<br />
costs at the power plant are included in the operating costs of the plant. Four power plant<br />
templates were generated. The templates are derived from publicly available documents. Two<br />
of the templates are derived from engineering and financial studies of specific projects. The<br />
others are derived from more general documents that have contained information on power<br />
plant costs.<br />
Power Plant Assumptions<br />
The source documents for each of the power plant templates use somewhat different financial<br />
and operating assumptions. For the purposes of the Monte Carlo simulations a number of<br />
uniform assumptions were utilized to provide a degree of standardization across power plants. A<br />
uniform mean capacity factor of 85% was utilized for each power plant template. All other<br />
Page 128<br />
Identifying Effective <strong>Biomass</strong> Strategies:<br />
Quantifying Minnesota’s Resources and Evaluating Future Opportunities
plant characteristics and plant expenses were derived from the source material. The<br />
documentation for each power plant template uses quite different financial assumptions. These<br />
were standardized across power plants, with the exception of the income escalation variable for<br />
the CHP plant, which was modified to account for the potential for rapidly increasing natural<br />
gas prices.<br />
50 MW wood- fired stoker boiler<br />
This template was generated using documentation relating to the Big Stone II coal power plant<br />
(Burns & McDonnell, 2005).<br />
The template is meant to represent the costs for a wood-fired stoker boiler built as an additional<br />
generating unit at an existing coal fired plant. The expenses included in this template include<br />
fixed O&M costs, non-fuel variable O&M costs, and insurance. In addition to wood fuels this<br />
plant is assumed to be adaptable to corn stover and switchgrass.<br />
35 MW <strong>Biomass</strong> Co-Firing (Incremental Costs) and 600 MW Pulverized Coal Plant<br />
w/ 35 MW <strong>Biomass</strong> Co-Firing<br />
The co-firing cost estimates are derived from documents published by the Chariton Valley<br />
<strong>Biomass</strong> <strong>Project</strong> (Alliant <strong>Energy</strong>, et. al., 2002) and documents relating to a proposed pulverized<br />
coal plant in South Dakota (Burns and McDonnell, 2005), The Chariton Valley documents were<br />
used to create a template for a co-firing operation that could be added to a coal plant<br />
template to estimate the blended costs of a co-firing operation. The capital costs for the cofiring<br />
template include the costs of the fuel storage, handling and processing facilities needed<br />
for a co-firing operation. The operational costs include the additional labor, administrative and<br />
maintenance costs needed to operate a co-firing operation. The cost estimates for the coal<br />
plant are meant to be representative of the expected costs for a new 600 MW pulverized coal<br />
unit built adjacent to an existing coal plant. The expenses included in this template include fixed<br />
O&M costs, non-fuel variable O&M costs, and insurance. The 35 MW Co-firing template can be<br />
used to estimate the incremental costs of a co-firing operation. The blended template including<br />
the 35 MW co-firing template and 600 MW pulverized coal plant can be utilized to estimate the<br />
average cost of energy for a co-firing operation.<br />
Industrial CHP with Gasifier and 4 X 1.3 MW Gensets<br />
This template is based on an economic and technical feasibility study of a biomass gasification<br />
CHP system at a large malting facility (Trillium Planning and Development, 2002). A number of<br />
scenarios were examined for the study. The template is based on the most economic scenario<br />
examined in the study. It includes four Jenbacher Engine sets with a total net capacity of 5.4<br />
MW. The natural gas savings from the thermal energy captured from the system are accounted<br />
for as “Other Income”. The electrical efficiency represents the Net Electrical Efficiency based on<br />
the energy content of the biomass prior to gasification, not the electrical efficiency of the<br />
combustion of syngas by the turbine or genset. The operating costs included in this template<br />
include labor, maintenance and the cost of standby electrical service.<br />
135 kW Genset w/ Manure Digester<br />
This template is based on the Haubenschild Dairy Farm Digester near Princeton, MN (Kramer,<br />
2004). The farm operates a plug-flow digester that powers a 135 kW engine generator set.<br />
Thermal energy recovered from the genset’s cooling jacket is used to heat the barn. The<br />
electrical efficiency represents the system efficiency taking into account the efficiency of the<br />
Identifying Effective <strong>Biomass</strong> Strategies: Page 129<br />
Quantifying Minnesota’s Resources and Evaluating Future Opportunities
conversion of Volatile Organic Solids to biogas, and the electrical efficiency of the combustion<br />
of biogas by the genset. The values used to arrive at the efficiency are: 85% of total solids are<br />
VOCs, 35% of VOCs are converted to biogas, and the genset has a 40% electrical efficiency.<br />
These values are average values, however, and are known to vary significantly with the manure<br />
management practices, the digestion technology, and the generation technology employed.<br />
The other income included in the template includes fertilizer and pesticide savings resulting from<br />
manure digestion, as well as propane savings arising from heat recovered from the genset’s<br />
jacket.<br />
Power Plants Summary<br />
Below is a summary of assumptions used.<br />
Table VIII-1: Power Plant Characteristics<br />
Scenario Capital Cost ($) Plant Capacity<br />
(kW)<br />
Capacity<br />
Factor<br />
(%)<br />
Electrical<br />
Efficiency<br />
(%)<br />
50 MW <strong>Biomass</strong> $150,000,000 50,000 85.0% 24.4%<br />
Co-Firing (Incremental) $15,400,000 35,000 85.0% 36.4%<br />
600 MW Coal w/ 5% Co-Fire $1,100,000,000 600,000 85.0% 36.4%<br />
5.4 MW Gasification w/ CHP $15,300,000 5,392 85.0% 23.8%<br />
135 kW w/ Manure Digester $424,000 135 85.0% 11.9%<br />
Table VIII-2: Power Plant Income (Other) and Expenses<br />
Scenario<br />
Other Income<br />
($/year)<br />
Total Expenses<br />
($/yr)<br />
50 MW <strong>Biomass</strong> $0 $2,179,487<br />
Co-Firing (Incremental) $0 $1,266,766<br />
600 MW Coal w/ 5% Co-Fire $0 $17,604,724<br />
5.4 MW Gasification w/ CHP $3,547,606 $894,308<br />
135 kW w/ Manure Digester $74,000 $31,374<br />
Capacity Payment<br />
($/kW - yr)<br />
Table VIII-3: Power Plant Income and Taxes for All Scenarios<br />
Interest Rate on<br />
Debt Reserve<br />
(%)<br />
Federal Tax<br />
Rate (%)<br />
State Tax<br />
Rate (%)<br />
Production Tax Credit<br />
($/kWh)<br />
$0.00 5.00% 34.00% 0.00% $0.0000<br />
Page 130<br />
Identifying Effective <strong>Biomass</strong> Strategies:<br />
Quantifying Minnesota’s Resources and Evaluating Future Opportunities
Table VIII-4: Power Plant Financial Assumptions for All Scenarios<br />
Debt<br />
Ratio (%)<br />
Interest<br />
Rate<br />
(Debt)<br />
(%)<br />
Economic<br />
Life (years)<br />
Rate of<br />
Return<br />
(%)<br />
General<br />
Inflation<br />
(%)<br />
Fuel<br />
Escalation<br />
(%)<br />
Income<br />
Escalation<br />
(%)<br />
Expense<br />
Escalation<br />
(%)<br />
50.0% 7.5% 20 13.5% 2.5% 3.0% 2.5% 2.5%<br />
Feedstock Assumptions<br />
Feedstock templates were generated for corn stover, switchgrass, logging residues, hybrid<br />
poplars, DDGS and dairy manure. The templates incorporate all costs incurred to deliver<br />
feedstock to the plant, as well as the cost of storage at the plant. All feedstock processing that<br />
occurs at the plant is included in plant operational costs.<br />
Corn Stover<br />
The corn stover scenario includes a $10 per ton landowner payment, baling costs, loading and<br />
unloading costs, 50 miles of road transportation, and 6 months average storage per ton. In this<br />
scenario the corn grain produced is assumed to bear the cost of land rents, as well as<br />
establishment costs. The $10 payment is assumed to be sufficient to cover the costs of nutrient<br />
replacement, and provide sufficient incentive for the landowner to allow stover harvest.<br />
Switchgrass<br />
The switchgrass scenario assumes that the switchgrass is purchased in bales from the farmer. The<br />
range of market prices used represents prices paid for baled hay of low to fair quality in<br />
Minnesota during May 2007. The market price is assumed to cover all costs incurred by the<br />
farmer to deliver square bales to the farm gate. Added to the market price are loading and<br />
unloading costs, 50 miles of road transportation, and 6 months of average storage.<br />
Logging Residues<br />
The logging residue scenario includes a $2 landowner payment and collecting, forwarding,<br />
chipping, loading and unloading costs. It also includes 50 miles of road transport and 6 months<br />
of storage. As in the corn stover scenario, the landowner payment is assumed to cover any<br />
costs the owner incurs in allowing residue collection.<br />
Hybrid Poplar<br />
The hybrid poplar scenario is analogous to the switchgrass scenario in assuming that the hybrid<br />
poplars must bear the full costs incurred by the farmer to establish and maintain a stand. The<br />
average stumpage price for aspen for pulp and bolts from 2005 to 2006 in Minnesota is used as a<br />
proxy for these costs. This may understate the full costs of a hybrid poplar stand as they are<br />
often planted on farm land that has a higher value than timber land. Stumpage prices do,<br />
however, indicate the price of a major substitute for hybrid poplar, so they should therefore<br />
represent fairly closely the prices farmers can expect to receive for their trees. Added to the<br />
stumpage price are harvest, chipping, loading and unloading costs, 50 miles of road transport,<br />
and 6 months of storage at the plant.<br />
Identifying Effective <strong>Biomass</strong> Strategies: Page 131<br />
Quantifying Minnesota’s Resources and Evaluating Future Opportunities
DDGs<br />
The DDGs scenario includes only an energy content, market price and moisture content. DDGS<br />
are often used as a supplemental feed for beef cattle and other livestock. The market price of<br />
DDGs represents the opportunity cost to producers of using DDGs as an energy source. The<br />
range of market prices used is the price range of DDGs in Minnesota from May of 2006 to April<br />
2007.<br />
Dairy Manure<br />
The dairy manure scenario includes only an energy content and moisture content. All other<br />
costs are assumed to be born by the dairy operation. The range of moisture contents is taken<br />
from the survey of agricultural biogas systems from which the template was derived.<br />
Feedstock Summary<br />
Below is a summary of assumptions used.<br />
<strong>Biomass</strong><br />
Feedstock<br />
<strong>Energy</strong><br />
Content<br />
(BTU/lb)<br />
Table VIII-5: Feedstock Characteristics and Costs<br />
Market<br />
Price<br />
($/ton)<br />
Amount<br />
Collected<br />
(%)<br />
MCW<br />
(%)<br />
Site<br />
Processing<br />
Activity<br />
Site<br />
Processing<br />
Costs<br />
($/ton)<br />
Collection<br />
& Loading<br />
($/ton)<br />
Corn Stover 8,191 $10.00 65% 25% Baling $23.57 $3.22<br />
Switchgrass 7,481 $60.00 100% 12% None $0.00 $3.22<br />
Logging 8,669 $2.00 70% 50% Chip $7.50 $1.75<br />
Residue<br />
Hybrid Poplar 8,430 $19.50 100% 50% Chip $15.00 $1.75<br />
DDGS 9,422 $105.00 100% 11% none $0.00 $0.00<br />
Dairy Manure 6,757 $0.00 100% 10% none $0.00 $0.00<br />
<strong>Biomass</strong><br />
Feedstock<br />
Trans. Cost<br />
($/ton/mi)<br />
Table VIII-6: Feedstock Costs<br />
Miles Processing Processing<br />
Costs<br />
($/ton)<br />
Storage<br />
($/ton/mth)<br />
Avg.<br />
Storage<br />
Time<br />
(mths)<br />
Collection/<br />
Loading<br />
Costs<br />
($/ton)<br />
Corn Stover $0.10 50 None $0.00 $1.71 6 $3.22<br />
Switchgrass $0.10 50 None $0.00 $1.71 6 $3.22<br />
Logging $0.10 50 Chip $15.90 $1.50 6 $1.75<br />
Residue<br />
Hybrid Poplar $0.10 50 Chip $15.90 $1.50 6 $1.75<br />
DDGs $0.00 0 None $0.00 $0.00 0 $0.00<br />
Dairy Manure $0.00 0 None $0.00 $0.00 0 $0.00<br />
Page 132<br />
Identifying Effective <strong>Biomass</strong> Strategies:<br />
Quantifying Minnesota’s Resources and Evaluating Future Opportunities
Table VIII-7: Scenario Definitions<br />
Scenario<br />
Number<br />
<strong>Biomass</strong><br />
Feedstock<br />
Power Plant<br />
Strategy<br />
Scenario<br />
Number<br />
<strong>Biomass</strong> Feedstock<br />
Power Plant<br />
Strategy<br />
s1 Corn Stover 50 MW <strong>Biomass</strong> s10 Switchgrass 600 MW Coal w/<br />
5.8% Co-Fire<br />
s2 Other/Switchgrass 50 MW <strong>Biomass</strong> s11 Logging Residues 600 MW Coal w/<br />
5.8% Co-Fire<br />
s3 Logging Residues 50 MW <strong>Biomass</strong> s12 Timber (Aspen) 600 MW Coal w/<br />
5.8% Co-Fire<br />
s4 Timber (Aspen) 50 MW <strong>Biomass</strong> s13 Corn Stover 5.4 MW<br />
Gasification w/<br />
CHP<br />
s5 Stalks (Corn) Co-Firing<br />
(Incremental)<br />
s6 Switchgrass Co-Firing<br />
(Incremental)<br />
s7 Logging Residues Co-Firing<br />
(Incremental)<br />
s8 Timber (Aspen) Co-Firing<br />
(Incremental)<br />
s9 Corn Stover 600 MW Coal w/<br />
5.8% Co-Fire<br />
s14<br />
Hay/Straw<br />
(Other/Switchgrass)<br />
5.4 MW<br />
Gasification w/<br />
CHP<br />
s15 Logging Residues 5.4 MW<br />
Gasification w/<br />
CHP<br />
s16 Timber (Aspen) 5.4 MW<br />
Gasification w/<br />
CHP<br />
s17 Ethanol DDGs 5.4 MW<br />
Gasification w/<br />
CHP<br />
s18<br />
Dairy Manure<br />
(including benefits)<br />
135 kW w/ Manure<br />
Digester<br />
s19<br />
Dairy Manure (not<br />
including benefits)<br />
135 kW w/ Manure<br />
Digester<br />
Probability Distributions<br />
The values and the probability distributions used in the Monte Carlo analysis are based on a<br />
number of sources. In some instances the values utilized are the default values in BioPET. In<br />
other instances more recent, or complete, data form the basis of the probability distributions. In<br />
most instances recent data allowed for the generation of a reasonably accurate range of<br />
values. It was not possible, however, to know what the actual distribution of prices would be<br />
within the price range. For this reason a simple triangular distribution was chosen. In most cases<br />
the peak, or center, of the triangle was placed at the mean value of the range. In a few<br />
instances a skewed distribution was chosen where we felt that it was warranted.<br />
Recent price data was used to develop the ranges for the market price of switchgrass (USDA,<br />
2007b), hybrid poplar (Jacobsen, 2007), and DDGS (USDA, 2007c), as well as the harvest costs of<br />
logging residues (Lumberjack RC&D, 2005) and hybrid poplars (Schmidt, n.d.). In the case of<br />
corn stover baling costs and feedstock energy content the default value from BioPET was used<br />
as the mean, and the minimum and maximum values were set at +/- 15% of the mean. Road<br />
transport costs were a variable that we felt was likely to have a skewed distribution in the future,<br />
due to the likelihood that oil prices were more likely to rise from current levels than fall. For this<br />
Identifying Effective <strong>Biomass</strong> Strategies: Page 133<br />
Quantifying Minnesota’s Resources and Evaluating Future Opportunities
eason a range from -20% to +100% of the default values of BioPET were utilized, and the peak of<br />
the distribution was placed at the default value. The range of values for manure moisture<br />
contents was taken from a document that describes the experiences of farmers operating<br />
manure digesters (Kramer, 2004).<br />
The range utilized for power plant capital costs was skewed. A range from 95% to 120% of the<br />
default capital cost within BioPET was utilized, with the peak of the distribution at the BioPET<br />
default value. Recent news reports of rapidly rising power plant costs led us to assume that<br />
capital costs were more likely to rise than to fall in the coming years (Wald, 2007). The range of<br />
income values for manure digesters was derived from documentation of a specific manure<br />
digester in Minnesota (Kramer, 2004).<br />
Table VIII-8: Variable Ranges for Feedstock Scenarios<br />
Feedstock Proxy Min Max Distribution<br />
Switchgrass Costs Hay Prices $30 $90 Triangular<br />
Centered on Mean<br />
Hybrid Poplar Market Price<br />
Aspen<br />
Stumpage<br />
$12 $27 Triangular<br />
Centered on Mean<br />
Hybrid Poplar Harvest Costs $11 $19 Triangular<br />
Centered on Mean<br />
Logging Residue Harvest Costs $2 $13 Triangular<br />
Centered on Mean<br />
DDGS Market Price $80 $130 Triangular<br />
Centered on Mean<br />
Corn Stover Baling Costs $20.03 $27.11 Triangular<br />
Centered on $23.57<br />
Road Transport Costs<br />
$0.08 per<br />
Mile<br />
$0.20 per<br />
mile<br />
Triangular<br />
Centered on Default<br />
Feedstock <strong>Energy</strong> Content<br />
85% of<br />
Default<br />
115% of<br />
Default<br />
Triangular<br />
Centered on Default<br />
Dairy Manure Moisture Content 85% 99% Triangular<br />
Mean at 90%<br />
Table VIII-9: Variable Ranges for Power Plant Scenarios<br />
Feedstock Min Max Distribution<br />
Capacity Factor 65% 90% Triangular<br />
Peak at 85%<br />
Capital Costs 95% of Default 120% of Default Triangular<br />
centered on Default<br />
Digester Other Income 0$ $74,000 Triangular<br />
Peak at $50,000<br />
Results<br />
The results presented here represent the range of values from the 20 th percentile through the 80 th<br />
percentile. These results illustrate that there is considerable variability in the cost of both biomass<br />
feedstocks and biomass power. They also illustrate that the choice of feedstock and plant<br />
design each play significant roles in determining a plant’s LAC.<br />
Page 134<br />
Identifying Effective <strong>Biomass</strong> Strategies:<br />
Quantifying Minnesota’s Resources and Evaluating Future Opportunities
Disregarding the manure digester, the results show an overall range of LACs from ~$0.03 per kWh<br />
to ~$0.185 per kWh.<br />
20.00<br />
18.00<br />
16.00<br />
14.00<br />
LAC in Cents per kWh<br />
12.00<br />
10.00<br />
8.00<br />
6.00<br />
4.00<br />
2.00<br />
-<br />
s1 s2 s3 s4 s5 s6 s7 s8 s9 s10 s11 s12 s13 s14 s15 s16 s17 s18 s19<br />
Figure VIII-6: Monte Carlo Results (LAC)<br />
Feedstock Variability<br />
The resulting feedstock prices illustrate a number of important points. The most apparent of<br />
these is that each feedstock has a very different range of prices, both in terms of mean<br />
expected price and range of expected prices. Corn stover, for instance has a relatively low<br />
mean expected price, with a relatively narrow range of expected prices. Switchgrass, on the<br />
other hand, has a mean price that is $1.60 higher than that of corn stover, and a much greater<br />
range of prices $1.70 between the 20 th and 80 th percentile vs. $0.35 for corn stover.<br />
10.00<br />
9.00<br />
8.00<br />
7.00<br />
$ per MMBtu<br />
6.00<br />
5.00<br />
4.00<br />
3.00<br />
2.00<br />
1.00<br />
-<br />
Corn Stover<br />
Switchgrass<br />
Logging Residues<br />
Hybrid Poplar<br />
Corn Stover/Coal<br />
Switchgrass/Coal<br />
Logging Residues/Coal<br />
Hybrid Poplar/Coal<br />
Ethanol DDGS<br />
Figure VIII-7: Feedstock Price Variability<br />
Identifying Effective <strong>Biomass</strong> Strategies: Page 135<br />
Quantifying Minnesota’s Resources and Evaluating Future Opportunities
The other important point that arises from these results is the dramatic decrease in both mean<br />
expected price, and price variability for the co-firing scenarios. This is due largely to the<br />
relatively small proportion of the total feedstock price for these scenarios that biomass<br />
represents. The difference between the mean expected price of the least and most expensive<br />
co-firing scenarios is only $0.21 per MMBTU, and the expected price variability for any of these<br />
scenarios is only a few pennies per MMBTU between the 20 th and 80 th percentiles.<br />
Power Plant Design<br />
Power plant design plays an important role in determining the price of power. The range of<br />
prices for the 50 MW, biomass-only, power plant surpasses all but the most expensive power from<br />
the other power plant designs. The price ranges for the other power plant designs overlap<br />
somewhat. The most cost effective power plant is the CHP facility which gasifies biomass, and<br />
generates power with converted gensets. The incremental and total costs of power from cofiring<br />
fall between the CHP plant and biomass only power plant. However there is considerable<br />
overlap for those three scenarios.<br />
Feedstock costs also play an important role in determining the LAC. Corn stover is the least<br />
expensive feedstock for each power plant, followed by logging residues, switchgrass, and finally<br />
hybrid poplars. For each biomass only power plant design the most expensive feedstock (hybrid<br />
poplar) adds between $0.04 to $0.06 per kWh over the cost of power from the least expensive<br />
feedstock (corn stover). The effect is greatly reduced when one looks at the total cost of cofiring.<br />
As is the case for the feedstock costs of the co-firing scenario both the mean price, and<br />
the expected price variability are considerably less in the co-firing scenario than the other<br />
scenarios. The difference in the mean LACs for each co-firing scenario is only $0.0024 between<br />
the least and most expensive scenario. The expected range of prices for each scenario is only<br />
~$0.005 between the 20 th and 80 th percentiles.<br />
The cost of power from the manure digester is driven in large part by the non-energy value<br />
derived from digester. When no added benefits are included in the cost of energy the price of<br />
power from the digester is approximately $0.046 per kWh, but when there are additional benefits<br />
from the operation of the digester the price of power is approximately $0.013 per kWh.<br />
Page 136<br />
Identifying Effective <strong>Biomass</strong> Strategies:<br />
Quantifying Minnesota’s Resources and Evaluating Future Opportunities
CHAPTER IX : OVERCOMING BARRIERS<br />
Minnesota’s potential for electric generation from biomass fuels got a great boost in March, 2007<br />
when the legislature enacted, and the governor signed, a renewable energy standard (RES).<br />
The formula is simple: in 2010, 10% of electric power from Minnesota utilities must be generated<br />
from renewable fuels; in 2015, 15%; in 2020, 20%; and in 2025, 25%. Because <strong>Xcel</strong> <strong>Energy</strong> is not<br />
credited for “pre-existing” renewables as mandated by the Prairie Island Agreement, it has to<br />
meet a higher standard – 30% – sooner – by 2020. That means it will have to add to its portfolio<br />
around 3500 MW of renewable generation in a period of twelve years.<br />
Wind is the renewable fuel getting most attention from utilities. Some plan to build and own<br />
wind farms to supplement power they buy from developers through Power Purchase<br />
Agreements. But wind power aside, the standards will become a powerful incentive for utilities<br />
to take a more active role in creating biomass capacity as well. That role may range from<br />
retrofitting existing coal plants to co-fire biomass to partnering with manufacturing and<br />
processing plants in co-generation projects, as Minnesota Power has done with several pulp and<br />
paper mills. <strong>Biomass</strong> will most likely be especially important to a utility like Minnesota Power,<br />
which serves large 24/7 base-load industrial customers in the paper and taconite processing<br />
industries of northeastern Minnesota. And since northeastern Minnesota isn’t a particularly windy<br />
area, turbines wouldn’t operate very efficiently there anyway.<br />
That last observation touches on an important point: every renewable power project, especially<br />
a biomass power project, must be carefully planned and located in terms of its relation to fuel,<br />
technology, transportation, transmission, and markets. Available biomass is a necessary factor,<br />
but not a sufficient one, in determining the feasibility of a specific biomass energy project. It<br />
takes the whole package to make a renewable energy project work.<br />
Maps in Chapter II of this report show where Minnesota’s biomass fuel sources lie. Looking at the<br />
big picture, we see Minnesota’s biomass growing in two major biomes. In the northeast is boreal<br />
forestland, where biomass consists of timber harvest residues, mill wastes, brush, storm blowdown<br />
and thinnings. (Roundwood – logs – also could be considered, but that scarce and<br />
expensive resource is in high demand for forest products.)<br />
In the farming and livestock raising lands of Central, Southern and Western Minnesota, biomass<br />
takes the forms of crop harvest residues, crop processing wastes, and manure. (There has been<br />
interest in dedicated energy crops, like hybrid trees and grasses, in farm country, but not much<br />
development.) Manure is found most abundantly in dairy area northeast and southwest of the<br />
Twin Cities, but turkey and hog production west of the Cities also have potential, as evidenced<br />
by the Fibrominn plant in Benson which burns turkey litter.<br />
A lesser biome, the Mississippi Valley coulee region, is covered with dense stands of temperate<br />
hardwoods, but its difficult terrain, scenic beauty, and wildlife habitat make timber harvesting<br />
problematic in that area. Another smaller biome, in the commercially unproductive marshes<br />
and pastures of central Minnesota, eventually may accommodate dedicated energy crops like<br />
grasses. Marginal agricultural lands in Northwestern Minnesota also might sustain energy crops<br />
Within each of those big-picture biomes lie a myriad of little but very important sub-biomes –<br />
local variations in ecology and crops – accompanied by important infrastructure like roads, rail,<br />
transmission lines and facilities that generate wastes.<br />
Since biomass power development, like politics, is local, opportunities in the immediate area<br />
sometimes trump biomes. For example, you might expect an ethanol plant in the farmlands of<br />
Identifying Effective <strong>Biomass</strong> Strategies: Page 137<br />
Quantifying Minnesota’s Resources and Evaluating Future Opportunities
central Minnesota to burn biomass in the form of DDGs or crop wastes. But Central Minnesota<br />
Ethanol Cooperative in Little Falls fuels a gasifier with waste wood from nearby millwork plants<br />
and sawmills. The choice of fuel for any specific opportunity will ultimately be decided by its<br />
availability and price, not by a priori notions of its appropriateness.<br />
Having said that, we suspect that in most cases biomass fuel selection still will depend on the<br />
predominant biomass types in the immediate area. The relationships among those biomass<br />
resources and all the types of infrastructure necessary to a biomass power plant are<br />
complicated but critical. The suite of maps in gopher will help the user gain an understanding of<br />
resource availability alongside existing infrastructure.<br />
BIOMASS POWER’S CHALLENGES AND RESPONSES<br />
Given the complexity of developing effective bio-power projects, we try to make it easier by<br />
answering the challenges of biomass power development in Minnesota with some solutions to<br />
them. Some challenges arise from the properties of biomass itself, while others arise from<br />
limitations in technologies, markets, and institutions. Some challenges will be overcome with<br />
advances in technology or changes in policy. Other challenges may have to await changes in<br />
biomass’s cost relative to fossil fuels – not just lower biomass generation costs through the use of<br />
more efficient handling and conversion technologies, but also the higher fossil fuel prices that<br />
seem inevitable in the current world situation. <strong>Biomass</strong> applications are businesses that face<br />
typical business challenges. But they also have so many contact points with the ecology and<br />
with society at large that also present challenges to public policy makers.<br />
BUSINESS DEVELOPMENT CHALLENGES<br />
There is nothing unique about most challenges facing biomass power developers. They are<br />
familiar to entrepreneurs in any emerging technologies:<br />
• High input costs<br />
• Competition for supplies<br />
• Securing supplies<br />
• Information gaps<br />
• High capital costs<br />
• Increased risk in financing new<br />
technologies<br />
• Permitting and regulation<br />
• High transaction costs<br />
• Monetizing non-financial benefits<br />
• Marketing byproducts<br />
High Cost of <strong>Biomass</strong> Fuels<br />
When comparing current market prices, most biomass fuels cost more than coal, the<br />
predominant fuel used in electric power generation. One may wonder how that can be when<br />
so many biomass fuels are wastes. The answer is the high cost of energy and effort expended in<br />
collecting, transporting, and processing biomass into usable fuel delivered to the power plant.<br />
Compared to coal, biomass is a dispersed resource that doesn’t lend itself to efficient<br />
transportation and handling within our current system. Additionally, the infrastructure for<br />
delivering coal quickly and efficiently is the product of various local, state, and federal<br />
incentives to support its development over many decades.<br />
Page 138<br />
Identifying Effective <strong>Biomass</strong> Strategies:<br />
Quantifying Minnesota’s Resources and Evaluating Future Opportunities
<strong>Biomass</strong> also tends to have a low energy density which means it contains less energy per volume<br />
than traditional sources of energy. This results in an increase of overall transportation costs for<br />
biomass resources.<br />
Responses to High Costs<br />
Using biomass in high-cost applications. While biomass is typically uncompetitive with coal, it<br />
can compete with natural gas. Since natural gas is the fuel of choice for peaking plants – plants<br />
that intermittently kick into service during periods of peak electricity needs – perhaps biomass<br />
peaking plants could compete with biomass gasified to burn in turbines. Unlike a typical<br />
combustion plant, a gasification/combined-cycle plant could respond quickly to the varying<br />
demands of the grid. Once it is fully commercialized, which will be soon, biomass gasification<br />
technology will take its place in combined-cycle power plants capable of higher efficiencies<br />
than steam-cycle plants.<br />
Lowering harvest, collection, storage and processing costs. Work has begun on designing a new<br />
generation of equipment designed specifically to handle biomass more efficiently. Machinery<br />
and strategies for harvesting, collecting and processing corn stover are in the development<br />
phase (Atchison and Hettenhaus, 2003 and Glassner, Hettenhaus, and Schechinger, 1998).<br />
Other harvest technologies first developed offshore now are making their way into the U.S. When<br />
cellulosic processes, the subject of much research and discussion, comes into use commercial<br />
use in ethanol plants, there will be a strong impetus to develop more efficient handling of<br />
agricultural wastes to feed them. <strong>Biomass</strong> power plants too will benefit from those new<br />
developments.<br />
Forested areas also will see new handling technologies, many of them imported from countries<br />
that manage their forests more intensively than we do. For some time, Sweden has used forest<br />
residue bundlers to harvest logging residues. American firms have just begun to import and<br />
experiment with these machines (Peterson, 2005). Some Minnesota- based research efforts have<br />
included the use of logging slash bundlers.<br />
Using new technologies to extract more energy from biomass. <strong>Biomass</strong> gasification technologies<br />
have the potential to extract far more energy from a given amount of biomass fuel. We have<br />
seen biomass gasification replace natural gas in ethanol plants, and, as suggested above,<br />
perhaps it can do it in peaking plants as well.<br />
Several major industries in Minnesota are interested in gasification. The pulp and paper industry<br />
could use it to become self-sufficient in energy (Larson, et. al. 2003). Rising natural gas prices<br />
and pressures to reduce air emissions will motivate the ethanol industry to adopt it (Sparby and<br />
Massie, 2006 and Anfinson, 2005). Central Minnesota Ethanol Co-Op (CMEC) recently started up<br />
to do both – eliminate purchases of natural gas and reduce air emissions. The CMEC gasifier is<br />
among several biomass gasification systems that represent the first commercial applications of<br />
that technology in Minnesota.<br />
Policies to Encourage Innovation. State policies to aid the development and adoption of<br />
emerging biomass technologies should address various stages of technology development and<br />
adoption. In the early stages, funding of product development and research into the economic<br />
benefits of new technologies can help to speed commercialization. Once those technologies<br />
have become commercially established, information and financial support can reduce financial<br />
risk to their adopters.<br />
Identifying Effective <strong>Biomass</strong> Strategies: Page 139<br />
Quantifying Minnesota’s Resources and Evaluating Future Opportunities
Potential Future Carbon Regulation. In addition to efforts to reduce the cost of biomass, it is<br />
becoming more and more likely that there will be some sort of carbon regulation initiated within<br />
the decade. Although this won’t impact the costs of biomass directly (since burning biomass<br />
has a net zero carbon impact 3 ), it will increase the costs of fossil fuel resources. This would result<br />
in more price competitiveness between traditional electric power resources and biomass<br />
options.<br />
Competition for Fuels<br />
Many of the state’s biomass resources already are consumed by industry or agriculture, another<br />
reason for the high cost of some biomass fuels. <strong>Biomass</strong> is a renewable resource, but not an<br />
infinite one. Land is one constraint. Roughly half of Minnesota’s land is in fields and pasture, 19%<br />
is in either developed land or protected wetland, and 29% is in commercial timberland not set<br />
aside in wilderness or parks (Miles, Brand, and Mielke, 2006).<br />
Half of that commercially available forest land is publicly owned and thus obliged to serve other<br />
purposes besides production, like wildlife, hunting, hiking, and camping. The other half is mostly<br />
owned by private parties for a variety of purposes that don’t include, and in fact may run<br />
counter to, timber harvest – hunting, hiking, and sitting in the shade. Competing uses contribute<br />
to perpetual complaints from the forest products industry that commercial harvest is too<br />
restricted.<br />
Like forests, agricultural lands are dedicated to many purposes that don’t include energy<br />
production. The controversy over the use of corn crops in ethanol plants shows how inelastic<br />
supply this supply is in the short term. Using food and feed crops for energy competes with their<br />
traditional uses.<br />
All of this suggests that there are not huge swaths of unutilized land in Minnesota that can be<br />
dedicated to biomass energy feedstocks. Developers of biomass power plants either have to<br />
compete with current biomass consumers, like paper mills or food processors, or seek out<br />
biomass feedstocks that are underutilized or wasted.<br />
Responses to Fuel Competition<br />
Avoiding disposal costs. Since commodity crops are too expensive to use as fuel, the<br />
alternative is to use waste biomass. The largest of these resources is corn stover. Others are<br />
logging residues, agricultural wastes, manures, food processing wastes, and other byproducts<br />
from agricultural processing. The cheapest are likely to be waste streams that, because of<br />
avoided disposal costs, enter power plants at a zero, or even negative, cost. As seen earlier,<br />
many pulp and paper mills; agricultural processing plants; and large dairy, hog, and poultry<br />
facilities already are using waste in this way. But they aren’t exploiting as much of its potential<br />
energy as they could using state-of-the-art technologies.<br />
3 While the combustion of biomass does lead to the release of CO2 into the atmosphere, biomass fuels are not<br />
considered to increase atmospheric CO2 concentrations. This is because the carbon molecules contained in biomass<br />
fuels would have been returned to the atmosphere upon the plant’s death and decomposition. In this sense the<br />
consumption of biomass fuels does not lead to the emission of greenhouse gases that would not have occurred<br />
otherwise. This is contrasted with the combustion of fossil fuels, which returns carbon to the atmosphere that has been<br />
sequestered from the atmosphere for tens to hundreds of millions of years. The carbon contained in these fuels would<br />
not be emitted to the atmosphere without human activity.<br />
Page 140<br />
Identifying Effective <strong>Biomass</strong> Strategies:<br />
Quantifying Minnesota’s Resources and Evaluating Future Opportunities
Learning more about the energy potential and costs of wastes. This idea goes to the very reason<br />
for this study – to present in a flexible, easy-to-use electronic format, BioPET, how much biowaste<br />
is generated, how much energy it contains, how much it costs delivered, and how much it is<br />
worth converted into electric power. Not only should this tool simplify an assessment of<br />
particular feedstocks, it (in conjunction with gopher) should help prevent an over-investment in biopower<br />
capacity that would demand more biomass than Minnesota can supply without harming<br />
its other industries or its ecosystems.<br />
Problems in Securing Long-Term <strong>Biomass</strong> Fuel Supplies<br />
Difficulties in securing fuel supplies contributed to the failure of the EPS/Beck project, which<br />
couldn’t amass enough land for plantations, and the NGPP project, because Itasca Power<br />
couldn’t find enough wood waste to fuel the plant. Some realized projects also may have<br />
concerns about supply. The Laurentian <strong>Energy</strong> Authority asked for and received a subsidy from<br />
the state for fuel supplies, and District <strong>Energy</strong> St. Paul has made a concerted effort to expand its<br />
control over municipal transfer stations (City of Albertville, 2006; City of St. Louis Park, 2007).<br />
A recent study of alternatives for the Rock-Tenn recycling paper mill, which is losing its long-time<br />
steam host, <strong>Xcel</strong> <strong>Energy</strong>’s High Bridge power plant due to a conversion to natural gas, suggests<br />
that nearly all biomass fuels in the Twin Cities Metro area are committed to other uses, including<br />
fuel for existing bio-power facilities. The study found that biomass fuels for Rock Tenn would be<br />
expensive and complicated. No single feedstock is in the area is abundant enough to fuel the<br />
mill (Nelson, 2007).<br />
Responses to Limited <strong>Biomass</strong> Fuels<br />
Response is the right word. Solution would not be. There has been some well intentioned but<br />
futile speculation about biomass alternatives. The bio-power developer will have to look long<br />
and hard at fuel supply, not just in the context of current availability but also in the context of<br />
contingencies that might affect future supply. Since concerted development of dedicated<br />
energy crops is uncertain, we have to work with what exists. So the only way to mitigate fuel<br />
resource risk is study. Beginning with resources like BioPET and gopher is a necessary first step.<br />
Information Gaps<br />
Investors may lack the technical knowledge to understand a new technology. Confronted with<br />
the unknown, they naturally retreat to areas they are familiar with. Studies have found that the<br />
inexperience of potential investors has proven to be a serious obstacle to the development of<br />
bioenergy facilities (Itron, 2004).<br />
Limited expertise and resources have challenged the adoption of anaerobic digester (AD)<br />
biogas power systems on dairy farms. While many farmers may have enough manure to support<br />
an AD system tied to generating equipment, they may not have the expertise or the time to<br />
operate it (DOC, 2003a).<br />
While the size of Minnesota’s biomass resources is known (see Chapter II), the impact that new<br />
bio-power facilities would have on their availability and price is difficult to model. There are few<br />
bio-power facilities in the Upper Midwest on which to base supply curves.<br />
This lack of information is a particular concern because demand for many biomass feedstocks is<br />
inelastic. Substantial new demand for biomass materials could dramatically increase biomass<br />
Identifying Effective <strong>Biomass</strong> Strategies: Page 141<br />
Quantifying Minnesota’s Resources and Evaluating Future Opportunities
feedstock prices, and those higher prices could have a devastating short-run effect on both<br />
current consumers of biomass and potential new entrants to the marketplace. If substantial<br />
portions of the state’s biomass production were diverted to bio-power facilities, the pulp and<br />
paper and livestock industries would have trouble finding the reasonably priced fiber and feed<br />
they need to stay in business. On the other hand, new companies entering the biomass power<br />
business on the assumption they can buy feedstocks at current prices may discover that current<br />
biomass consumers are willing to outbid them in order to maintain supply. When the Fibrominn<br />
plant began construction, concerns were heard that its consumption of 31 to 40% of Minnesota’s<br />
poultry litter would take that fertilizer away from organic farmers (EQB. 2001b).<br />
Response to Information Gaps<br />
The solution to problems of this kind lies in modeling the response of biomass markets to the new<br />
bio-power plants, as well as continuing efforts to quantify the state’s biomass inventories and<br />
production. Information tools like BioPET can reduce the gap in information on the availability<br />
and costs of biomass resources for power generation.<br />
The advent of several new bio-power facilities and the maturity of the state’s corn ethanol and<br />
soybean biodiesel industries indicate that biomass development is understood better in<br />
Minnesota than in most states. Where gaps remain, potential policy and market-based solutions<br />
can help meet the challenge. Minnesota’s departments of Agriculture and/or Commerce<br />
could give farmers guidance in developing anaerobic digesters, and the Pollution Control<br />
Agency could standardize approval processes. Utilities have a stake in partnerships with farmers,<br />
too. Dairyland Power Cooperative works with third-party contractors to build and operate<br />
digesters and generating equipment on farms. Farmers receive payments for biogas the<br />
digesters generate (less management fees), and they don’t have to assume the risks and the<br />
responsibility of managing the systems.<br />
Some information gaps can be filled only by experience – by doing – because, in the words of<br />
Yogi Berra, it’s hard to make predictions, especially about the future. Time will determine the<br />
highest and best use of Minnesota’s unused biomass and the most efficient means of harvesting<br />
and processing it. They might become a feedstock for bio-based manufacturing, bio-refining,<br />
and cellulosic ethanol.<br />
Studies have shown that the costs of residue collection are sensitive to a number of variables,<br />
including road quality, success in reducing contamination by rocks and dirt, and the integration<br />
of processing with logging operations (Rawlings, Rummer, Seeley, Thomas, Morrison, Han, et. al.<br />
2004). These questions of operating costs and commercial success in using Minnesota’s biomass<br />
can be answered only by experience. For the entrepreneurial developer, insufficient information<br />
and unforeseen consequences are unavoidable risks. When everybody knows how to do<br />
something, they all do it and that floods the market.<br />
High Capital Costs<br />
Not only does biomass fuel currently cost more than coal, plants that use biomass also cost more<br />
to build than coal-fired plants. With the possible exception of syngas in a peaking plant,<br />
biomass fuels may be best suited to firing base load generating power plants. Unfortunately, a<br />
biomass-only, base-load power plant will cost significantly more per MW than a comparable<br />
coal plant. It will most likely be smaller (< 60 MW) because the cost of transporting biomass fuels<br />
over long distances militates against a larger plant. A biomass plant can’t take advantage of<br />
economies of scale enjoyed by coal-fired plants.<br />
Page 142<br />
Identifying Effective <strong>Biomass</strong> Strategies:<br />
Quantifying Minnesota’s Resources and Evaluating Future Opportunities
Recent projects in Minnesota and neighboring states demonstrate that stand-alone biomass<br />
power plants cost more than traditional plants. Public records show biomass power plants<br />
ranging from $2,500 to $3,000 per kW of installed capacity (Burns & McDonnell, 2005; Trillium<br />
Planning and Development, 2002; and “Poultry Litter”, 2005.) a lot more than the $1,800 per kW<br />
of installed capacity that a 600 MW supercritical pulverized coal power plant (Burns &<br />
McDonnell, 2005). They also entail costly handling facilities. The Laurentian <strong>Energy</strong> Authority in<br />
Hibbing/Virginia had to build a wood processing and storage yard between the two cities.<br />
Capital Cost Comparison<br />
$3,500<br />
$3,000<br />
$2,500<br />
$2,000<br />
PC<br />
w/ 5% Co-<br />
Fire<br />
Pulverized<br />
Coal<br />
13 MW<br />
Local<br />
<strong>Biomass</strong><br />
Poultry<br />
Litter<br />
On Farm<br />
Plug Flow Wood<br />
DigesterStoker<br />
Boiler<br />
$1,500<br />
$1,000<br />
Co-Firing<br />
$500<br />
$0<br />
Responses to High Capital Costs<br />
Figure IX-1: Power Plant Capital Costs ($/kW)<br />
CHP. Steam sales (or internal uses of steam) over time might offset the high capital costs of<br />
biomass power facilities. It is virtually impossible to find a steam host in Minnesota to serve a<br />
canning plant or a paper mill.<br />
Co-Firing. Adding biomass fuel to coal at an existing plant costs far less than building a new<br />
biomass-only plant or CHP plant, even when including additional equipment costs to handle the<br />
new fuel.<br />
Research Toward Best Practices. As a matter of policy, support for research into co-firing could<br />
lead to promulgation of best practices that could remove much of the technological risk.<br />
Difficulties in Financing New Technologies<br />
MnVAP, EPS/Beck, and Fibrominn all struggled to finance their projects, to a large degree,<br />
because of technology risk. Combining technology risk with fuel resource risk, and you have a<br />
hard case to present to investors and lenders.<br />
Response; Laying the Groundwork<br />
While firm financial commitments won’t be forthcoming until a PPA is signed, it helps to explore<br />
financing terms with investors and lenders early in the process in order to avoiding unpleasant<br />
surprises later after money has been spent in planning the project.<br />
Identifying Effective <strong>Biomass</strong> Strategies: Page 143<br />
Quantifying Minnesota’s Resources and Evaluating Future Opportunities
Difficulties in Permitting<br />
<strong>Biomass</strong> projects also have run into problems in permitting and approvals, again because of<br />
their novelty. In the case of Fibrominn, the Minnesota Pollution Control Agency required much<br />
more information on emissions rates than the developers expected. This kept the project on<br />
hold for a long time. PCA needed the data because there is no dataset that regulators can<br />
draw on to model emissions from turkey litter. <strong>Project</strong> developers should anticipate that the<br />
permitting process for novel technologies may take longer than permitting for well-characterized<br />
technologies.<br />
Response to Permitting Difficulties<br />
These difficulties will lessen as regulators gain more experience with biomass projects and data<br />
available from biomass projects increases. As biomass power moves from an experimental<br />
technology to one with standardized designs, databases generalized from them will become<br />
available to regulators. The MPCA is acting to build its ability to deal with the permitting of<br />
biomass facilities.<br />
Defining <strong>Biomass</strong> Power Plants as Waste Combustors<br />
Waste combustors present a particular issue in permitting. Because the definition of waste in<br />
state rules may apply to certain biomass feedstocks, biomass power plants could be subject to<br />
standards more stringent than those that apply to traditional power plants.<br />
Two ways to avoid waste combustor requirements<br />
To date, biomass developers have addressed that problem by applying for a variance from the<br />
Minnesota Waste Combustor Rule. A second way to avoid Waste Combustor standards is to<br />
apply for a case-specific Beneficial Use Determination. The granting of a variance or a<br />
Beneficial Use Determination serves to clarify only the applicability of the rules governing waste<br />
combustors, not the need to satisfy other air emissions permitting requirements.<br />
The MPCA has proposed language that would specifically exempt facilities combusting biomass<br />
feedstocks from the state’s Waste Combustor rules. The proposed rule change would<br />
specifically apply to facilities burning forestry residues, wood mill residues, agricultural residues,<br />
dedicated energy crops, finished agricultural products, urban wood wastes, and poultry litter.<br />
High Transaction Costs<br />
The relatively small scale of bio-power facilities makes transaction costs disproportionately high.<br />
Regardless of scale, power plants require engineering studies for design and constructing and<br />
contractual arrangements for connecting to the grid and agreeing upon satisfactory rate<br />
agreements. Rates depend partly on the avoided generation, transmission, distribution, and<br />
emissions costs of the utility. Since those costs are not uniform throughout the state, establishing<br />
a reasonable estimate may entail substantial study.<br />
Not only are the costs of such studies high relative to the output of small power generators, the<br />
question of who pays their cost is an issue, at least for biomass power plants larger than 10 MW.<br />
That is the upper size limit to qualify for PUC’s generic interconnection and operating tariffs for<br />
distributed power generation in Minnesota (PUC, 2004). For plants under 10 MW, the generic<br />
tariffs dictate who pays for studies, how much those studies cost, and how rates and credits will<br />
Page 144<br />
Identifying Effective <strong>Biomass</strong> Strategies:<br />
Quantifying Minnesota’s Resources and Evaluating Future Opportunities
e calculated. Plants above 10 MW do not qualify for standard interconnection agreements, so<br />
they may find transaction costs a barrier.<br />
Other transaction costs for bio-power plants, regardless of size, are interconnection and standby<br />
rates. In discussing standardized interconnection agreements between utilities and distributed<br />
generation facilities, proponents of distributed generation (DG) often express a concern that<br />
utilities could deliberately set rates high to discourage development of DG facilities (DOC,<br />
2003b). Since the PUC chose not to regulate those costs under the generic standards, they<br />
remain a potential barrier to the development of biomass power plants of any size.<br />
Response to High Transaction Costs<br />
Several policy solutions could lessen the negative effects of high transaction costs on the<br />
development of bio-power projects. Standard offer contracts would ease the development of<br />
renewable energy projects by removing the need to negotiate contracts and by enabling<br />
potential bio-power investors to plan projects according to known contract terms. Another<br />
solution would be the extension of distributed generation standard interconnection agreements,<br />
or at least a portion thereof, to include all bio-power facilities.<br />
An Inability to Monetize Benefits<br />
<strong>Biomass</strong> power plants, like other environmental projects, have difficulty capitalizing on the<br />
external benefits that they may confer on society. Anaerobic digesters (ADs) provide a good<br />
example of this problem. Many large dairy facilities impact their neighbors with odors from<br />
manure. More important, manure applied to farm fields and spills of untreated manure from<br />
ruptured lagoons lead to high levels of runoff that increase the nutrient load in Minnesota’s rivers<br />
and lakes.<br />
ADs (whether used for energy or not) can dramatically reduce odors and virtually eliminate<br />
nutrient runoff. Dairy operations with ADs in operation incur fewer complaints from neighbors<br />
and less risk of regulatory actions for excessive nutrient runoff. But the benefits to society of<br />
aerobic digestion far surpass those small benefits to dairy operators. If those societal benefits<br />
could be monetized, they would improve the economics of AD biogas powered generators<br />
(DOC, 2003a).<br />
Response that Monetizes Benefits<br />
Among policy solutions to remedy this market failure, the state (or local governments) could<br />
offer additional incentives to bio-power projects that can demonstrate improvements to local<br />
air or water quality.<br />
Marketing of Waste Streams from Co-Firing<br />
<strong>Biomass</strong>-only power plants can potentially sell fly ash as a soil amendment to foresters or farmers.<br />
The Fibrominn poultry litter plant in Benson plans to do just then thereby turning a potential<br />
disposal cost into a revenue stream. Coal plants typically sell their fly ash to the concrete<br />
industry.<br />
When plants co-fire coal and biomass, however, their fly ash is currently worthless. That’s<br />
because it doesn’t meet the standard of the American Society for Testing and Materials (ASTM)<br />
governing the use of fly ash in concrete. The standard (ASTM C618) refers only to fly ash from<br />
Identifying Effective <strong>Biomass</strong> Strategies: Page 145<br />
Quantifying Minnesota’s Resources and Evaluating Future Opportunities
power plants burning coal, not fly ash from co-firing applications. And conversely fly ash from<br />
coal can’t be used as a soil amendment. ASTM is considering a change in the standard, but<br />
data on co-fired fly ash is ambiguous. Studies have indicated that some fly ash from some cofiring<br />
facilities meets the standards while that from others does not (Dockter and Eylands, 2003<br />
and Baxter and Koppejan, 2004).<br />
Marketability of fly ash is a serious matter. Losing that revenue stream can be a deal breaker for<br />
some coal plants interested in co-firing. Economic analysis of one experimental co-firing project<br />
found that losing ash sales would have to be offset by switchgrass prices lower than farmers<br />
could deliver it for (Antares Group Incorporated, 2002).<br />
Response to Co-Firing Challenge<br />
Adapting the ASTM standard to allow fly ash from co-firing applications would clarify its<br />
marketability. Expanding the standard to a performance standard would increase flexibility for<br />
using various ash resources. Research could establish a performance standard that plants<br />
interested in co-firing could refer to. Questions whether fly ash from co-firing meets the standard<br />
then would be settled on a facility-by-facility basis.<br />
LEGISLATIVE AND REGULATORY CHALLENGES<br />
Lessons Learned from the <strong>Biomass</strong> Mandate<br />
The state’s original biomass mandate contained several provisions that proved to be impassible<br />
barriers to cost-effective development of biomass power in Minnesota. The two most<br />
problematic were: (1) that biomass power plants be powered by “farm-grown closed-loop<br />
biomass” and (2) that those biomass-powered plants be new ones using biomass for most of<br />
their fuel.<br />
These provisions are largely responsible for the fact that none of the biomass power used to fulfill<br />
the mandate has actually met its original terms (Morris, 2005). By declaring that the mandate<br />
could only be met by biomass-only power plants firing farm-grown closed-loop biomass, the<br />
original legislation dictated the use of the highest cost/highest risk fuel in the highest cost/highest<br />
risk power plants. Years after the original biomass mandate, “farm-grown closed-loop” biomass<br />
sources are still non-existent. Growers find excessive the risk of experimental crops with long lead<br />
times and high costs of establishment – especially when a market for them doesn’t exist.<br />
This history teaches lessons relevant to both policy makers and potential project developers and<br />
investors.<br />
Misguided <strong>Biomass</strong> Mandates<br />
Poorly considered mandates defy commercial or economic solutions. The Department of Public<br />
Service (DPS) captured some of the problem at work between <strong>Xcel</strong> <strong>Energy</strong> and project<br />
developers in their comments on the proposed PPAs of District <strong>Energy</strong> and EPS/Beck. As DPS saw<br />
it, <strong>Xcel</strong> <strong>Energy</strong> was put under pressure to fulfill the mandate quickly with very few options to<br />
choose from. Lacking options, <strong>Xcel</strong> <strong>Energy</strong> was at a disadvantage in bargaining for better<br />
prices. And, in the end, <strong>Xcel</strong> <strong>Energy</strong> had little incentive to bargain anyway because the<br />
mandate let them pass through higher costs to ratepayers.<br />
Page 146<br />
Identifying Effective <strong>Biomass</strong> Strategies:<br />
Quantifying Minnesota’s Resources and Evaluating Future Opportunities
To realize its goal, a mandate must be clear and achievable. The combination of the “closedloop”<br />
provision with the aggressive timeframe of the original legislation ensured that the terms of<br />
the original legislation could not be met. To expect that sufficient “closed-loop” biomass – an<br />
experimental fuel source which had not been tried commercially – would become available<br />
within three and a half years of the legislation’s passage to fuel 50 MW, and then 75 MW within<br />
another four and a half, is not reasonable. To plan, design, permit, contract for, and build even<br />
a small coal plant in four and a half years would be difficult. To raise financing, contract for vast<br />
acreages, educate farmers in the techniques of growing experimental closed-loop crops,<br />
acquire enough seed or seedlings, plant the necessary acres, and successfully grow, harvest<br />
and deliver fuel adequate to operate the plant, all in a very short period of time, was<br />
insurmountable.<br />
Considering the pandemonium of the last-minute negotiations leading to the Prairie Island<br />
Agreement, it is not surprising that the mandate was unrealistic. Once the failures of the MNVAP<br />
and EPS/Beck projects showed that the mandate was unworkable, other project developers<br />
saw their opening to seek changes in the statute’s fuel requirements to the benefit of their own<br />
projects. Thus rather than being systematically reconsidered, the mandate was tinkered with<br />
piecemeal to make it fit specific projects. Successful proposals were driven by political clout<br />
and does not necessarily translate into technical ability and economic prudence.<br />
The capital costs of co-firing biomass in a coal-fired power plant are a fraction of the costs of<br />
building a new power plant. The only new capital investments needed to co-fire biomass are for<br />
fuel handling, storage and processing equipment, and perhaps some minor boiler modifications.<br />
The Chariton Valley <strong>Biomass</strong> project in southern Iowa estimates the capital costs associated with<br />
their co-firing initiative at $439/kW (Antares Group Incorporated, 2002), only 12% of the $3,600<br />
per kW for the Fibrominn plant in Benson 4 (“Poultry Litter”, 2005).<br />
It has taken 14 years for <strong>Xcel</strong> <strong>Energy</strong> to fulfill the Prairie Island biomass power mandate. The<br />
Fibrominn facility in Benson combined with the Laurentian <strong>Energy</strong> Authority facilities in Virginia<br />
and Hibbing finally will put Minnesota biomass generation at 110 MW. Were it not for the<br />
mandate’s opposition to co-firing and its insistence on “closed loop” biomass, its target could<br />
have been met more quickly and less expensively.<br />
Response to Misguided Policies: Rational Objectives and Funding for Appropriate<br />
Research<br />
To achieve their intended ends, mandates must proclaim clear strategic goals and objectives,<br />
not micromanage tactics. By advancing a narrow, prescriptive, and impossible project<br />
definition, the 1994 biomass mandate was bound to fail. A more generic mandate, like the 2007<br />
Renewable <strong>Energy</strong> Standards which define renewables broadly and let the utilities decide how<br />
to meet clear, simple goals should work more effectively.<br />
In addition to establishing broad goals, the state can further them with appropriate research.<br />
The state has funded studies to develop sustainable land management practices and<br />
determine emissions levels from biomass gasifiers. That funding may have benefited certain<br />
current projects, but the studies, which are public information, will benefit future biomass projects<br />
as well.<br />
4 $3,600 per kW is calculated from the $202 million construction contract to build the 55 MW power plant.<br />
Identifying Effective <strong>Biomass</strong> Strategies: Page 147<br />
Quantifying Minnesota’s Resources and Evaluating Future Opportunities
Public and Political Relations<br />
As the history of Minnesota biomass projects suggests, politics is an inescapable consideration in<br />
developing a successful energy project. Local politics can be quite helpful (or quite destructive)<br />
because citizens talk to their local elected officials who talk to the legislature who talk to state<br />
agencies. Residents may love the idea of a biomass project as long as it isn’t built anywhere<br />
near their homes.<br />
Responding in Advance<br />
Responding in advance may seem an oxymoron, but it is important to get out in front of public<br />
opinion before it congeals into opposition, as CapX 2020 has tried to do recently by sending<br />
letters to citizens even remotely within the area of its projected transmission lines. When local<br />
opinion favors a project, it is easier to go to the state for incentives like the tax exemptions and<br />
special appropriations that the legislature may provide.<br />
The Challenge of Picking Winners in Evolving Technologies<br />
Policy-makers naturally tend to deal with one issue at a time – a particular problem that needs a<br />
particular solution. In a legislative body whose members see the world through differing prisms,<br />
issues must be kept within certain bounds in order to be decided. Try to put too many issues in<br />
one bill, and political stalemate might follow. Critical though they may be, overarching issues,<br />
like how to strike the right balance among conflicting demands on biomass resources, might get<br />
lost in parochial bickering when they are written into bills.<br />
<strong>Biomass</strong> may be about as uncertain a future as can be, fraught as it is with technological risk,<br />
financial risk, market risk, policy risk, the risk of unforeseen competition for raw materials, not to<br />
mention droughts, floods, infestations, and other natural calamities. So for balanced, long-term<br />
economic policy, the public turns to government – not necessarily to dictate to businesses, but<br />
to limit their excesses and lead them, with sticks like mandates and carrots like tax incentives, in<br />
directions assumed to be more beneficial to the wider public.<br />
Therein lies the rub. As mentioned earlier, lawmakers in the past went too far and prescribed<br />
specific means, as they did in the Prairie Island Mandate. The more that policies focused on<br />
specific technologies and specific end uses, the more likely those policies were to distort the<br />
marketplace. If the state directs rewards or mandates toward biomass electric generation, the<br />
market will move in that direction even though fundamental economics may favor other uses,<br />
like thermal applications or liquid fuel production.<br />
Distortions like these may limit opportunities to utilize biomass in the future. Over-investment in<br />
unsustainable industries could create lobbies that interfere with potentially more productive uses<br />
of resources like, say, cellulosic ethanol production or bio-refining.<br />
It is impossible to predict which of these inchoate technologies will add the greatest value to<br />
Minnesota’s biomass feedstocks. All our analyses are based on current performance. Many<br />
advanced biomass conversion technologies, like gasification, cellulosic ethanol, and fast<br />
pyrolysis for bio-oil, are too new to offer much in the way of data on which to base projections.<br />
We know that liquid fuels command a higher price per BTU than solid or gaseous fuels, so<br />
cellulosic ethanol may provide higher returns than biomass power generation. But feedstocks<br />
for the chemical industry command even higher prices than liquid fuels, so chemical coproducts<br />
made in bio-refineries along with liquid fuels may yield a higher return than liquid fuels<br />
Page 148<br />
Identifying Effective <strong>Biomass</strong> Strategies:<br />
Quantifying Minnesota’s Resources and Evaluating Future Opportunities
alone. A decade or two from now, even newer technologies may emerge that render these<br />
speculations moot.<br />
Any of these technologies can be used to generate electricity. To date, both syngas from<br />
biomass gasification and bio-oil from fast pyrolysis have been used to fuel power generation in<br />
commercial facilities (Kotrba, 2005; Stephens, 2006). Two cellulosic ethanol facilities recently<br />
rewarded funding by the DOE are designed to generate electricity as well as bio-fuel (DOE,<br />
2007).<br />
Response to the Impossibility of Predicting the Future Development of <strong>Biomass</strong> <strong>Energy</strong><br />
In the face of rapid change, policy makers can encourage the use of biomass best by letting<br />
market forces decide the most economically successful combinations of applications and<br />
technologies. Policy makers can benefit from computer models that explore consequences of<br />
policy decisions, like one that Sandia National Laboratories is designing for the Minnesota Bio-<br />
Business Alliance. But they must bear in mind that even sophisticated computer tools are not<br />
crystal balls. Contingency always has ruled human affairs, and that won’t change any time<br />
soon.<br />
Broad and Narrow Policy Measures<br />
Broad Policy Measures<br />
Broad policy measures use financial incentives or regulatory pressures to encourage the<br />
development of renewable energy. They depend on the profit motive and the need to comply<br />
with regulatory pressures to move private enterprise in a publicly beneficial direction.<br />
Renewable <strong>Energy</strong> Standard<br />
A good example of a broad policy measure is Minnesota’s aggressive renewable energy<br />
standards law of 2007 setting clearly-defined goals for electric utilities without prescribing the<br />
means to reach them. The law requires that 25% of utilities’ retail sales must come from<br />
renewable fuels by the year 2025 except <strong>Xcel</strong> <strong>Energy</strong>, whose goal is 30% by 2020. The standard<br />
ramps up gradually over the years until it reaches those levels. The statute defines renewables<br />
broadly, including as biomass fuels things like municipal solid waste, and leaves each utility to<br />
decide how it wants to configure its portfolio of renewables. <strong>Xcel</strong> <strong>Energy</strong> is counting mostly on<br />
wind, while Minnesota Power, due to location and load demands, will probably use as much<br />
biomass as possible.<br />
Even though wind will be by far the pre-eminent renewable fuel that utilities will use to meet the<br />
standard, the statute will encourage biomass projects too because they will count as much as<br />
wind power in the renewable portfolio. This motivation may make utilities willing to pay more for<br />
biomass power, provide technical expertise to project developers, minimize transaction costs,<br />
and minimize barriers arising from transmission. The renewable energy credit tracking system will<br />
give independent biomass power producers a way to market their renewable energy credits<br />
and improve their financial results.<br />
Production Incentives or Tax Credits<br />
Electricity generated with biomass fuels may be eligible for federal production tax credits and<br />
on-farm anaerobic digesters qualify for Minnesota’s Renewable <strong>Energy</strong> Production Incentive.<br />
Production tax credits and incentives have been powerful drivers of the wind industry in the<br />
Identifying Effective <strong>Biomass</strong> Strategies: Page 149<br />
Quantifying Minnesota’s Resources and Evaluating Future Opportunities
United States and Minnesota. The success of these programs in the wind industry lies in the fact<br />
that wind-generated electricity competes closely with more traditional forms of new generation<br />
capacity. Other renewable energy technologies have not benefited as much from these<br />
subsidies because the subsidy is not sufficient to make these technologies economically viable.<br />
Minnesota could increase biomass power generation by expanding its production incentive<br />
program to cover more biomass-related technologies.<br />
One option to potentially expand the effectiveness of such an initiative is too vary it by fuel<br />
source or technology. This could help ensure that different feedstocks and technologies are<br />
developed regardless of market maturity. Levels could be adjusted by cost or risk assessment.<br />
Caution must be maintained so as not to develop too specific of a structure and suffer the same<br />
fate as the 1994 <strong>Biomass</strong> mandate. If such a strategy were to be implemented, it must be<br />
reviewed periodically to adjust to changes in the marketplace.<br />
Standard Offer Contracts<br />
Standard offer contracts have been used successfully in other countries to promote renewable<br />
generation. These are contracts, with terms set by the state, that govern the relationship<br />
between qualifying renewable energy generators and local utilities. Standard offer contracts<br />
minimize transaction costs by providing project developers with known prices and contractual<br />
terms. They can also serve as an incentive mechanism if the price is set at a level attractive to<br />
potential investors. Like tax credits and production incentives, the prices set by these contracts<br />
varies according to fuel type and/or generation technology. It should be remembered that just<br />
mandating standard offer contracts is not enough to increase renewable energy capacity.<br />
Regulatory processes and utility policies still can erect barriers, intentional or not, to projects that<br />
plan to use standard offer contracts. To ensure that standard offer contracts achieve their full<br />
potential, regulators need to ensure that transaction costs associated with permitting and<br />
interconnection are minimized.<br />
Renewable <strong>Energy</strong> Credits and Carbon Offsets<br />
Renewable energy credits, or carbon emission offsets, provide renewable energy producers an<br />
indirect means of monetizing some of the non-energy benefits of their facilities. There are a<br />
number of renewable energy credit and carbon offset programs. Some base their rates on the<br />
number of kWh that a user wishes to offset. Rates for these programs vary from 0.5¢ per kWh to<br />
7.5¢ per kWh. Others base their rates on the number of tons of carbon dioxide emissions that a<br />
user wishes to avoid. Rates for these programs range from $5 to $12 per ton of CO2 avoided<br />
(EERE, 2006). These programs employ a number of strategies. Some collect funds and offer the<br />
funds as a subsidy to new renewable energy facilities to enhance their economic viability. Other<br />
programs offer credits for renewable energy already produced.<br />
The Midwest Renewable <strong>Energy</strong> Tracking System (M-RETS) is particularly relevant to biomass<br />
power projects in Minnesota because it probably will become the system of record for<br />
Minnesota’s new renewable energy standard. It will track actual generation by renewable<br />
energy generators so that utilities can purchase and trade renewable energy credits to meet<br />
state renewable energy standards. The system will allow utilities to meet renewable energy<br />
standards with projects that they do not own, or are not in their service areas. It also serves the<br />
important function of providing renewable energy generators with a potential revenue stream.<br />
Carbon offsets were recently cited in an argument against an approval needed by a large new<br />
coal-fired plant. The Minnesota Department of Commerce recommended that the Minnesota<br />
Public Utilities Commission deny approval of new transmission capacity for the Big Stone II<br />
Page 150<br />
Identifying Effective <strong>Biomass</strong> Strategies:<br />
Quantifying Minnesota’s Resources and Evaluating Future Opportunities
project in South Dakota because it expected that carbon dioxide emissions would be regulated<br />
in the future.<br />
The application should not be approved unless the Applicants develop and<br />
submit for Commission review a plan to offset the 4.7 million tons of CO2 emissions<br />
enabled by the proposed transmission lines. Since carbon costs are expected in<br />
the future, it is necessary to address these costs in a reasonable manner. If<br />
carbon costs are not adequately addressed, it would be unreasonable to find<br />
that the proposed project is in the public interest (DOC, 2007).<br />
The commission suggested a number of actions that could be taken to address the cost of<br />
carbon emissions. They included:<br />
• adding DSM energy savings above the least-cost amount as determined in each utility’s<br />
resource plan as approved by the PUC;<br />
• generating additional wind power, including C-BED resources, above the least-cost<br />
amount determined in each utility's resource plan as approved by the PUC;<br />
• shutting down older high-emission generating facilities and replacing the energy with<br />
more efficient or lower carbon-emitting sources;<br />
• joining an organization such as the Chicago Climate Exchange or executing an<br />
arrangement directly with a carbon-emitting entity to fund that entity's reductions in<br />
carbon emissions;<br />
• purchasing agricultural or timber lands to be managed for the purposes of carbon offsetsequestration;<br />
or<br />
• using any other reasonable means that lead the Department to conclude that carbon<br />
offsets have been created.<br />
The inclusion of carbon emissions costs in the regulatory process has positive implications for<br />
biomass power projects. The inclusion of carbon emissions costs in the costs of fossil fuels will<br />
lessen their relative price advantage over biomass fuels. This has the potential to improve the<br />
economic viability of biomass power.<br />
The use of renewable energy credits and carbon offsets in the regulatory process is new.<br />
Regulators face a number of hurdles in ensuring that these new tools are well regulated and<br />
implemented. They must verify that credits or offsets actually represent what they are marketed<br />
to represent. Ensuring that renewable energy credits are based on the actual generation of<br />
existing renewable energy generators (such as M-RETS) should be relatively simple because that<br />
can be verified through the generator’s metering equipment. It may be harder to ensure that<br />
renewable energy credits used to subsidize new renewable energy facilities are properly<br />
accounted for because they must be applied to facilities that do not yet exist. Verification of<br />
carbon offsets, particularly offsets based on sequestration of carbon in the soil, can be<br />
particularly problematic. The rate at which carbon is sequestered in soil is not yet well<br />
understood, and it may vary considerably by soil type and land use practices. In addition,<br />
verifying that carbon remains sequestered requires that limitations be placed on the use of the<br />
land for decades, if not centuries.<br />
Carbon Emissions Tax<br />
Taxing carbon emissions is a policy tool that may facilitate the growth of biomass power.<br />
<strong>Biomass</strong> fuels are considered to be carbon neutral and, as such, would not be taxed like fossil<br />
fuels under a carbon emissions tax. This tax advantage will make biomass fuels comparatively<br />
cheaper than they are currently. While individual states may have the power to impose a<br />
carbon tax on their own authorities, doing so would put them at a competitive disadvantage<br />
Identifying Effective <strong>Biomass</strong> Strategies: Page 151<br />
Quantifying Minnesota’s Resources and Evaluating Future Opportunities
against states that have not done so. For this reason most expect that any future carbon<br />
emissions taxes in the United States will be imposed at the federal level.<br />
Narrow Policy Measures<br />
Some more tailored policies are designed to overcome specific barriers to biomass power<br />
development. They rely upon the ability of the state to control the regulatory process, provide<br />
financial backing to projects, or even direct state funding towards specific research or<br />
infrastructure needs of project developers.<br />
Minimizing Transaction Costs<br />
Through its regulatory power, the state can ensure that transaction costs between biomass<br />
power developers and utilities are minimized. This can be achieved through standard offer<br />
contracts, standardized interconnection agreements (which utilities in Minnesota have been<br />
directed to develop), or net metering laws. These instruments can assist biomass power<br />
producers as well as power producers using other renewable fuels. Utilities have a mixed history<br />
in their dealings small power producers. Some are quite supportive of small facilities, while others<br />
have shown a reluctance to remove barriers that discourage small power producers from trying<br />
to interconnect with the grid. Policy makers should bear in mind that attempts to minimize<br />
transaction costs should consider all aspects of the transactions between regulated utilities and<br />
small renewable energy generators.<br />
Advancing New Technologies<br />
Minnesota already is pursuing policies to further the development of biomass power<br />
technologies and other biomass energy applications. Funding for basic research and product<br />
development is available from a number of sources, including state universities, the Renewable<br />
Development Fund, and other biomass-focused institutions. New technologies can further<br />
biomass power development by lowering power plant capital costs, increasing power plant<br />
efficiencies, reducing harvest and processing costs, improving knowledge of sustainable<br />
practices, and finding new uses of waste streams.<br />
New technologies can also be advanced by addressing the high costs of purchasing new<br />
technologies. Commercial lenders will often require a substantial premium for loans on<br />
technologies that lack an established commercial track record. The state can play a role to<br />
minimize the technology risk associated with such loans by providing loan guarantees, grants. or<br />
subsidies for project developers.<br />
Facilitating Regulatory/<strong>Project</strong> Development Process<br />
The state could alleviate a number of the barriers that arise during the project development<br />
process. Regulations concerning the applicability of waste combustor rules should be clarified.<br />
In addition the state should consider a blanket personal property tax exemption for biomass<br />
facilities. Section 272.02 of Minnesota Statutes 2006 contains specific exemptions for all of the<br />
existing and proposed biomass facilities in the state. To receive those exemptions project<br />
developers must expend considerable effort lobbying the state legislature. If it is the policy of<br />
the state to encourage biomass power development, the legislature should remove this<br />
obstacle and institute a blanket exemption.<br />
The technical capability of regulatory agencies to process permit applications for biomass<br />
facilities could be improved (it is our understanding that the PCA will be addressing the issues<br />
Page 152<br />
Identifying Effective <strong>Biomass</strong> Strategies:<br />
Quantifying Minnesota’s Resources and Evaluating Future Opportunities
surrounding air permits for biomass facilities). This could make one of the more challenging<br />
aspects of project development less frustrating, and potentially timelier.<br />
The state can also address project development costs by focusing on the infrastructure<br />
necessary for biomass power facilities. This can take the form of infrastructure funding for<br />
specific projects, such as road improvements to handle increased traffic. Such funding could<br />
alleviate local concerns about traffic levels, road conditions, and noise pollution. It may also<br />
take the form of infrastructure improvements that would benefit the biomass power industry as a<br />
whole. Examples of this may be the improvement of rail lines that would reduce transportation<br />
costs for biomass fuels.<br />
Tax Exemptions<br />
Another legislative barrier to biomass power development can be found in Minnesota Statutes<br />
297A and 272 which authorize tax exemptions for power plants. The legislature’s clear signal that<br />
they will exempt most electrical generating facilities from these taxes makes it inevitable that<br />
facilities will seek exemptions from the legislature. This may provide a significant barrier to smaller<br />
biomass power facilities that may not have the resources to lobby for such exemptions. A more<br />
cost effective policy may be to simply exempt those electrical generating facilities that utilize<br />
renewable energy sources to eliminate the need to lobby for special treatment.<br />
Local Challenges<br />
Any proposed power plant is likely to face some degree of opposition due to its effects on the<br />
local environment. Concerns about local air quality, increased traffic from fuel deliveries,<br />
increased noise, and the disposal of waste materials are likely to be raised by local citizens and<br />
groups concerned about a plant’s effects on its surroundings.<br />
Air emissions. In many instances a biomass-powered plant presents fewer challenges to the<br />
micro-environment than a coal plant. Mercury emissions, SO2 emissions, and waste disposal<br />
problems are less because biomass contains little mercury and sulfur. In fact, ash from biomass<br />
plants is marketed as a soil amendment. Other emissions, such as NOX and particulate matter,<br />
are comparable to hydrocarbon fuel sources.<br />
On the other hand, incomplete combustion in a biomass plant can generate higher carbon<br />
monoxide emissions than a plant fired by coal or natural gas. Carbon monoxide emissions lead<br />
to increased ozone levels and diminished air quality. The air quality effects of CO depend<br />
largely on local atmospheric conditions.<br />
Odors. <strong>Biomass</strong> fuel sources can give off strong odors during transportation and storage. For<br />
certain biomass fuels (turkey litter or manures, for example), odors need to be considered<br />
throughout the design process. Fibrominn has instituted operation and design strategies to<br />
minimize odor, like operating handling and storage facilities under negative air pressure and<br />
washing all delivery trucks before they leave the plant. For other fuels odors become a problem<br />
only if fuels are stored for extended periods of time before burning. Careful attention to the<br />
plant’s siting and design, along with careful planning of the fuel delivery, processing and storage<br />
operations, should minimize objections from neighbors.<br />
Traffic. A biomass plant’s effects on local traffic can be substantial. Study of delivery frequency<br />
for the Ottumwa (Iowa) Generating Station, which is planning 35 MW of switchgrass co-firing,<br />
indicates that 40 flat-bed deliveries per day will be needed to furnish 200,000 tons of switchgrass<br />
per year, a 50% increase over its past traffic (Antares Group Incorporated, 2002). While the OGS<br />
Identifying Effective <strong>Biomass</strong> Strategies: Page 153<br />
Quantifying Minnesota’s Resources and Evaluating Future Opportunities
study estimates that this increase will not pose any problems at the plant itself, this great an<br />
increase in truck traffic could tax local infrastructure and stir up opposition.<br />
Responding to community concerns. <strong>Project</strong> developers can avoid local political opposition by<br />
giving careful attention to project design and including the local community in the planning<br />
process. At the state policy level, support for local infrastructure improvements would help<br />
develop public support for bio-power projects.<br />
QUESTIONS OF SUSTAINABILITY<br />
The sustainability of using large amounts of biomass to generate electricity (or produce liquid<br />
fuels) is still very much in question. All plants uptake nitrogen compounds and other minerals<br />
from the soil for their metabolic processes. Since those minerals remain in the tissues of plants<br />
when they are harvested, they must be replaced to maintain the soil’s fertility. Questions about<br />
the rate at which biomass harvests deplete the soil are central to many debates on the<br />
sustainability of biomass power plants.<br />
Other environmental concerns are the effects of biomass harvest on soil erosion and wildlife<br />
habitat. The 2005 legislation mandated that the Minnesota Department of Natural Resources<br />
and Forest Resources Council generate “(g)uidelines or best management practices for<br />
sustainably managed woody biomass”. The guidelines will be based on recent scientific<br />
information and public comment. They must pay “particular attention to soil productivity,<br />
biological diversity … and wildlife habitat.” Research into the sequestration of carbon on forest<br />
and brush lands also was called for.<br />
Research must guide the development of future biomass power projects. This particular project<br />
applies specifically to woody biomass; issues surrounding other potential feedstocks for biomass<br />
power may be quite different. For that reason, research into sustainable practices regarding<br />
other biomass sources like corn stover or switchgrass will be needed to write guidelines for other<br />
kinds of biomass power projects.<br />
Since water is a necessary input to virtually all electrical generating technologies, sufficient<br />
water supplies are important requirements for biomass power projects. This poses a challenge in<br />
certain regions of Minnesota, where competition for water is beginning to intensify. In recent<br />
years a number of projects, including ethanol plants, have been stalled by constraints on water<br />
supplies (Gordon, 2005).<br />
Local and regional factors, like reservoirs and rivers, the needs of local municipal water systems,<br />
and potential effects of a new water user on its neighbors, determine whether water is available.<br />
There can be no statewide policy solution. True, the Minnesota Department of Natural<br />
Resources issues permits to use water from aquifers and streams, but it does so on the basis of<br />
local effects, and it has denied permits to ethanol projects in Southwestern Minnesota (Wilson,<br />
2007). Developers of biomass power plants must determine early on whether water is available<br />
for the project.<br />
Page 154<br />
Identifying Effective <strong>Biomass</strong> Strategies:<br />
Quantifying Minnesota’s Resources and Evaluating Future Opportunities
CHAPTER X : SEEKING OPPORTUNITIES<br />
We mentioned earlier that availability and price determines the choice of biomass fuel choice.<br />
Availability and price of fuel certainly matter greatly to utilities assessing biomass as a way to<br />
meet Minnesota’s new energy standards, as do capital costs, infrastructure costs, operating<br />
costs, timelines, and any other factors that contribute to the delivered cost of power. Those<br />
factors depend on strategic choices of technologies and plant configurations. Some utilities<br />
may decide to retrofit existing facilities for biomass fuel before considering expensive greenfield<br />
biomass plants. Our analyses using the Bio-Power Evaluation Tool (BioPET) suggest that the most<br />
economic opportunities for biomass power generation lie in co-firing biomass with coal in<br />
existing or expanded power plants.<br />
Combined heat and power (CHP) facilities also may convert to biomass fuel, especially if they<br />
now are purchasing natural gas at increasingly high prices. Indeed, a number of industrial<br />
facilities within Minnesota either have begun to use biomass fuels in their existing operations or<br />
are considering doing so. 5 Plants already generating steam and electricity with biomass may<br />
find it feasible to expand their capacities and sell biomass power to utilities who need it to meet<br />
the renewable energy standards.<br />
Other promising technologies include biodiesel power generators and anaerobic digesters<br />
running electrical generators. Direct combustion or gasification of biomass in stand-alone, or<br />
central station, plants is less attractive. BioPET analysis of stand-alone biomass power projects<br />
suggests that, since their energy would be expensive we probably won’t see many of those<br />
plants built in Minnesota.<br />
OPPORTUNITY 1: CO-FIRING COAL WITH BIOMASS<br />
According to the eGRID database published by the Environmental Protection Agency, ten<br />
baseload power plants in Minnesota burn coal to generate electricity. Depending on their<br />
design, and with some investment in boiler modifications and fuel handling equipment, many of<br />
them could co-fire biomass with coal. The literature on co-firing suggests that a 5% co-firing rate<br />
can be achieved without making major changes in the facility’s overall operations. Applying<br />
that percentage to Minnesota’s existing utility coal-fired plants would result in the amounts in the<br />
table below.<br />
The table below is probably a significant overestimate of Minnesota’s potential co-firing<br />
capacity for a number of reasons. Many of these facilities consist of multiple boilers. If a plant<br />
operator chose to initiate a co-firing operation at one of these facilities it may not make sense<br />
(or be possible) to co-fire in all of a facility’s boilers. In addition to this there may be technical,<br />
logistical (such as a lack of available space), and economic factors (not enough available<br />
biomass within an appropriate distance) that would prohibit these facilities from pursuing a cofiring<br />
operation. The table here is presented to provide the reader with a frame of reference for<br />
the theoretical potential of co-firing existing coal plants with biomass.<br />
5 These include Rahr Malting, the Central Minnesota Ethanol Cooperative (CMEC), the Chippewa Valley Ethanol<br />
Cooperative (CVEC), Corn Plus Ethanol and Rock Tenn.<br />
Identifying Effective <strong>Biomass</strong> Strategies: Page 155<br />
Quantifying Minnesota’s Resources and Evaluating Future Opportunities
Table X-1: <strong>Biomass</strong> Consumption at Existing Utility Coal Plants<br />
Under a 5% Co-Fire Assumption<br />
Plant Name County Plant Total<br />
Capacity<br />
(MW)<br />
Possible Annual<br />
<strong>Biomass</strong> Consumption<br />
(Tons)<br />
<strong>Biomass</strong><br />
Fueled<br />
Capacity<br />
(MW)<br />
Allen S King Washington 598 88,065 25<br />
Austin Northeast Mower 32 6,381 1<br />
Black Dog Dakota 700 51,978 26<br />
Clay Boswell Itasca 1,073 219,658 54<br />
High Bridge Ramsey 277 62,837 14<br />
Hoot Lake Otter Tail 138 28,981 7<br />
Riverside Hennepin 404 77,157 19<br />
Sherburne County Sherburne 2,129 551,458 106<br />
Silver Lake Olmsted 99 12,539 5<br />
Syl Laskin St Louis 116 29,153 6<br />
TOTAL 5,574 1,138,207 262<br />
OPPORTUNITY 2: BIOMASS COMBINED HEAT AND POWER<br />
Some current projects to reduce or eliminate purchases of natural gas suggest that avoiding<br />
fossil fuel costs will justify the costs of many future biomass projects. The Koda <strong>Energy</strong> project at<br />
the Rahr Malting facility, for example, will substitute biomass for a substantial portion of the<br />
natural gas the plant now uses for process heat. It also will generate 12 MW of excess power for<br />
sale. The gasifier at Central Minnesota Ethanol Cooperative (CMEC) will eliminate purchases of<br />
natural gas and generate 1 MW of green electricity to sell to <strong>Xcel</strong> <strong>Energy</strong>. Chippewa Valley<br />
Ethanol Cooperative (CVEC) also will avoid purchases of natural gas though gasification, but,<br />
unlike CMEC, it doesn’t plan to generate power.<br />
These projects go beyond the old model of waste-to-energy, which was to use residues<br />
generated on-site. Rather than using its own DDG residues, CMEC initially will fuel its gasifier with<br />
waste wood from manufacturers in the area. It has signed a 10 year supply contract with the<br />
fuel supplier, who has nearly two years’ supply on hand. If later it finds it can’t buy enough<br />
wood, CMEC will apply for permission to gasify its DDGs. CVEC, on the other hand, will use DDGs<br />
from the outset, but it will test its system’s ability to handle other fuels besides its own residues.<br />
Rahr Malting will use its own malting residues, but it has sized its system to handle several times<br />
more than that so it can buy other agricultural and processing residues from suppliers in the<br />
region.<br />
OPPORTUNITY 3: SUBSTITUTING BIOMASS FOR COAL<br />
A number of CHP facilities that burn coal, like the three American Crystal Sugar plants, St. Johns<br />
University, and the New Ulm Public Utilities plant, also may see advantages in switching to<br />
biomass. Because they are major biomass processors, the American Crystal Sugar plants look<br />
especially promising as biomass power producers. They can sell some of their byproducts at<br />
good prices, but others of lesser value could serve as fuels.<br />
Page 156<br />
Identifying Effective <strong>Biomass</strong> Strategies:<br />
Quantifying Minnesota’s Resources and Evaluating Future Opportunities
OPPORTUNITY 4: RETROFITTING EXISTING BIOMASS FACILITIES<br />
Minnesota’s pulp and paper mills already burn biomass to generate electricity and process heat<br />
for use on site. The REPIS database, which provides information on renewable energy facilities in<br />
the country, shows that most of the boilers in use at those facilities are more than 30 years old,<br />
and some are as old as 80 years.<br />
When the time comes to replace those old direct-fire boilers, new systems employing more<br />
advanced technologies could extract much more useful energy from the same amount of<br />
biomass fuel. A <strong>Biomass</strong> Integrated Gasification Combined Cycle (BMIGCC) system could<br />
double the facility’s electrical generation while continuing to meet thermal loads. In effect, the<br />
BMIGCC system would turn a kraft pulp mill into a utility-scale power plant.<br />
Minnesota Power, which already has formed partnerships with some of its pulp and paper<br />
customers to operate traditional boiler plants, could move farther in that direction by helping to<br />
build state-of-the-art biomass power facilities at the mills. Minnesota’s new renewable energy<br />
standards provide a new incentive to the state’s utilities to join in such investments.<br />
OPPORTUNITY 5: BIOMASS POWER AT ETHANOL FACILITIES<br />
We have mentioned the gasifier at Central Minnesota Ethanol that produces syngas to replace<br />
natural gas. Syngas also fuels a turbine thate generates electricity to use internally and sell to<br />
<strong>Xcel</strong> <strong>Energy</strong>. The gasifier’s biomass fuel is not processing waste but waste wood purchased from<br />
area manufacturers.<br />
Another interesting project, this one located outside Minnesota, is similar in using outside biomass<br />
for process energy. The E3 BioFuels ethanol plant in Mead, Nebraska is built nest to a 27,000-<br />
head feedlot. Manure from the feedlot is run into an anaerobic digester to produce biogas fuel<br />
for the ethanol plant’s boilers. As yet the plant doesn’t generate electricity, but the project<br />
shows how two seemingly unrelated segments within agriculture can become symbiotic (Gillam,<br />
2007).<br />
Two cellulosic ethanol projects that recently received federal funding do plan to generate<br />
electricity on site. Abengoa Bioenergy in in Chesterfield, MO, will sell excess power to a<br />
neighboring corn mill. ALICO, Inc. in LaBelle, FL, will use an innovative combination of<br />
gasification and fermentation to generate ethanol, hydrogen, ammonia, and 6.25 megawatts<br />
of power (DOE, 2007).<br />
Traditional dry-grind corn ethanol plants generate a byproduct called dried distillers grains<br />
(DDGs) that they currently sell for animal feed. A recent study (Morey, Tiffany, and Hatfield,<br />
2005) evaluated the potential of DDGs, as well as corn stover, to serve as fuel in scenarios<br />
beginning with satisfaction of thermal loads, proceeding through energy self-sufficiency, and<br />
ending with export of power to the grid. This last scenario had the facility consuming all the<br />
DDG’s produced on site (17.5 lbs per bushel of corn consumed) or 22.1 lbs of corn stover per<br />
bushel of corn consumed, resulting in net energy of 3.27 kWh per gallon of ethanol produced<br />
(4.36 kWh gross energy). If all dry-grind ethanol distilleries in Minnesota adopted the ultimate<br />
scenario they would generate gross power of 208 MW, of which 156 net MW would be surplus for<br />
sale to the grid.<br />
Identifying Effective <strong>Biomass</strong> Strategies: Page 157<br />
Quantifying Minnesota’s Resources and Evaluating Future Opportunities
Table X-2: Potential Generating Capability of Minnesota's Ethanol Plants<br />
Plant Name County Plant Total<br />
Capacity<br />
(Gallons)<br />
Gross<br />
Generating<br />
Capacity<br />
(MW)<br />
Net<br />
Generating<br />
Capacity<br />
(MW)<br />
Green Tons<br />
DDGS<br />
Consumed<br />
Green Tons Stover<br />
Consumed<br />
Northstar Blue Earth 48,000,000 20 15 420,000 530,400<br />
Al-Corn Dodge 34,000,000 14 11 297,500 375,700<br />
Corn Plus Faribault 45,000,000 19 14 393,750 497,250<br />
Pro-Corn Fillmore 40,000,000 17 13 350,000 442,000<br />
Exol/Agri<br />
Resources<br />
Freeborn 40,000,000 17 13 350,000 442,000<br />
Bushmills Kandiyohi 40,000,000 17 13 350,000 442,000<br />
Central<br />
Minnesota<br />
Ethanol<br />
Morrison 22,000,000 9 7 192,500 243,100<br />
MN <strong>Energy</strong> Renville 18,000,000 8 6 157,500 198,900<br />
Corn-er Stone Rock 21,000,000 9 7 183,750 232,050<br />
Heartland Sibley 37,000,000 16 12 323,750 408,850<br />
DENCO Stevens 24,000,000 10 8 210,000 265,200<br />
Chippewa Valley<br />
ethanol<br />
Swift 44,000,000 19 14 385,000 486,200<br />
Ethanol 2000 Watonwan 30,000,000 13 10 262,500 331,500<br />
Granite<br />
<strong>Energy</strong><br />
Falls<br />
Yellow<br />
Medicine<br />
48,000,000 20 15 420,000 530,400<br />
TOTAL 208 156 4,646,250 5,867,550<br />
The decision whether to build generation into a project whose primary motive is replacing<br />
natural gas may depend on electrical rates. Operations with high load factors and low<br />
electrical rates, like ethanol plants, may not be able to justify the cost of a turbine even if one<br />
were technically feasible (Nilles, 2006). Ethanol plants wanting to add electric generation may<br />
have to seek financial and technical help from utilities who can add the outputs to their<br />
renewable energy portfolios.<br />
OPPORTUNITY 6: BIODIESEL IN GENERATOR SETS<br />
In the case of ethanol, electricity is used to make biofuel; but in the case of biodiesel generators,<br />
biofuel is used to make electricity. Standby diesel generators, diesel genset peaking plants, dual<br />
fuel capable combustion turbines and fuel oil fired boilers all can run, in whole or in part, on<br />
biodiesel fuel. In some instances, biodiesel may work even better than petroleum-based diesel<br />
fuel.<br />
Using biodiesel in standby generators offers several benefits. Sometimes operators of standby<br />
generators take out permits allowing them to run only during outages because the application<br />
Page 158<br />
Identifying Effective <strong>Biomass</strong> Strategies:<br />
Quantifying Minnesota’s Resources and Evaluating Future Opportunities
for a full-time permit is more complicated. Gensets burning B100 (100%) biodiesel emit far fewer<br />
pollutants, like hydrocarbon, sulfur, carbon monoxide and particulates, than generators using<br />
petro-diesel (although NOx emissions may be higher). Thus standby generators burning biodiesel<br />
perhaps could operate more hours per year without exceeding permit restrictions. If that were<br />
the case, utilities and their large commercial and industrial customers could treat standby<br />
generators as dispatchable peaking generators.<br />
A recent report in The MMUA Resource reviewed a number of diesel generators operated as<br />
peaking plants by municipal electric cooperatives. Attracted by the high lubricity of biodiesel<br />
fuel as well as the chance to support local biodiesel industries, the co-ops have begun to add<br />
up to 20% biodiesel into their fuel mix. Last year, locally-owned municipal power plants<br />
generated 932 megawatt hours of electricity with biodiesel.<br />
Besides standby and peaking generators, baseload generators are being tested using biodiesel.<br />
McMinnville Electric, in Tennessee, has been running long term tests with B100 in a 2 MW<br />
generator. The somewhat lower BTU content of the B100, as well as its somewhat different<br />
chemical composition and emissions profile, have required minor adjustments to equipment.<br />
The New York Power Authority recently tested biodiesel in the boiler of the 885 MW Charles<br />
Poletti Power <strong>Project</strong> in Astoria, NY, in mixtures ranging from B5 to B20. The Authority reports that<br />
efficiency rose and emissions fell.<br />
Using the eGRID database, we estimate the fuel oil consumed by all Minnesota electric<br />
generating facilities in 2004 at approximately 63,970,000 gallons, close to the 63,150,000 gallons<br />
of our annual biodiesel production capacity. We don’t expect utilities to use 100% of our<br />
biodiesel production as a substitute for petro-diesel, but there is plenty to add to the fuel mix of<br />
standby and peaking generators, which burn approximately 2.2 million gallons per year. Even if<br />
they used pure, unmixed biodiesel, they would consume just 3.5% of the state’s biodiesel<br />
capacity.<br />
OPPORTUNITY 7: ANAEROBIC DIGESTERS<br />
The attractiveness of anaerobic digesters will depend in large part on the non-energy benefits<br />
provided by the digester and on the ability of farmers to monetize those benefits. Savings from<br />
reduced use of fertilizers and herbicides may be nearly as large as revenue from electricity sales.<br />
From a strictly cost of electricity perspective, anaerobic digesters typically result in electricity<br />
costs of around 12¢/kWh. However, if the cost avoidance (and resulting operational benefits)<br />
created by the digestion process are included, the resulting cost of electricity (and therefore the<br />
cost that the owner would need to recover in order to be financially whole) is more on the order<br />
of 4¢/kWh.<br />
Identifying Effective <strong>Biomass</strong> Strategies: Page 159<br />
Quantifying Minnesota’s Resources and Evaluating Future Opportunities
$0.140<br />
$0.120<br />
No Benefits<br />
$0.100<br />
$/kWh<br />
$0.080<br />
$0.060<br />
$0.040<br />
Benefits Included<br />
$0.020<br />
$0.000<br />
Figure X-1: Comparison of Anaerobic Digesters<br />
OPPORTUNITY 8: ELECTRIC-ONLY POWER PLANTS<br />
Electric-only power plants fueled by biodiesel are likely to be the least cost-effective type of<br />
biomass power plants. This is largely due to the fact that such facilities would be expensive<br />
baseload facilities burning expensive fuels. There are two options for electric-only biomass<br />
plants: direct combustion and gasification.<br />
Direct combustion electricity-only. Of all available options, direct combustion plants would<br />
generate the most expensive biomass power. Capital and fuel costs would be high, and<br />
combustion boilers inefficient. Size constraints imposed by costs of collecting and transporting<br />
biomass would prevent them from taking advantage of economies of scale important in<br />
baseload facilities.<br />
Gasification electricity-only. Gasification technologies are more promising than direct<br />
combustion technologies for generating electricity because they offer a wider range of<br />
applications. They can be used in conjunction with combined-cycle facilities, combustion<br />
turbines, gensets or simple syngas-fired boilers. If gasifiers become less costly, their compatibility<br />
with downstream technologies like these will make them the obvious choice for many biomass<br />
power plants in the years to come.<br />
OTHER CHP OPPORTUNITIES<br />
A number of studies have examined prospects for developing combined heat and power plants<br />
in general, and some have considered their development in Minnesota in particular. Typical<br />
candidates exhibit large, relatively constant thermal and electrical demands and a low power<br />
to heat ratio.<br />
One study (Minnesota Planning, 2001) which has proven prophetic, found that, at the time of its<br />
writing, the four most attractive prospects among Minnesota’s industrial and commercial<br />
facilities were Rahr Malting, Chippewa Valley Ethanol, the Duluth Steam Cooperative and St.<br />
Mary’s Duluth Clinic Health Systems. Rahr now is building a biomass-fired CHP system and<br />
Chippewa is developing a biomass gasification project.<br />
Page 160<br />
Identifying Effective <strong>Biomass</strong> Strategies:<br />
Quantifying Minnesota’s Resources and Evaluating Future Opportunities
While this study did not focus specifically on the use of biomass fuel, those two projects were in a<br />
good position to use it. The study also looked for promising candidates in categories like<br />
agricultural processing, food processing, pulp and paper and mining, but wasn’t able to<br />
adduce enough information for a conclusive evaluation.<br />
Some other categories which typically are located in urban areas, like commercial buildings,<br />
hospitals and district energy systems, are unlikely to adopt biomass CHP because of its noise,<br />
dust and problematic logistics.<br />
SUMMARY<br />
The table below summarizes opportunities to develop biomass power in Minnesota and<br />
compares their potential according to important criteria. Industrial CHP and co-firing in existing<br />
coal plants are the most attractive options in terms of economics and scale. Biodiesel and<br />
anaerobic digesters are economically viable in certain circumstances, but they will contribute<br />
little to Minnesota’s total electrical generation. <strong>Biomass</strong>-only power plants may have the<br />
greatest energy potential, but since they are the most expensive of the options, they will not be<br />
economically feasible unless costs of other fuels increase dramatically. They also compete<br />
directly against existing uses of biomass resources rather than complimenting them, as cogeneration<br />
does.<br />
Opportunity<br />
Table X-3: Bio-Power Opportunities in Minnesota<br />
Minimal<br />
Infrastructure<br />
Upgrades<br />
Fuel<br />
Costs<br />
Capital<br />
Costs<br />
Strengthens<br />
Existing<br />
Business<br />
Potential<br />
Magnitude<br />
Co-Firing Yes Medium Low Possibly High<br />
Industrial CHP<br />
Yes<br />
Low to<br />
High<br />
High Likely Medium to High<br />
Biodiesel Generators Yes High Low Possibly Low to Medium<br />
Anaerobic Digesters No Low High Likely Low<br />
Electric Only No High Very High No Medium to High<br />
Identifying Effective <strong>Biomass</strong> Strategies: Page 161<br />
Quantifying Minnesota’s Resources and Evaluating Future Opportunities
CHAPTER XI: BIOMASS POWER PROJECT<br />
DEVELOPMENT HANDBOOK<br />
INTRODUCTION<br />
A biopower project is a multifaceted endeavor which might take several years from start to<br />
finish. The process requires expertise in a wide range of subjects, from agricultural practices and<br />
power plant economics to the regulation and financing. Such a broad range of knowledge<br />
can be found only in specialists in these areas. Whether those specialists are partners in the<br />
project or independent consultants, their work in developing a bio-power project will require<br />
substantial investments of time and money.<br />
This <strong>Project</strong> Development Handbook provides a starting point for parties interested in developing<br />
a biomass power facility. Its first section is a list of the Conditions Precedent typically required<br />
prior to the financing of a project. These may vary for different projects, but the list gives an<br />
indication of the many issues that must be dealt with to complete a project successfully. The<br />
second section provides greater detail on some of the Conditions Precedent listed in the first<br />
section. This is far from a complete “how to” guide for biomass power projects, but it does focus<br />
on information on topics specific to biomass power.<br />
CONDITIONS PRECEDENT<br />
Certain Conditions Precedent will need to be met in order to obtain financing for a biopower<br />
facility. These Conditions Precedent represent the current understanding of key requirements<br />
typically imposed by bond insurers, rating agencies, letter of credit banks, and investors. They<br />
may change, or new conditions may be added, as the project develops. Typical Conditions<br />
Precedent are as follows.<br />
Power Purchase Agreement: a Power Purchase Agreement with a credit- worthy, ratable utility.<br />
The Power Purchase Agreement will be reviewed to verify that <strong>Project</strong> Economies properly<br />
represent the contact and conditions through the full term of the financing. The agreement<br />
should show annual rate escalators based on inflation.<br />
Steam Off-Take Agreement: an agreement with a credit-worthy or ratable steam purchaser for<br />
the full term of the financing, or, in the absence of a full term agreement, a cancellation penalty<br />
that provides the energy island owner a revenue base sufficient to re-position the facility, find<br />
alternative users or alternative sources of revenue from electrical generation. The steam off-take<br />
agreement rate should based on indexes and adjustable to changing fuel costs and<br />
uncontrollable circumstances such as changes in state or federal regulations.<br />
<strong>Biomass</strong> Fuel Supply Contract: assurance of biomass fuel supply along with an indexed cost<br />
structure with a ratable or credit-worthy fuel consolidator or generator. The contract with the<br />
fuel supplier will need to be structured to avoid its characterization as speculative. The<br />
agreement should be for the full term of the financing.<br />
Ash Disposal: an ash disposal plan and facility to address Minnesota Pollution Control Agency<br />
requirements.<br />
Page 162<br />
Identifying Effective <strong>Biomass</strong> Strategies:<br />
Quantifying Minnesota’s Resources and Evaluating Future Opportunities
Waste Landfill: a contract with a landfill stating and securing the term and charges for disposing<br />
of non-processable biomass from the power facility.<br />
Permits: all permits relating to air quality, water, wastewater, storm water, fuel storage, land use,<br />
fuel processing, construction and operation. Certain permits will be contingent on final tests<br />
during facility start-up prior to a Certificate of Commercial Operation.<br />
Construction Agreement: a fixed-price contract with a reputable, credit-worthy prime<br />
contractor experienced in managing complex energy projects who can assure completion and<br />
specified performance. A letter from the general contractor’s surety company indicating their<br />
willingness to underwrite the surety guarantees for the project will be required.<br />
Technology Agreement: an agreement with a ratable or credit-worthy vendor to supply a<br />
market-tested process technology with full guarantees. The agreement must provide for full<br />
design “Chute-to-Stack” Drawings, specifications and stand-by availability of replacement parts<br />
and components, and such other support needed to keep the facility operatiing at a minimum<br />
level of 85% of capacity.<br />
Operating Agreement: an operating plan that includes the staff experience, the training<br />
regime, and the capital improvement and maintenance budget that assure proper operation of<br />
the new facility. If the operator is to be an entity other than the owner, then the operator should<br />
not only be credit-worthy or ratable but also demonstrate experience in managing multi-fuel<br />
energy facilities.<br />
Supply Agreements: bids from suppliers of key components based on their respective designs<br />
for the project. These will be needed before prime contractors can make firm bids to the Owner<br />
of the overall project. Included, but not limited, in that list of components are the following:<br />
• Turbine Generator<br />
• Air Pollution Control Equipment<br />
• Boiler<br />
• Combustion Equipment<br />
• Cranes<br />
• Fuel Processing and delivery Equipment<br />
• Ash Removal Equipment<br />
• System Controls<br />
Any warranties and guarantees for the supply of these components will need to be reviewed by<br />
owner’s counsel and bond counsel.<br />
Risk Management Assessment: a thorough risk assessment of the of the new facility’s supply,<br />
construction, start-up and operating periods undertaken by the owner and its engineers, risk<br />
managers and prime contractor. A plan for managing the varying degrees of risk should be<br />
developed and reasonable methods of mitigating project risk through insurance or bonding<br />
should be considered.<br />
Labor Agreement: some form of agreement with labor and trade unions that the biomass<br />
energy project will be exempt from any work shut-downs or strikes. An accelerated project<br />
timetable and/or time-limited project financing may require such an agreement.<br />
Finance Plan: a plan of finance, drawn up by the owner and its attorneys, financial advisors,<br />
bond underwriters and feasibility consultants, that includes provisions for revenue flexibility,<br />
supplemental funding and operating and debt reserves. The plan and the structure of any<br />
Identifying Effective <strong>Biomass</strong> Strategies: Page 163<br />
Quantifying Minnesota’s Resources and Evaluating Future Opportunities
financial obligations must give priority to funding the project’s construction, operation,<br />
maintenance and rate stabilization reserve before any net revenues can be transferred to the<br />
owners.<br />
Consulting Engineer: a third-party engineer engaged by the owner at its own expense to<br />
provide a technology review to bond insurers or extenders of letters of credit.<br />
Site Control: a purchase agreement, along with complete environmental review and contracts<br />
for utility access, on the energy island facility site. This must be provided prior to closing on<br />
project financing.<br />
OTHER CONSIDERATIONS<br />
Ownership and Financial Structure<br />
A power plant may be owned publicly, privately, or both publicly and privately. The project<br />
may be partially financed with tax-exempt debt depending on the fuel type employed and the<br />
opinion of counsel. Financing for a publicly owned facility may be secured, partially or<br />
completely, by the full faith and credit pledge of the city. An alternative to ownership by the<br />
city alone might be joint ownership with regional counties. A public/private partnership could<br />
include equity contributions by public entities, the private project developer/operator, and the<br />
steam purchaser. Depending on the terms of the contracts and the credit commitments of the<br />
parties to a public/private partnership, debt-to-equity ratios may range from 80/20% to 60/40%.<br />
A principal concern will be the stranded/unamortized debt beyond the negotiated term of the<br />
steam purchaser’s contract.<br />
Feedstock and Site Selection<br />
The interwoven choices of feedstocks and plant location are critical in deciding the success or<br />
failure of a biopower project. In some instances, one or both of those decisions will be obvious.<br />
This would be the case for projects generating power for use on site with a fuel generated on<br />
site, or projects designed to satisfy a thermal load at an existing consumer. Where the choice of<br />
feedstock and location are not so obvious the process of selecting each will require evaluation<br />
of a number of factors.<br />
Sufficient Feedstock Supplies<br />
The success of any bio-power facility depends on the long-term supply of feedstock. This means<br />
much more than just determining that sufficient biomass currently is available within a costeffective<br />
distance of the plant. Investors and lenders will want to see a long- term fuel supply<br />
plan ensuring that it will be available in the future. Better yet would be a long term fuel supply<br />
contract with an established supplier. Unfortunately, this may be difficult to achieve because<br />
the biomass fuel market is immature and localized. Long-term fuel supply may entail the<br />
development of a subsidiary fuel supplier or a co-op dedicated to delivering sufficient biomass<br />
to the plant.<br />
Access to Existing Utility Infrastructure<br />
Finding a site with existing access to necessary utilities helps to avoid significant capital costs.<br />
Depending on power plant design, a bio-power facility may need access to natural gas<br />
Page 164<br />
Identifying Effective <strong>Biomass</strong> Strategies:<br />
Quantifying Minnesota’s Resources and Evaluating Future Opportunities
pipelines, city water and sewer connections, electrical distribution and/or transmission<br />
infrastructure. The cost of extending utility infrastructure to connect with a new facility can be<br />
considerable. Minimizing these costs is a major consideration in developing a cost-effective<br />
biopower project.<br />
Access to Adequate Transportation Infrastructure<br />
If a biopower project is to rely on biomass fuels generated offsite, it will have to find a location<br />
with transportation infrastructure capable of supporting the additional use that will result. If a<br />
facility is to utilize rail infrastructure, access to a rail siding will be necessary. If a facility is to rely<br />
on road transport for delivery of fuels, developers must ensure that the road infrastructure<br />
between the bio-power facility and its fuel supplies is rated for the additional heavy truck traffic<br />
and that if seasonal weight restrictions apply they can be accommodated. Other related<br />
considerations include facility design that will minimize the turnaround time for delivery trucks or<br />
trains. This will help minimize delivered fuel costs by reducing the downtime of fuel suppliers’<br />
equipment.<br />
Sufficient Water Supplies<br />
Nearly all biopower facilities require some amount of water for plant operations. Water can<br />
come from deep or shallow aquifers, surface waters or municipal water supplies. The costs and<br />
benefits for each of these sources can vary considerably. Municipal water supplies are likely to<br />
be the most expensive and their quantity may be limited. Any facility that will withdraw 10,000 or<br />
more gallons of water per day will require a water appropriations permit. To securing the permit<br />
the project will have to show that the withdrawal will not have an adverse effect on neighbors or<br />
the environment. Ground water supplies are quite limited in portions of the state, so steps should<br />
be made to ensure access to adequate supplies early in the planning process. In recent years a<br />
number of industrial facilities have been denied water permits due to limited availability.<br />
Supportive Local Community<br />
The support of the local community is a crucial element for any large biopower facility. Local<br />
support can be achieved through public input during the planning stages and/or providing<br />
local residents with a stake in a facility’s success.<br />
FACILITY DESIGN<br />
<strong>Project</strong> developers face a number of crucial design decisions early in the planning process.<br />
Among the most important is the decision whether the facility will supply power to the grid or<br />
merely offset power purchased from the grid. That choice, along with the project’s potential to<br />
serve a thermal load as a CHP plant, will determine the fundamental economic parameters of<br />
the project. Another design option is a conversion technology that allows the use of multiple<br />
fuels.<br />
FINANCING<br />
Funding expensive projects like power plants usually involves more than one financing vehicle.<br />
Some equity – what lenders call “feet-to-the-fire” money – almost always is the first requirement.<br />
Some of that may come from the New Markets Tax Credits program (see Chapter VII, above) or<br />
Identifying Effective <strong>Biomass</strong> Strategies: Page 165<br />
Quantifying Minnesota’s Resources and Evaluating Future Opportunities
from local, regional or state venture funds. (Professional venture capital firms are not interested<br />
in project financing.)<br />
First-position commercial lenders often limit their loans to 50% of the assets financed. If equity<br />
investment doesn’t provide the balance of project cost, the developer may resort to a number<br />
of government “gap” financing programs that take a subordinate position to the commercial<br />
loan Chapter VII). In larger projects, a bundle of those gap loans from various agencies may be<br />
needed to rise to the necessary level. From a collateral standpoint, commercial lenders regard<br />
subordinated debt as virtual equity because in a default the first position lender has a lien on all<br />
of the assets financed. But from a cash-flow standpoint the first-position lender will be<br />
concerned if it sees payments on subordinated debt biting too deeply into cash.<br />
Government first-position loan programs are tax-exempt, but they don’t work for power projects.<br />
Industrial Development Bonds (IDBs) are capped by federal law at 80% of a maximum total<br />
project cost of $20 million, too low for most power projects. And in any case they are restricted<br />
to manufacturers. In rare cases, municipalities have issued general obligation bonds for facilities<br />
that can provide some public benefit – a recycled paper mill once was financed as a municipal<br />
waste treatment plant – but that can be contentious.<br />
A developer contemplating a bio-power project is well advised to discuss financing options early<br />
with a reputable investment bank. As the development moves forward, project financing will<br />
condition many of its decisions<br />
<strong>Biomass</strong> <strong>Project</strong> Finance Steps<br />
The typical financing of a bio-power project occurs in four phases that covering a period of ten<br />
to twelve weeks: Planning, Documentation, Issuance and a Post Sale phase.<br />
Planning Phase. The Planning Phase entails a number of meetings for finance team members.<br />
They will prepare a detailed analysis of options for the structure of the financing. At the end of<br />
the Planning Phase a plan will be decided upon, and a preliminary schedule of events will be<br />
drafted.<br />
Documentation Phase. During the Documentation Phase, staff and legal counsel will develop<br />
resolutions, indentures, loan agreements and any required notices. All necessary economic<br />
data will be assembled for inclusion in the offering documents. Presentation packages will be<br />
developed for rating agencies and bond insurers. <strong>Final</strong>ly, legal counsel will draft the preliminary<br />
offering documents, as well as any supplementary amendments to the loan agreement or<br />
indenture.<br />
Issuance Phase. During the Issuance Phase, the materials prepared for rating agencies and<br />
bond insurers will be distributed. Potential investors will receive a prospectus and indicate their<br />
level of interest during a survey. A pricing plan will be developed and the interest rate<br />
environment will be assessed. The loan or bond syndicate will need to be organized and<br />
managed, and the distribution of bonds planned. Briefing materials need to be prepared to<br />
educate interested investors in the key features of the loan or bonds. The final step during the<br />
issuance phase is the actual purchase of the loan or bonds by investors.<br />
Post-sale Phase. The Post-sale Phase involves the transfer of all funds and the management of<br />
the bond or loan proceeds. All final documents must be prepared, and an official statement<br />
released summarizing the results of the issuance. <strong>Final</strong>ly a post-sale analysis will be prepared for<br />
the finance team.<br />
Page 166<br />
Identifying Effective <strong>Biomass</strong> Strategies:<br />
Quantifying Minnesota’s Resources and Evaluating Future Opportunities
ENVIRONMENTAL PERMITS<br />
A bio-power project will need a number of environmental permits from the state. The permits<br />
required for a given facility will vary depending on its size, the fuels it will use, and its emissions<br />
and effluents. Since projects vary so much in their particulars, we won’t try here to summarize all<br />
the specific permits that might be called for.<br />
ENVIRONMENTAL ASSESSMENTS<br />
There are three general types of environmental assessments that the Minnesota Environmental<br />
Quality Board may require of specific bio-power projects: an Environmental Assessment<br />
Worksheet (EAW) and/or an Environmental Impact Statement (EIS). These assessments are<br />
preliminary to any other governmental approvals. The EQB offers a third alternative to<br />
communities rather than to specific projects: the Alternative Urban Area-wide Review (AUAR).<br />
Environmental Assessment Worksheet<br />
Environmental Assessment Worksheets (EAW) are prepared by the Responsible Governing Unit<br />
(RGU) for a proposed facility. Following the completion of the EAW the RGU must distribute the<br />
EAW to the Environmental Quality Board and all offices on the EQB’s official distribution list.<br />
Notice of the EAW will be published in the EQB Monitor, which begins the 30-day public<br />
comment period. Following the public comment period the RGU will respond to comments,<br />
issue findings of fact, and decide if an Environmental Impact Statement is necessary. If no EIS is<br />
necessary the project is eligible to receive state permits.<br />
Environmental Impact Statement<br />
An environmental impact statement is a much more in-depth review of the environmental<br />
effects of a proposed facility. An EIS may be required by the RGU based on the Findings of Fact<br />
of the EAW. The EIS analyzes environmental, social, and economic impacts of a proposed<br />
project. The first step of an EIS is scoping or deciding what impacts and alternatives will be<br />
covered by the EIS and to what extent. It is prepared by the RGU and submitted for public<br />
review and comment for at least 25 working days (EQB, 1998). The RGU then completes the final<br />
document based on the comments received, and makes a decision as to the sufficiency of the<br />
EIS. If the EIS is deemed sufficient the facility becomes eligible for state permits.<br />
The rules governing the need for an EAW, or EIS, and the assignment of the RGU are complex.<br />
The environmental Quality Board, the Minnesota Pollution Control Agency and the Minnesota<br />
Public Utilities commission all have information available on their websites to help project<br />
developers navigate the process.<br />
Alternative Urban Area-Wide Review<br />
In the AUAR process, the RGU, in advance of any specific development project, prepares a<br />
review of an entire area within its jurisdiction rather than one isolated site. That is sent to the EQB<br />
and. Any subsequent project within the AUAR boundaries that conforms to the AUAR’s<br />
characterizations is approved without having to go through other reviews.<br />
Identifying Effective <strong>Biomass</strong> Strategies: Page 167<br />
Quantifying Minnesota’s Resources and Evaluating Future Opportunities
The EQB staff recommend the AUAR over an EIS because it offers advantages to community<br />
and developer alike: a holistic rather than piecemeal approach, fewer public hearings, a<br />
shorter timeline, lower overall costs, and pre-approved sites for development.<br />
Size Criteria for Environmental Reviews<br />
The following information provides a general overview of the considerations for different sized<br />
plants. It should not be seen as a definitive explanation of the environmental permitting process.<br />
AIR PERMITS<br />
The Minnesota Pollution Control Agency is responsible for granting air quality permits. To receive<br />
an air quality permit a facility must meet a number of state and federal requirements to minimize<br />
the impact of a facility on the local environment. Generally, any facility that has the potential to<br />
emit (PTE), a regulated pollutant at quantities greater than specified amounts, must obtain an air<br />
quality permit. Regulated pollutants include hazardous air pollutants (HAPs) and criteria<br />
pollutants. HAPs are chemicals that are known, or suspected to, cause cancer or other serious<br />
illnesses. Criteria pollutants are known to have impacts on human health and welfare.<br />
Generally, permits may be necessary to satisfy federal, and/or state regulations. Minnesota has<br />
somewhat lower PTE thresholds for some pollutants than the federal government, so in some<br />
instances a facility may not require a federal permit but still require a state permit. Any federal<br />
air quality permit for a power plant will be an individual total facility permit. Minnesota offers a<br />
number of simplified air quality permits for facilities whose PTE is sufficient to trigger permitting<br />
requirements but which are unlikely to exceed emissions thresholds in practice, or commit to<br />
maintaining their emissions below threshold levels.<br />
Further information regarding air quality permits can be found at the MPCA website<br />
(http://www.pca.state.mn.us/air/permits/forms.html).<br />
Air Emissions Risk Analysis (AERA)<br />
An AERA may be a component of an EAW, EIS or a prerequisite for an air quality permit. An<br />
AERA is a standardized process used to assess the health impacts of a facility’s air emissions. It<br />
looks at emissions rates, toxicity and dispersion modeling to generate a risk assessment. It also<br />
includes an analysis of proximity to residences, as well as proposed operating procedures and<br />
risk-minimizing procedures. This information is used to estimate a facility’s impact on human<br />
health.<br />
The MPCA will request the submittal of an AERA for any electrical generating facility greater than<br />
25 MW. Smaller facilities may still require an AERA if the expected emissions of any criteria<br />
pollutant are greater than 100 tons per year after the use of control equipment. Further<br />
information regarding AERAs is available at http://www.pca.state.mn.us/air/aera.html.<br />
WATER PERMITS<br />
The Minnesota Department of Natural Resources is the agency primarily responsible for granting<br />
water appropriation permits. The primary consideration in the water appropriations permitting<br />
process are the sufficiency of water supply and natural resource impacts of the permitted water<br />
use. Minnesota requires a water appropriation permit if a facility will utilize more than 10,000<br />
gallons per day or one million gallons per year of surface or ground water.<br />
Ground Water<br />
If a facility’s source will be ground water, an aquifer test is necessary to confirm the sufficiency of<br />
supply to the site. This entails withdrawing water from the aquifer at the proposed rate for the<br />
facility for seven days. During this time nearby private wells must be monitored for any impacts.<br />
Identifying Effective <strong>Biomass</strong> Strategies: Page 169<br />
Quantifying Minnesota’s Resources and Evaluating Future Opportunities
Surface Water<br />
If a facility is to rely on surface waters some of the primary considerations relate to the<br />
maintenance of habitat quality and the ability to continue to use a water body for existing and<br />
higher priority uses.<br />
More information regarding water appropriations permit requirements can be found at<br />
http://www.dnr.state.mn.us/waters/watermgmt_section/appropriations/permits.html.<br />
Water Discharge Permit<br />
The Minnesota Pollution Control Agency is responsible for the issuance of water discharge<br />
permits. A power plant may require a National Pollutant Discharge Elimination System (NPDES)<br />
and/or a State Disposal System (SDS) permit. If required, these permits must be issued prior to the<br />
start of construction. Further information can be found on the MPCA website at<br />
http://www.pca.state.mn.us/water/permits/index.html.<br />
Public Waters Work Permit<br />
A bio-power project that will impact a body of water may require a public waters work permit.<br />
The Minnesota Department of Natural Resources is the agency responsible for these permits.<br />
Information regarding the requirements for these is available at<br />
http://www.dnr.state.mn.us/waters/watermgmt_section/pwpermits/requirements.html.<br />
UTILITY INTERCONNECTION AND RATE AGREEMENTS<br />
The terms of utility interconnection and rate agreements will vary depending on project size.<br />
Minnesota has enacted a number of measures to facilitate the interconnection of small<br />
distributed generating facilities. Facilities with generating capacity of 10 MW or less are eligible<br />
for standardized interconnection and rate agreements. Larger facilities must negotiate a PPA<br />
with a purchasing utility, or choose to sell power to the wholesale market.<br />
Utility Interconnection<br />
With direction from the legislature, the Minnesota Public Utilities Commission has established<br />
standards relating to the interconnection process and requirements for electric generators of 10<br />
MW or less. The order establishing these standards is available here<br />
https://www.edockets.state.mn.us/EFiling/ShowFile.doDocNumber=1904618.<br />
In addition, local utilities may have information regarding the interconnection process on their<br />
websites.<br />
Facilities larger than 10 MW are not governed by the standardized requirements. Those<br />
interested in a plant larger than 10 MW should contact their local utility to enquire about the<br />
interconnection process.<br />
Page 170<br />
Identifying Effective <strong>Biomass</strong> Strategies:<br />
Quantifying Minnesota’s Resources and Evaluating Future Opportunities
Rate Agreements<br />
Facilities of 10 MW<br />
Facilities with generating capacity greater than 10 MW will most likely need to sign a Power<br />
Purchase Agreement (PPA) with one of the state’s utilities. Such an agreement does not<br />
necessarily have to be with the local utility. In certain circumstances, state law requires the local<br />
utility to provide wheeling or exchange agreements to other utilities within the state. If the<br />
power purchase agreement is made with a regulated utility, the Public Utilities Commission (PUC)<br />
will need to approve the PPA.<br />
Often a PPA is necessary to secure financing for a facility. It is possible for project developers to<br />
circumvent a PPA by constructing a facility to provide power to the wholesale market, but this is<br />
a much riskier strategy, and may not be possible if the project will involve substantial debt<br />
financing.<br />
Allocation of Environmental Attributes<br />
A biomass power facility may be able to market a number of environmental attributes such as<br />
Renewable <strong>Energy</strong> Credits (RECs) or possibly carbon emission reduction credits. The ability to<br />
market these credits may enable a biopower project to command a premium for its electrical<br />
generation.<br />
Minnesota’s utilities are required to increase their use of renewable energy to 25% by 2025. To<br />
facilitate this renewable energy standard, the legislation allows utilities to use Renewable <strong>Energy</strong><br />
Credits to count toward renewable energy generation portfolio requirements just as though they<br />
were purchasing renewable power and retailing it.<br />
<strong>Project</strong> developers should consider their ability to generate renewable energy credits, and be<br />
sure that any PPA is clear as the allocation of the facility’s RECs. A bio-power facility does not<br />
necessarily have to sell its RECs to the same party purchasing its power. It may sell them to a<br />
different utility or to a broker that resells RECs. There is a growing voluntary market for RECs. In<br />
this market, environmental organizations purchase renewable energy credits and sell them to<br />
Identifying Effective <strong>Biomass</strong> Strategies: Page 171<br />
Quantifying Minnesota’s Resources and Evaluating Future Opportunities
individuals who wish to support the development of renewable energy or reduce their<br />
greenhouse gas emissions.<br />
The Midwest Renewable <strong>Energy</strong> Tracking System (M-RETS) was recently established to facilitate<br />
the tracking of RECs. It provides a standardized system for generating, tracking and retiring RECs<br />
within a number of Midwestern states. While this system will greatly facilitate trade in RECs, M-<br />
RETS is not itself a market. To date there is no established, liquid, market where REC generators<br />
can easily sell their product. Without such a market a bio-power facility probably will find it<br />
advantageous to enter into a long term contract for its RECs. More information about the M-<br />
RETS system is available here http://mrets.net/index.asp.<br />
A biomass power facility may also be able to sell carbon emission reduction credits, or other<br />
environmental rewards. These markets differ somewhat from RECs and involve a different set of<br />
standards for certification. In most instances it will not be possible to sell both a REC and a<br />
carbon emissions reduction credit for the same quantity of energy; but the ability to sell credits<br />
into both markets may enable a facility to pursue the best price for its environmental rewards.<br />
Page 172<br />
Identifying Effective <strong>Biomass</strong> Strategies:<br />
Quantifying Minnesota’s Resources and Evaluating Future Opportunities
BIBLIOGRAPHY AND RESOURCES<br />
The following list of references includes both citations from the written report as well as other<br />
sources that, although not cited, provided enough valuable information and background that<br />
we felt they warranted mention.<br />
Alliant <strong>Energy</strong>, Antares Group Incorporate, Bradford Conrad Crow, Tech-Wise A/S, and T.R. Miles<br />
Technical Consultants. (2002, July 12). Chariton Valley <strong>Biomass</strong> <strong>Project</strong>: Design Package.<br />
Retrieved August 5, 2007 from<br />
http://www.iowaswitchgrass.com/__docs/pdf/Design%20Package%20Part%201.pdf<br />
Anfinson, R. (2005, December 14). CVEC Enters <strong>Biomass</strong> Gasification Venture. Swift County<br />
Monitor<br />
Antares Group Incorporated. (2002, September 20). Chariton Valley <strong>Biomass</strong> <strong>Project</strong>: Draft Fuel<br />
Supply Plan. Retrieved August 5, 2007 from<br />
http://www.iowaswitchgrass.com/__docs/pdf/Draft%20Fuel%20Supply.pdf<br />
Agreement Could be Key to Proposed <strong>Energy</strong> Plant. (2000, April 2). Associated Press.<br />
Atchison, J. E., and J. R. Hettenhaus. (2003). Innovative Methods for Corn Stover Collecting,<br />
Handling, Storing and Transporting. National Renewable <strong>Energy</strong> Laboratory.<br />
Agricultural Utilization Research Institute [AURI]. (n.d.). AURI Fuels Initiative: Agricultural<br />
Renewable Solid Fuels Data. Retrieved August 5, 2007 from<br />
http://www.auri.org/research/fuels/pdfs/fuels.pdf<br />
Badger, P.C. (2002). Processing Cost Analysis for <strong>Biomass</strong> Feedstocks. (ORNL/TM-2002/199) Oak<br />
Ridge National Laboratory. Retrieved August 5, 2007 from<br />
http://bioenergy.ornl.gov/pdfs/ornltm-2002199.pdf<br />
Bain, R.L., Amos, W. A., and Downing, M. (2003). Bio-power Technical Assessment: State of the<br />
Industry and Technology. National Renewable <strong>Energy</strong> Laboratory. (NREL/TP-510-33123).<br />
Retrieved August 5, 2007 from<br />
http://www.nrel.gov/docs/fy03osti/33123.pdf<br />
Bain, R. L.; Overend, R. P.; and Craig, K. R. (1996). <strong>Biomass</strong>-Fired Power Generation. <strong>Biomass</strong><br />
Usage for Utility and Industrial Power: Proceedings of the Engineering Foundation Conference, 28<br />
April - 3 May 1996, Snowbird, Utah. 16 pp.; NREL <strong>Report</strong> No. 21096.<br />
Barrett, L. B. (2004, October/November). Biodiesel on Backup. Biodiesel Magazine.<br />
Bartok, J.W., Jr. (2005). Fact Sheets: Greenhouse Management. University of Connecticut.<br />
Retrieved August 5, 2007 from<br />
http://www.umass.edu/umext/floriculture/fact_sheets/greenhouse_management/jb_fuels.htm<br />
Baxter, L., and Koppejan, J. (2004). <strong>Biomass</strong>-Coal Co-Combustion: Opportunity for Affordable<br />
Renewable <strong>Energy</strong>, EuroHeat & Power.<br />
Identifying Effective <strong>Biomass</strong> Strategies: Page 173<br />
Quantifying Minnesota’s Resources and Evaluating Future Opportunities
Bickel, K. L., Waytulonis, R. W., Zarling, D.R., 2004. Improving Air Quality by Using Biodiesel in<br />
Generators, University of Minnesota. Retrieved August 6, 2007 from<br />
http://www.state.mn.us/mn/externalDocs/Commerce/Improving_Air_Quality_by_using_Biodiesel<br />
_in_Generators_102504114108_b20generatorfinal.pdf<br />
Biodiesel Content Mandate, 239.77, Minnesota Statutes 2006 (2006) (Office of the Revisor of<br />
Statutes, State of Minnesota)<br />
<strong>Biomass</strong> Generation Begins. (2006, December 22). The Mesabi Daily News<br />
Bloomquist, L. (2006, October 29). <strong>Biomass</strong> Boilers Energize Timber Industry. Duluth News-Tribune.<br />
Bureau of Labor Statistics [BLS]. (2006). Retrieved in 2006 from http://www.bls.gov/<br />
<strong>Biomass</strong> Research and Development Technical Advisory Committee [BRDTAC]. (2002).<br />
Roadmap for <strong>Biomass</strong> Technologies in the United States.<br />
Brummer, E. C., Burras, C. L., Duffy, M. D., and Moore, K. J. (2002). Switchgrass Production in<br />
Iowa: Economic Analysis, Soil Suitability, and Varietal Performance. Iowa State University.<br />
Retrieved August 6, 2007 from<br />
http://www.public.iastate.edu/~brummer/pubs/2001<strong>Biomass</strong><strong>Report</strong>.pdf<br />
Brushland: Acres by County (2000) Minnesota Land Use and Cover Statistics. Minnesota Land<br />
Management Information Center. Retrieved on August 7, 2007 from<br />
http://www.lmic.state.mn.us/datanetweb/landuse.htmll<br />
Bryan, B., Rabovitser, J., Ghose, S., and Patel, J. 2003. Results of the Technical and Economic<br />
<strong>Feasibility</strong> Analysis for a Novel <strong>Biomass</strong> Gasification-based Power Generation System for the<br />
Forest Products Industry. Gas Technology Institute.<br />
BTG. (n.d.). <strong>Energy</strong> from Poultry Litter [Brochure]. Retrieved August 6, 2007 from<br />
http://www.btgworld.com/2005/pdf/technologies/leaflet-chicken-litter.pdf<br />
Burns and McDonnell. (2005). Analysis of Baseload Generation Alternatives: Big Stone Unit II.<br />
Retrieved August 5, 2007 from<br />
http://www.state.sd.us/puc/commission/dockets/electric/2005/el05-022/ApplicantsEX23A.pdf<br />
California <strong>Biomass</strong> Collaborative. (n.d.). Background for <strong>Energy</strong> Cost Calculator. Retrieved<br />
September 7, 2007 from<br />
http://faculty.engineering.ucdavis.edu/jenkins/CBC/Calculator/CalculatorBackground.pdf<br />
Carey, J., Carter, A., Shameen, A. (2007). “Food Vs. Fuel”, Business Week.<br />
Carlson, R. W., (2006). Prospects for Expansion of the Soy-based Biodiesel Industry in Minnesota.<br />
Agricultural Utilization Research Institute.<br />
Clean <strong>Energy</strong> Resource Teams [CERTs]. (2005). Renewable <strong>Biomass</strong> Combined Heat and Power<br />
<strong>Energy</strong> Production from the Hibbing and Virginia Public Utilities.<br />
Chiaramonti, D., Oasmaa, A., and Solanausta, Y. (2007). Power Generation Using Fast Pyrolysis<br />
Liquids from <strong>Biomass</strong>. Renewable and Sustainable <strong>Energy</strong> Reviews 11 (6). 1056 to 1086.<br />
Page 174<br />
Identifying Effective <strong>Biomass</strong> Strategies:<br />
Quantifying Minnesota’s Resources and Evaluating Future Opportunities
Cinergy Business Solutions - Combined Heat and Power Plant Begins Operations. (2003, May 7).<br />
Business Wire.<br />
City of Albertville. (2007, April 2). City Council Meeting Minutes.<br />
City of St. Louis Park. (2007, April 9). Agenda Summary: City Council Meeting.<br />
Craig, K.R. and Mann, M. (1996). Cost and Performance Analysis of <strong>Biomass</strong>-Based Integrated<br />
Gasification Combined-Cycle (BIGCC) Power Systems. (NREL/TP-430-21657) National<br />
Renewable <strong>Energy</strong> Laboratory. Retrieved August 6, 2007 from<br />
http://www.nrel.gov/docs/legosti/fy97/21657.pdf<br />
Crosby, J. (2007, May 1, 2007). From Turkey Droppings to Kilowatts. Star Tribune.<br />
Chippewa Valley Ethanol Company [CVEC]. (2006). Letter from Management. Retrieved<br />
August 5, 2007 from http://www.cvec.com/SiteImages/FileGallery/2006_Annual_<strong>Report</strong>_8.pdf<br />
CVBP Interim Test Burn Emissions <strong>Report</strong>, Appendix G. (2003). Retrieved on August 7, 2007 from<br />
http://biomass.ecria.com/__docs/pdf/Biosilo%20&%20Sampling%20Photos.pdf<br />
Dale, S. (2007, May 15). Of Poop Power and Gas Emissions. Time.<br />
Dangtran, K., Mullen, J., and Mayrose, D. (2000). A Comparison of Fluid Bed and Multiple Hearth<br />
Biosolids Incineration. Presented at 14 th Annual Residuals & Sludge Management Conference,<br />
Boston.<br />
Dayton, D.C. (2001). Fuel Cell Integration – A Study of the Impacts of Gas Quality and Impurities.<br />
(NREL/MP-510-30298) National Renewable <strong>Energy</strong> Laboratory. Retrieved August 6, 2007 from<br />
http://www.nrel.gov/docs/gen/fy01/30298.pdf<br />
Dayton, D.C. (2002). A Review of the Literature on Catalytic <strong>Biomass</strong> Tar Destruction. (NREL/TP-<br />
510-32815) National Renewable <strong>Energy</strong> Laboratory. Retrieved August 6, 2007 from<br />
http://www.nrel.gov/docs/fy03osti/32815.pdf<br />
DeCarrera, R., Ohl M. (2002). <strong>Final</strong> <strong>Report</strong>: Engineering Study for a Full Scale Demonstration of<br />
Steam Reforming Black Liquor Gasification at Georgia-Pacific’s Mill in Big Island, Virginia. (DE –<br />
FC07-99ID13818). Georgia Pacific. Retrieved August 6, 2007 from<br />
http://www.osti.gov/energycitations/servlets/purl/792316-RdYWZ3/native/792316.PDF<br />
Deering, T. (2006, February 17). Taking Matters Into Its Own Hands; Environmental Wood Supply<br />
LLC adds Grinding Operation and Keeps St. Paul Cogeneration Fueled. Construction Bulletin.<br />
Dickerson, M. (2007, January 29). In Mexico, Corn Becomes a Hot Commodity. Miami Herald.<br />
Diebold, J.P. (2000). A Review of the Chemical and Physical Mechanisms of the Storage<br />
Stability of Fast Pyrolysis Bio-Oils. (NREL/SR-570-27613). National Renewable <strong>Energy</strong> Laboratory.<br />
Retrieved August 6, 2007 from http://www.nrel.gov/docs/fy00osti/27613.pdf<br />
Department of Natural Resources [DNR]. (2005). Minnesota Public Stumpage Price Review and<br />
Price Index.<br />
Department of Agriculture [DOA]. (2006). Minnesota Ethanol:Production, Consumption, and<br />
Economic Impact.<br />
Identifying Effective <strong>Biomass</strong> Strategies: Page 175<br />
Quantifying Minnesota’s Resources and Evaluating Future Opportunities
Department of Agriculture [DOA]. 2007. Minnesota’s Ethanol Plants and Capacities. Retrieved<br />
August 6, 2007 from http://www.mda.state.mn.us/renewable/ethanol/capacities.htm<br />
Department of Commerce [DOC]. (2003a). Minnesota's Potential for Electricity Production Using<br />
Manure Biogas Resources: <strong>Final</strong> <strong>Report</strong>.<br />
Department of Commerce [DOC]. (2003b). <strong>Report</strong> on Distributed Generation Technical<br />
Standards and Tariffs.<br />
Department of Commerce [DOC]. (2006a). The Minnesota Utility Data Book (1965-2002).<br />
Retrieved August 6, 2007 from<br />
http://www.state.mn.us/mn/externalDocs/Commerce/Utility_Data_Book,_1965-<br />
2000__030603120425_UtilityDataBook65thru02.pdf<br />
Department of Commerce [DOC]. (n.d.). <strong>Energy</strong> Info Center: Renewable and Efficiency<br />
Incentives. Minnesota Department of Commerce. Retrieved Winter 2006 from<br />
http://www.state.mn.us/portal/mn/jsp/content.doid=-536881350&subchannel=-<br />
536881511&sc2=null&sc3=null&contentid=536885915&contenttype=EDITORIAL&programid=53688<br />
5394&agency=Commerce<br />
Department of Commerce [DoC]. (2007). Initial Post-Hearing Brief on the Minnesota<br />
Department of Commerce. Docket E-017/TR-05-1275. Retrieved on August 6, 2007 from<br />
https://www.edockets.state.mn.us/EFiling/ShowFile.doDocNumber=3758574<br />
Dockter, B. A., and Eylands, K. E. (2003). Development of Management Options for <strong>Biomass</strong><br />
Combustion by-Products in 2003 International Ash Utilization Symposium. University of Kentucky.<br />
Department of <strong>Energy</strong> [DOE]. (2007, February 28). DOE Selects Six Cellulosic Ethanol Plants for<br />
Up to $385 Million in Federal Funding. Press Release. U.S. Department of <strong>Energy</strong>. Retrieved<br />
August 6, 2007 from http://www.energy.gov/news/4827.htm.<br />
Doering, Alan (2007, July 24). Personal Communication.<br />
Downer, S. (2007, January). SMMPA Members Embrace Biodiesel. The Resource.<br />
Dozier, W.A. III. (2002, October). Evaluating Poultry Fat as a Fuel Source for Boilers. Feedmilling<br />
Facts. 3(3). Retrieved August 6, 2007 from<br />
http://www.cpes.peachnet.edu/poultry/october2002nsl.htm<br />
Department of Public Service [DPS]. (1999, March 12). Comments of the Department of Public<br />
Service. Docket E002/M-96-1405.<br />
DuFresne, J., (2005). Minnesota Statewide Solids Application Summary for 2004 Minnesota<br />
Pollution Control Agency.<br />
Duke, J.A. (1983). Handbook of <strong>Energy</strong> Crops. Unpublished. Retrieved August 6, 2007 from<br />
http://www.hort.purdue.edu/newcrop/duke_energy/dukeindex.html<br />
Dynamotive Signs Contract with Ontario Power Authority to Supply Power to the Grid from Its<br />
West Lorne Biofuel Plant. (2007). Morningstar.<br />
Page 176<br />
Identifying Effective <strong>Biomass</strong> Strategies:<br />
Quantifying Minnesota’s Resources and Evaluating Future Opportunities
<strong>Energy</strong> Efficiency and Renewable <strong>Energy</strong> [EERE]. (2004). <strong>Biomass</strong> Feedstock Composition and<br />
Property Database. Department of <strong>Energy</strong>. Retrieved on August 7, 2007 from<br />
http://www.eere.energy.gov/biomass/feedstock_databases.html<br />
<strong>Energy</strong> Efficiency and Renewable <strong>Energy</strong> [EERE]. (2006). Renewable <strong>Energy</strong> Certificate Retail<br />
Products (as of July 2006). Department of <strong>Energy</strong>. Retrieved March 13, 2007 from<br />
http://www.eere.energy.gov/greenpower/markets/certificates.shtmlpage=1<br />
<strong>Energy</strong> Efficiency and Renewable <strong>Energy</strong> and Electric Power Research Institute [EERE and EPRI].<br />
(1997). Renewable <strong>Energy</strong> Technology Characterizations. (TR-109496), U.S. Department of<br />
<strong>Energy</strong> and EPRI. Retrieved August 5, 2007 from<br />
http://www.eere.energy.gov/ba/pdfs/entire_document.pdf<br />
<strong>Energy</strong> Information Administration [EIA]. (1999). Annual Electric Generator <strong>Report</strong> – Nonutility.<br />
Form EIA-860B.<br />
<strong>Energy</strong> Information Administration [EIA]. (2001). Renewable <strong>Energy</strong> 2000: Issues and Trends.<br />
Retrieved August 5, 2007 from<br />
http://www.eia.doe.gov/cneaf/solar.renewables/rea_issues/062800.pdf<br />
<strong>Energy</strong> Information Administration [EIA]. (2002). Renewable <strong>Energy</strong> Annual 2001. <strong>Energy</strong><br />
Information Administration. Retrieved August 5, 2007 from<br />
http://tonto.eia.doe.gov/FTPROOT/renewables/060301.pdf<br />
<strong>Energy</strong> Information Administration [EIA]. (2005a). Annual <strong>Energy</strong> Outlook 2005. <strong>Energy</strong><br />
Information Administration.<br />
<strong>Energy</strong> Information Administration [EIA]. (2005b). Renewable <strong>Energy</strong> Trends 2004. <strong>Energy</strong><br />
Information Administration.<br />
<strong>Energy</strong> Information Administration [EIA]. (2006a). Average Price of Coal Delivered to End Use<br />
Sector by Census Division and State, 2005, 2004 (Dollars Per Short Ton). Retrieved August 6, 2007<br />
from http://www.eia.doe.gov/cneaf/coal/page/acr/table34.html<br />
<strong>Energy</strong> Information Administration [EIA]. (2006b). State <strong>Energy</strong> Profiles: Minnesota. <strong>Energy</strong><br />
Information Administration. Retrieved Spring 2007 from<br />
http://tonto.eia.doe.gov/state/state_energy_profiles.cfmsid=MN<br />
<strong>Energy</strong> Information Administration [EIA]. (2006c). Retail Sales of Electricity by State by Sector by<br />
Provider (EIA-861). <strong>Energy</strong> Information Administration. Retrieved August 6, 2007 from<br />
http://www.eia.doe.gov/cneaf/electricity/epa/sales_state.xls<br />
<strong>Energy</strong> Information Administration [EIA]. (2006d). Electric Power Annual 2005 - State Data<br />
Tables. <strong>Energy</strong> Information Agency,<br />
<strong>Energy</strong> Information Administration [EIA]. (2006e). Assumptions to the Annual <strong>Energy</strong> Outlook<br />
2006. <strong>Energy</strong> Information Agency. (DOE/EIA-0554(2006).<br />
<strong>Energy</strong> Information Administration [EIA]. (2007). Methodology for Allocating Municipal Solid<br />
Waste to Biogenic and Non-Biogenic <strong>Energy</strong>. <strong>Energy</strong> Information Administration<br />
<strong>Energy</strong> Products of Idaho. (n.d.). Retrieved August 6, 2007 from<br />
http://www.energyproducts.com/images/Fbb33d.gif<br />
Identifying Effective <strong>Biomass</strong> Strategies: Page 177<br />
Quantifying Minnesota’s Resources and Evaluating Future Opportunities
Ensyn Group, Inc. (2001, June). The Conversion of Wood and Other <strong>Biomass</strong> to Bio-Oil.<br />
Retrieved August 6, 2007 from http://www.ensyn.com/info/01062001.pdf.<br />
Environmental Protection Agency [EPA]. (2006). Emissions & Generation Resource Integrated<br />
Database.<br />
Environmental Quality Board [EQB]. (1998). Guide to Minnesota Environmental Rules. Retrieved<br />
August 29, 2007 from http://www.eqb.state.mn.us/pdf/rulguid3.pdf.<br />
Environmental Quality Board [EQB]. (2001a). Inventory of Cogeneration Potential in Minnesota.<br />
Environmental Quality Board [EQB]. (2001b). Minnesota Environmental Quality Board's Findings<br />
of Fact, Conclusions, and Order Granting Exemption for Fibrominn <strong>Biomass</strong> Power Plant.<br />
European Commission. (2000). Addressing the Constraints for Successful Replication of<br />
Demonstrated Techynologies for Co-combustion of <strong>Biomass</strong>/Waste (DIS/1743/98-NL). Retrieved<br />
on August 7, 2007 from http://www.ieabcc.nl/publications/report_barriers_cocombustn.pdf<br />
Farrell, A. E., Plevin, R. J., Turner, B. T., Jones, A. D., O'Hare, M., Kammen, D. M. (2006). Ethanol<br />
Can Contribute to <strong>Energy</strong> and Environmental Goals. Science 311 (506)<br />
Fehrs, J. E. (2000). Vermont Methane Pilot <strong>Project</strong>: Resource Assessment.<br />
Federal <strong>Energy</strong> Management Program [FEMP]. (2004). <strong>Biomass</strong> Cofiring in Coal-Fired Boilers.<br />
(DOE/EE-0288). Retrieved August 5, 2007 from<br />
http://www.eere.energy.gov/biomass/pdfs/33811.pdf.<br />
Fibrominn. (n.d.). Retrieved June 13, 2007 from http://www.bensonmn.org/fibrominn/intro.htm.<br />
Financing for US <strong>Biomass</strong> Clone Complete. (2005, February 12) Modern Power Systems.<br />
Foster Wheeler Ltd. Awarded Contract for <strong>Biomass</strong> Boilers in Minnesota (2005, October 6).<br />
Reuters.<br />
Foth & Van Dyke and Associates, Inc. (2006, July). Analysis of a <strong>Biomass</strong>/RDF Facility at Rock-<br />
Tenn. Retrieved August 5, 2007 from<br />
http://www.co.ramsey.mn.us/recovery/docs/R_Rock_Tenn_Analysis.pdf<br />
Gaur, S. and Reed, T.B. (1998). Thermal Data for Natural and Synthetic Fuels. Marcel Dekker,<br />
Inc. New York.<br />
Gillam, C. (2007). Dung Power at U.S. Ethanol Plant. Yahoo! News.<br />
Glassner, D. A., Hettenhaus, J. R., and Schechinger, T. M. (1998). Corn Stover Collection<br />
<strong>Project</strong>, in Bio<strong>Energy</strong> '98: Expanding Bio<strong>Energy</strong> Partnerships.<br />
Goldstein, N. (2005, August). Source Separated Organics as a Feedstock for Digesters. BioCycle<br />
Magazine, 46(8), 42. Retrieved August 5, 2007 from<br />
http://www.jgpress.com/archives/_free/000508.html<br />
Goodrich, P. E. (2005). Anaerobic Digester Systems for Mid-Sized Dairy Farms. The Minnesota<br />
<strong>Project</strong>. Retrieved August 5, 2007 from<br />
http://www.mnproject.org/pdf/agstar%20report%20full%20update.pdf<br />
Page 178<br />
Identifying Effective <strong>Biomass</strong> Strategies:<br />
Quantifying Minnesota’s Resources and Evaluating Future Opportunities
Gordon, G. (2005, December 26). Water Supply Can't Meet Thirst for New Industry. Star Tribune.<br />
Governor Pawlenty Appoints Seven Members to the NextGen <strong>Energy</strong> Board. (2007, June 27).<br />
Press Release. Office of the Governor.<br />
Grant will Help <strong>Biomass</strong> Study. (2006, June 8). Duluth News-Tribune.<br />
Grain and Milling Annual, 2005. Sosland Publishing, Kansas City, MO<br />
Great River <strong>Energy</strong> Supports Wood Waste Plant Near Northome. (1999, May 4). PR Newswire.<br />
Gupta, S. (2004). Plant Power: <strong>Biomass</strong>-to-<strong>Energy</strong> for Minnesota Communities. Minnesotans for<br />
an <strong>Energy</strong> Efficient Economy.<br />
Hartwig, D.A. and Lofthus, D. (2005). Minnesota Agricultural Statistics 2005. USDA, National<br />
Agricultural Statistics Service, Minnesota Field Office, and Minnesota Department of Agriculture.<br />
Hettenhaus, J.R., Wooley, R., and Wiselogel, A. (2000). <strong>Biomass</strong> Commercialization Prospects in<br />
the Next 2 to 5 Years. (NREL/SR-580-28886). Retrieved August 6, 2007 from<br />
www.nrel.gov/docs/fy01osti/28886.pdf<br />
Hewett, M.J., Linner, K.L., Briefer, A., and Strom, S.D., (1996). Opportunities to Expand<br />
Cogeneration in Minnesota. Center for <strong>Energy</strong> and Environment. Retrieved August 5, 2007 from<br />
http://www.mncee.org/pdf/tech_pubs/cogen.pdf.<br />
Hill, J., and Tilman, D. (2006, December 8). Carbon-Negative Biofuels from Low-Input High-<br />
Diversity Grassland <strong>Biomass</strong>. Science, 1598-1600.<br />
Hill, J., and Tilman, G.D. (2007, March 18). There's a new phrase that should be on the lips of all<br />
Minnesotan's, and that phrase is...CELLULOSIC BIOMASS! Star Tribune.<br />
Houston Area Power Plant Runs Entirely on Biodiesel. (2007, March 8).<br />
Renewable<strong>Energy</strong>Access.com. Retrieved August 5, 2007 from<br />
http://www.renewableenergyaccess.com/rea/news/storyid=47687<br />
Hughes, E. (2002). <strong>Biomass</strong> Cofiring with Natural Gas in California. California <strong>Energy</strong> Commission<br />
(500-02-050C). Retrieved August 6, 2007 from<br />
www.energy.ca.gov/pier/final_project_reports/500-02-050.html.<br />
International <strong>Energy</strong> Agency [IEA]. (2005). King (Allen S.) Generating Station #1, Stillwater,<br />
Minnesota. Retrieved March 5, 2007 from http://ieabcc.nl/database/info/cofiring/148.html.<br />
Itasca Power Company [IPC]. (2005). Press Release: Green <strong>Energy</strong> Plant <strong>Project</strong> Cancelled.<br />
Retrieved August 5, 2007 from http://www.itascapower.com/cancellation.html.<br />
Itron. (2004). Oregon <strong>Energy</strong> Trust <strong>Biomass</strong> Market Assessment 2004.<br />
Jacobsen, K. (2004, Spring/Summer). The Market Place. Minnesota Department of Natural<br />
Resources. Retrieved August 6, 2007 from<br />
www.dnr.state.mn.us/publications/forestry/marketplace/index.html<br />
Identifying Effective <strong>Biomass</strong> Strategies: Page 179<br />
Quantifying Minnesota’s Resources and Evaluating Future Opportunities
Jacobsen, K. (2006, Spring). The Market Place. Minnesota Department of Natural Resources.<br />
Retrieved August 6, 2007 from<br />
www.dnr.state.mn.us/publications/forestry/marketplace/index.html<br />
Jacobsen, K. (2007, Spring). The Market Place. Minnesota Department of Natural Resources.<br />
Retrieved on August 6, 2007 from<br />
http://files.dnr.state.mn.us/publications/forestry/marketplace/spring2007.pdf<br />
Jacobsen, Keith (2007, February 13). Personal Communication<br />
Jensen, M.D., Timpe R.C., and Laumb, J.D. (2003). Advanced Heterogeneous Reburn Fuel from<br />
Coal and Hog Manure (Agreement No. DE-FG26-02NT41551). <strong>Energy</strong> & Environmental Research<br />
Center, University of North Dakota.<br />
Jordan, B. and Taff, S. (2005). Minnesota’s Commercial Alternative <strong>Energy</strong> Industries:<br />
Production, Policies, and Local Economies. Center for Rural Policy and Development. Retrieved<br />
August 6, 2007 from http://www.mnsu.edu/ruralmn/pages/Publications/reports/altenergy05.pdf<br />
Karlson, K. J. (2001, April 11). Power Plant Proposed for Downtown St. Paul, Minn., Fuels<br />
Concern. Saint Paul Pioneer Press.<br />
Kilgore, M.A., and Blinn, C.R. (2003). Minnesota’s Timber Harvesting Guidelines: An Assessment of<br />
Their Financial Cost to Forest Landowners and Influence on Willingness to Pay for Stumpage.<br />
University of Minnesota, Department of Forest Resources.<br />
Klass, D.L. (1998). <strong>Biomass</strong> for Renewable <strong>Energy</strong>, Fuels, and Chemicals. Academic Press.<br />
Klein, Alexander. (2002). Gasification: An Alternative Process for <strong>Energy</strong> Recovery and Disposal<br />
of Municipal Solid Wastes. M.S. thesis, Columbia University.<br />
Kokmen, L. (1999, September 29). Against the Grain. City Pages.<br />
Kotrba, R. (2005, September). Turning Off the Valve. Ethanol Producer Magazine.<br />
Kramer, J. M. (2004). Agricultural Biogas Casebook – 2004 Update. Retrieved on August 6, 2007<br />
from http://www.rs-inc.com/downloads/Experiences_with_Agricultural_Biogas_Systems-<br />
2004_Update.pdf<br />
Larson, E. D., Consonni, S., and Katosfky, R.E. (2003). A Cost-Benefit Assessment of <strong>Biomass</strong><br />
Gasification Power Generation in the Pulp and Paper Industry. Retrieved August 5, 2007 from<br />
http://www.agenda2020.org/PDF/BLGCC%20FINAL%20REPORT%208%20OCT%202003.pdf.<br />
Land Management Information Center [LMIC]. (2004). Minnesota Electric Transmission Lines and<br />
Substations, 60 kV or Larger. Minnesota Department of Administration. Retrieved August 5, 2007<br />
from http://www.mnplan.state.mn.us/maps/ElecTran03.pdf.<br />
Lindquist, Mark (2007, August 10). Personal Communication.<br />
Lumberjack RC&D. (2005). The Real Cost of Extracting Logging Residue Study. Retrieved July<br />
2007 from http://dnr.wi.gov/org/land/forestry/publications/Real-Cost-Extracting-Residue.pdf<br />
Page 180<br />
Identifying Effective <strong>Biomass</strong> Strategies:<br />
Quantifying Minnesota’s Resources and Evaluating Future Opportunities
McNeil Technologies, Inc. (2003). <strong>Biomass</strong> Resource Assessment and Utilization Options for Three<br />
Counties in Eastern Oregon. Retrieved August 5, 2007 from<br />
http://www.oregon.gov/ENERGY/RENEW/<strong>Biomass</strong>/assessment.shtml<br />
Miles, P.D., Brand, G.J., and Mielke, M.E. (2006). Minnesota's Forest Resources in 2004. (Resource<br />
Bulletin NC-262). U.S. Department of Agriculture, Forest Service, North Central Research Station.<br />
Miles. T.R., Miles, Jr., T.R., Baxter, L.L., Bryers, R.W., Jenkins, B.M. and Oden, L.L. (1995). Alkali<br />
Deposits Found in <strong>Biomass</strong> Power Plants: A Preliminary Investigation of their Extent and Nature.<br />
(NREL/TP-433-8142). National Renewable <strong>Energy</strong> Laboratory. Retrieved August 5, 2007 from<br />
http://www.nrel.gov/docs/legosti/fy96/8142v1.pdf.<br />
Minnesota Farmers’ 75 MW Alfalfa-Fired Unit would Decrease CO2 Emissions. (1996, May 24,<br />
1996). Utility Environment <strong>Report</strong>.<br />
Minnesota Planning. (2001). Inventory of Cogeneration Potential in Minnesota. Minnesota<br />
Environmental Quality Board.<br />
Minnesota Power. (2003, May 2). Comments Filed In the Matter of Northern States Power d/b/a<br />
<strong>Xcel</strong> <strong>Energy</strong>'s Proposed Plan for Implementing the <strong>Biomass</strong> Mandate Pursuant to Minnesota<br />
Statute 216B.2424 and Amendment to Power Purchase Agreement. Docket E002/M-03-306.<br />
Minnesota Department of Transportation [MNDOT]. (2006). GIS BaseMap. Retrieved August 6,<br />
2007 from http://www.dot.state.mn.us/maps/gisbase/html/datafiles.html<br />
Monsour, T. (2003, March 20). Wood Plant Creates Dispute. Saint Paul Pioneer Press.<br />
Mooney, R. (2000, February). MnVap Pulls the Plug. Hay & Forage Grower.<br />
Morey, R.V., Tiffany, D.G., and Hatfield, D.L. (2005). <strong>Biomass</strong> for Electricity and Process Heat at<br />
Ethanol Plants. 2005 ASAE Annual International Meeting. 17 - 20 July 2005, Tampa, Florida. ASAE<br />
Paper No. 056131. Retrieved August 5, 2007 from<br />
http://www.biomasschpethanol.umn.edu/papers/ASAEPaper056131.pdf.<br />
Morris, D. (2005). Minnesota's <strong>Biomass</strong> Mandate: An Assessment. Institute for Local Self-Reliance.<br />
Retrieved August 5, 2007 from http://www.ilsr.org/biomass/mnbiomass.pdf.<br />
Morrison, E.M. (2005, July - September). Green Power on Campus: UMM will be a National<br />
Model for Heating and Cooling a College Campus with Renewable Fuels. Ag Innovation News.<br />
Morrison, E.M. (2006, July - August). Biodiesel Backup. Ag Innovation News.<br />
Midwest Plan Service [MWPS]. (2004). Manure Characteristics. (MWPS-18, Section 1).<br />
National Agricultural Statistics Service [NASS]. (2006). Agricultural Statistics Data Base (2002-<br />
2004). US Department of Agriculture. Retrieved Spring, 2007 from http://www.nass.usda.gov<br />
Nelson, C., and Lamb, J. (2002). <strong>Final</strong> <strong>Report</strong>: Haubenschild Farms Anaerobic Digester. The<br />
Minnesota <strong>Project</strong>. Retrieved August 6, 2007 from<br />
http://www.mnproject.org/publications/Haubyrptupdated.pdf<br />
Nelson, C. (2007). Renewing Rock-Tenn: A <strong>Biomass</strong> Fuels Assessment for Rock-Tenn's St. Paul<br />
Recycled Paper Mill. Green Institute.<br />
Identifying Effective <strong>Biomass</strong> Strategies: Page 181<br />
Quantifying Minnesota’s Resources and Evaluating Future Opportunities
New York Power Authority Experiments with Biodiesel. (2007, January). Biodiesel Magazine, 2007.<br />
Naval Facilities Engineering Service Center [NFESC]. (n.d.). <strong>Energy</strong> Technology Bulletin: Fuel<br />
Types. Retrieved August 6, 2007 from https://energy.navy.mil/publications/pnl/fueltype.doc<br />
Nilles, D. (2006, August). Control Your <strong>Energy</strong> Destiny. Ethanol Producer Magazine.<br />
Northern States Power Selects 75-MW <strong>Project</strong> Fired by Alfalfa. (1996, September 2). Electric Utility<br />
Week.<br />
National Renewable <strong>Energy</strong> Laboratory [NREL]. (n.d.). Photographic Picture eXchange.<br />
Retrieved August 6, 2007 from http://www.nrel.gov/data/pix/<br />
National Renewable <strong>Energy</strong> Laboratory [NREL]. (2006). Renewable Electric Plant Information<br />
System. Retrieved Spring 2007 from<br />
http://www.nrel.gov/analysis/repis/<br />
National Science Foundation [NSF]. (2006, December 2006). Mixed Prairie Grasses Better Source<br />
of Biofuel Than Corn Ethanol and Soybean Biodiesel. Press Release 06-171.<br />
Northern States Power [NSP]. (1999, December 10). Supplement to <strong>Biomass</strong> <strong>Report</strong>. Docket E-<br />
002/M-95-54.<br />
Oasmaa, A.C., Peacocke, C., Gust, S., Meier, D., and McLellan, R. (2005). Norms and Standards<br />
for Pyrolysis Liquids. End-User Requirements and Specifications. <strong>Energy</strong> Fuels 19(5), 2155 - 2163.<br />
Oland, C.B. (2004). Guide to Combined Heat and Power Systems for Boiler Owners and<br />
Operators. (ORNL/TM-2004/144). Oak Ridge National Laboratory. Retrieved August 6, 2007 from<br />
http://www.eere.energy.gov/industry/bestpractices/pdfs/guide_chp_boiler.pdf<br />
Pawlisch, M., Nelson, C., and Schoenrich, L. (2003). Designing a Clean <strong>Energy</strong> Future: A<br />
Resource Manual. Retrieved August 6, 2007 from<br />
http://www.cleanenergyresourceteams.org/pdf/CERTsEntire.pdf<br />
Perlack, R., Wright, L, Turhollow, A., Graham, R., Stokes, B., and Erbach, D. (2005). <strong>Biomass</strong> as<br />
Feedstock for a Bioenergy and Bioproducts Industry: The Technical <strong>Feasibility</strong> of a Billion-Ton<br />
Annual Supply. (ORNL/TM-2005/66). Oak Ridge National Laboratory. Retrieved August 5, 2007<br />
from http://feedstockreview.ornl.gov/pdf/billion_ton_vision.pdf<br />
Peterson, D. R. (2005). The Real Cost of Extracting Logging Residue. Lumberjack Resource<br />
Conservation and Development Council, Inc.<br />
Petrolia, D. R. (2005). The Economics of Harvesting and Transporting Corn Stover for Conversion<br />
to Fuel Ethanol: A Case Study for Minnesota. Department of Applied Economics, University of<br />
Minnesota.<br />
Pollution Control Agency, ed. [PCA]. (2004). Remission Permit No. 15100038-002.<br />
Pollution Control Agency, ed. [PCA]. (2005a). Letter to Interested Parties Concerning Waste<br />
Combustor Rule Revision "Working Draft".<br />
Pollution Control Agency, ed. [PCA]. (2005b). Proposed Permanent Rules Relating to Waste<br />
Combustors.<br />
Page 182<br />
Identifying Effective <strong>Biomass</strong> Strategies:<br />
Quantifying Minnesota’s Resources and Evaluating Future Opportunities
Pollution Control Agency, ed. [PCA]. (2006). 2006 Annual <strong>Report</strong> to the Minnesota Legislature<br />
on the Minnesota Closed Landfill Program.<br />
Post, T. (2007, June 18). Fibrominn Powers Ahead with Turkey Litter. Minnesota Public Radio.<br />
Retrieved August 6, 2007 from<br />
http://minnesota.publicradio.org/display/web/2007/06/15/turkeypower/<br />
Poultry Litter to Fuel Minnesota Plant. (2005, February 14). Engineering News-Record. Retrieved<br />
August 6, 2007 from http://enr.ecnext.com/coms2/summary_0271-9528_ITM<br />
<strong>Project</strong>s Wait for Funding. (2004(b), April 24). The Daily Tribune.<br />
Public Utilities Meeting Heats Up. (2004(a), February 11). The Daily Tribune.<br />
Public Utilities Commission [PUC]. (1998, August 14). Order Granting Intervention, Allowing Late-<br />
Filed Comments, and Establishing Supplemental Comment Period. Docket E-002/M-95-54.<br />
Public Utilities Commission [PUC]. (1999a, August 5). Order Deferring Consideration of <strong>Biomass</strong><br />
Generation Proposals. Docket E-002/M-96-1405.<br />
Public Utilities Commission [PUC]. (1999b, April 22). Order Approving Power Purchase<br />
Agreement, Subject to Conditions. Docket E-002/M-95-54.<br />
Public Utilities Commission [PUC]. (2000a, January 11). Order Approving Power Purchase<br />
Agreement with EPS/ Beck Power, LLC. Docket E-002/M-96-1405.<br />
Public Utilities Commission [PUC]. (2000b, January 11). Order Approving Power Purchase<br />
Agreement with St. Paul Cogeneration <strong>Project</strong>, LLC, Authorizing Comments, and Requiring<br />
Annual <strong>Report</strong>. Docket E002/M-96-1405.<br />
Public Utilities Commission [PUC]. (2001, May 8). Order Approving <strong>Biomass</strong> Power Purchase<br />
Agreement and Requiring Annual <strong>Report</strong>ing. Docket E002/M-00-1169.<br />
Public Utilities Commission [PUC]. (2004a, September 28). In the Matter of Establishing Generic<br />
Standards for Utility Tariffs for Interconnection and Operation of Distributed Generation Facilities<br />
under Minnesota Laws 2001, Chapter 212. Docket E-999/CI-01-1023<br />
Public Utilities Commission [PUC]. (2004b, September 28). State of Minnesota: Guidelines for<br />
Establishing the Terms of the Financial Relationship between an Electric Utility and a Distributed<br />
Generation Customer with no More than 10 MW of Capacity. Minnesota Public Utilities<br />
Commission. Docket E-999/CI-01-1023.<br />
Public Utilities Commission [PUC]. (2005, August 10). Order Approving Second Amended and<br />
Restated <strong>Biomass</strong> Power Purchase Agreement. Docket E-002/M-04-91.<br />
Ragland, K. W., Ostlie, L.D., and Berg, D.A. (2000). WTE <strong>Biomass</strong> Power Plant in Central<br />
Wisconsin. Wisconsin <strong>Energy</strong> Bureau; Division of <strong>Energy</strong> and Intergovernmental Relations.<br />
Rawlings, C., Rummer, B., Seeley, C., Thomas, C., Morrison, D., Han, H., et al. (2004, December<br />
21). A Study of How to Decrease the Costs of Collecting, Processing and Transporting Slash.<br />
Montana Community Development Corporation. Retrieved August 5, 2007 from<br />
http://www.mtcdc.org/pdf/SlashStudy<strong>Final</strong>.pdf<br />
Identifying Effective <strong>Biomass</strong> Strategies: Page 183<br />
Quantifying Minnesota’s Resources and Evaluating Future Opportunities
Rawlings, C., Seeley, C., and Thomas, C. (2005). Forest Residues Transportation Costing Model.<br />
Forest Operations Research, US Department of Agriculture Forest Service. Retrieved August 5,<br />
2007 from<br />
http://www.srs.fs.usda.gov/forestops/download.htm<br />
Recycling Efforts Gain Stature in Corporate Profit Pictures. (2003, January 16). Recycling Today.<br />
Renewable Electric Power Plant Information System (REPIS). (n.d.). National Renewable <strong>Energy</strong><br />
Laboratory. Retrieved August 6, 2007 from http://www.nrel.gov/analysis/repis/index.html<br />
Oberstar, J. (2005, June 3). Oberstar Announces USDA Grant. Retrieved August 7, 2007 from<br />
http://www.oberstar.house.gov//index.aspType=B_PR&SEC={E97399E6-989A-49DA-A1B1-<br />
F232F668C3E9}&DE={7600D92A-AC3E-47A0-9DDE-D425DAC91F82}<br />
Riemenschneider, D.E., Netzer, D.A. and Berguson, W.E. (1996). Intensive Culture of Hybrid<br />
Poplars in Minnesota. Presented at the First Conference of the Short Rotation Woody Crops<br />
Operations Working Group. Paducah, KY. September 23-25, 1996. Retrieved August 6, 2007<br />
from http://www.woodycrops.org/paducah/riemenschneider.html<br />
RISI. (2006). Lockwood-Post Directory of Pulp and Paper Mills. Miller Freeman Publishing<br />
Company.<br />
Rudd, K. (2006). Koda <strong>Energy</strong> <strong>Biomass</strong> <strong>Project</strong>. Clean <strong>Energy</strong> Resource Teams. Retrieved<br />
August 6, 2007 from http://www.cleanenergyresourceteams.org/metro/CS-Koda%20<strong>Energy</strong>.pdf<br />
Schechinger, T. (2000). Corn Stover Collection Methods — Present and Future. Retrieved<br />
August 6, 2007 from http://devafdc.nrel.gov/pdfs/4922.pdf<br />
Schmidt, D.D. and Pinapati, V. (2000). Opportunities for Small <strong>Biomass</strong> Power Systems. (2000-<br />
EERC-11-01). <strong>Energy</strong> & Environmental Research Center, University of North Dakota.<br />
Schmidt, S. (n.d.). <strong>Biomass</strong> <strong>Energy</strong> Opportunities from Hybrid Poplars In Minnesota. Retrieved on<br />
August 6, 2007 from http://www.extension.umn.edu/woodlands/biomass/schmidt.pdf<br />
Schroeder, J. W. (2006, November/December). Partial List of North Dakota and Regional Co-<br />
Product Prices. North Dakota State University Extension Service. Retrieved January, 2007 from<br />
http://www.ag.ndsu.nodak.edu/aginfo/dairy/dairyext/coproduct.htm<br />
Shoemaker, D. (2003). Valuing Corn Silage: How Much Is It Worth The Ohio State University<br />
Extension.<br />
Southern Minnesota Municipal Power Agency [SMMPA]. (2006). Power of the Bean.<br />
Smook, G.A. (1992). Handbook for Pulp and Paper Technologists. Tappi Press.<br />
Sparby, M. and Massie, C. (2006). Application of <strong>Biomass</strong> Gasification at Central MN Ethanol<br />
Coop. Presented to Managing High <strong>Energy</strong> Costs: Discussion of Alternatives and Opportunities,<br />
May 16, 2006.<br />
Stachura, S. (2006, September 18). Ethanol Vs. Water: Can Both Win Minnesota Public Radio.<br />
Retrieved August 5, 2007 from<br />
http://minnesota.publicradio.org/display/web/2006/09/07/ethanolnow/<br />
Page 184<br />
Identifying Effective <strong>Biomass</strong> Strategies:<br />
Quantifying Minnesota’s Resources and Evaluating Future Opportunities
Stephens, W.R. (2006, March). A Biofuel of a Similar Line. Biodiesel Magazine.<br />
Stevens, D.J. (2001). Hot Gas Conditioning: Recent Progress with Larger-Scale <strong>Biomass</strong><br />
Gasification Systems. (NREL/SR-510-29952) National Renewable <strong>Energy</strong> Laboratory. Retrieved<br />
August 5, 2007 from http://www.nrel.gov/docs/fy01osti/29952.pdf<br />
St. Paul Cogeneration. (2000, June 22). St. Paul Cogeneration's Reply Comments. Docket E-<br />
002/M-96.<br />
Sturzl, R. (1997). The Commercial Co-Firing of RTP Bio-Oil at the Manitowoc Public Utilities Power<br />
Generating Station. Manitowoc Public Utilities. Retrieved August 5, 2007 from<br />
http://www.ensyn.com/docs/manitowoc/manitowoc.htm.<br />
Swanson, G. (2004, April 7). Hibbing, Virginia Agree on <strong>Biomass</strong> <strong>Energy</strong> Venture. The Daily<br />
Tribune.<br />
Tallaksen, J. (2007, March 17). Looking Toward the Next Generation of Agricultural <strong>Energy</strong><br />
Crops. Morris Sun Tribune.<br />
Tiffany, D. G. (2005). Economic Analysis: Co-generation Using Wind and Biodiesel-Powered<br />
Generators. Department of Applied Economics University of Minnesota.<br />
Tiffany, D. G., Fruin, J. E. (1995). Sustainable <strong>Biomass</strong> <strong>Energy</strong> Production. Center for Alternative<br />
Plant and Animal Products, University of Minnesota<br />
Tilman, D, Reich, P.B., Knops, J., Wedin, D., Mielke, T., and Lehman, C. (2001). Diversity and<br />
Productivity in a Long-Term Grassland Experiment. Science, 294, 843-845.<br />
Trigen - Cinergy Joint Venture to Develop 25MW <strong>Biomass</strong> Cogen Plant in St. Paul. (1999, January<br />
15, 1999). Utility Environment <strong>Report</strong>.<br />
Trillium Planning & Development. (2002). Combined Heat & Power from <strong>Biomass</strong>: Former South<br />
Side Destructor. Center for Rural Policy & Development and The Green Institute.<br />
University of Missouri Extension [UME]. (2006). By-Product Feed Price Listing. Retrieved Spring<br />
2007 from http://agebb.missouri.edu/dairy/byprod/bplist.asp<br />
University of Minnesota (2004). State of Minnesota 2004 Capital Budget Request: University of<br />
Minnesota <strong>Project</strong> Narrative Morris - District Facilities. Retrieved August 6, 2007 from<br />
http://www.budget.state.mn.us/budget/capital/2004/final/233691.pdf<br />
University of Minnesota Extension Service [UMES]. (2006). Upper Midwest Haylist. Retrieved<br />
Spring 2007 from http://www.haylist.umn.edu<br />
U.S. Census. 2000. Census 2000. United States Census Bureau.<br />
http://www.census.gov/main/www/cen2000.html<br />
U.S. Department of Agriculture [USDA]. (2006). Monthly Contract <strong>Report</strong>: Practice Summary for<br />
Active Crep Contracts for All Program Years (1998-2007). Retrieved August 5, 2007 from<br />
http://content.fsa.usda.gov/crpstorpt/09Approved/r1meprtw/MN.HTM<br />
U.S. Department of Agriculture [USDA]. (2007a). <strong>Biomass</strong> Gasification: a Comprehensive<br />
Demonstration of a Community-Scale <strong>Biomass</strong> <strong>Energy</strong> System<br />
Identifying Effective <strong>Biomass</strong> Strategies: Page 185<br />
Quantifying Minnesota’s Resources and Evaluating Future Opportunities
U.S. Department of Agriculture [USDA]. (2007b). National Hay, Feed & Seed Weekly Summary.<br />
Retrieved on August 6, 2007 from<br />
http://www.ams.usda.gov/LSMNpubs/pdf_weekly/feedseed.pdf<br />
U.S. Department of Agriculture [USDA]. (2007c). Livestock Grain and Market News (LGMN).<br />
Retrieved on August 6, 2007 from http://marketnews.usda.gov/portal/lg<br />
U.S. Forest Service. (n.d.). Forest Inventory Analysis. Retrieved Spring 2006 from<br />
http://www.fia.fs.fed.us/<br />
Wald, M.L. (2006). Corn Power Put to the Test. New York Times.<br />
Wald, M. (2007, July 10). Costs Surge for Building New Power Plants. The New York Times.<br />
Retrieved on August 6, 2007 from<br />
http://www.nytimes.com/2007/07/10/business/worldbusiness/10energy.htmlex=1186545600&en<br />
=7cd1fb882d0e7e9d&ei=5070<br />
Washington State University. (n.d.). Compost Images. Retrieved August 6, 2007 from<br />
http://organic.tfrec.wsu.edu/compost/ImagesWeb/CompImages.html<br />
Webb, T., (2006, June 28). Ethanol Plans Threaten Corn Shortage. Saint Paul Pioneer Press.<br />
Williams, R.H. Larson, E.D. (1993). Advanced Gasification-Based <strong>Biomass</strong> Power Generation.<br />
Renewable <strong>Energy</strong>: Sources for Fuels and Electricity. Island Press.<br />
Williams, R.H. and Larson, E.D. (1996). <strong>Biomass</strong> Gasifier Gas Turbine Power Generating<br />
Technology. <strong>Biomass</strong> and Bioenergy 10(203), 149-166. Retrieved August 5, 2007 from<br />
http://www.princeton.edu/~energy/publications/pdf/1996/Williams_96_<strong>Biomass</strong>_Gasifier_Gas_Tu<br />
rbine.pdf<br />
Wilson, C. (2007, July 7). Sucked Dry. City Pages.<br />
Wiltsee, G. (2000). Lessons Learned from Existing <strong>Biomass</strong> Power Plants. (NREL/SR-570-26946)<br />
National Renewable <strong>Energy</strong> Laboratory. Retrieved August 5, 2007 from<br />
http://www.nrel.gov/docs/fy00osti/26946.pdf.<br />
<strong>Xcel</strong> <strong>Energy</strong>. (2003, February 27). Proposed Plan Pursuant to Minn. Stat 216B2424 and Related<br />
Petitions. Docket E002/M-03-306.<br />
<strong>Xcel</strong> <strong>Energy</strong>. (2004, August 9). <strong>Report</strong> on Power Purchase Agreements and Resource Acquisition<br />
in Docket Nos. E002/M-01-168, E002/M-04-91, E002/M-00-1169, Docket No. E002/Cl-03-2044,<br />
E002/M-04-998, E002/M-04-451, E002/M-04-864, E002/M-04-404, E002/M-04-1426<br />
<strong>Xcel</strong> <strong>Energy</strong>. (2005, February 9). <strong>Report</strong> on Power Purchase Agreements and Resource<br />
Acquisition in Docket Nos. E002/M-01-168, E002/M-04-91, E002/M-00-1169, Docket No. E002/Cl-<br />
03-2044, E002/M-04-998, E002/M-04-451, E002/M-04-864, E002/M-04-404, E002/M-04-1426<br />
<strong>Xcel</strong> <strong>Energy</strong>. (2006, January 31, 2006). <strong>Report</strong> on Power Purchase Agreements and Resource<br />
Acquisition. Dockets E002/M-01-1618, E002/M-00-1169.<br />
<strong>Xcel</strong> <strong>Energy</strong>. (2007). Renewable Development Fund Request for Proposals: Third Funding Cycle.<br />
Retrieved August 6, 2007 from http://www.xcelenergy.com/docs/RDFCycle3RFP.pdf<br />
Page 186<br />
Identifying Effective <strong>Biomass</strong> Strategies:<br />
Quantifying Minnesota’s Resources and Evaluating Future Opportunities
Xenergy and Energetic Management Associates. (2003). Securing a Place for <strong>Biomass</strong> in the<br />
Northeast United States: A Review of Renewable <strong>Energy</strong> and Related Policies. Retrieved August<br />
5, 2007 from http://www.nrbp.org/pdfs/nrbp_final_report.pdf<br />
Zeman, N. (2006, April). Pure Green Power. Biodiesel Magazine.<br />
Identifying Effective <strong>Biomass</strong> Strategies: Page 187<br />
Quantifying Minnesota’s Resources and Evaluating Future Opportunities
APPENDIX A : BIOPET MANUAL<br />
(version 1.1)<br />
INTRODUCTION<br />
Figure A-1: Main Screen<br />
This Bio-Power Evaluation Tool was developed to provide general guidance in estimating costs of<br />
various biomass feedstocks and technological strategies used to generate electricity from<br />
biomass. It is meant to provide a means of comparing various biomass strategies; however it<br />
should not be assumed to generate cost estimates of sufficient detail for use as final cost<br />
estimates for a proposed project.<br />
The tool allows a user to estimate the annual levelized cost of energy for a proposed power<br />
plant based on supply and cost estimates for a range of biomass fuels and power plant<br />
characteristics. Default values are provided for most characteristics; however the user is able to<br />
assign their own values if they have more specific cost estimates or wish to evaluate the effects<br />
of changing parameters on project performance. Factory default values are retained within the<br />
spreadsheet and can be restored if necessary.<br />
The Bio-Power Evaluation Tool consists of worksheets to estimate feedstock costs and supply,<br />
power plant characteristics and costs, and overall project economics. Users can save feedstock<br />
and power plant scenarios as they work and combine those scenarios to assess what<br />
combinations of feedstocks and power plants will result in the lowest cost energy. The<br />
Evaluation tool also provides a sensitivity analysis for each final project evaluation so that the<br />
user can evaluate how sensitive the proposed project is to changes in various costs.<br />
Identifying Effective <strong>Biomass</strong> Strategies: Page A-1<br />
Quantifying Minnesota’s Resources and Evaluating Future Opportunities
OVERALL STRUCTURE<br />
The evaluation tool is designed to allow the user to develop different “scenarios” that can be<br />
combined later to evaluate different options. There are three scenario types: Feedstock, Power<br />
Plant, and <strong>Project</strong>. The <strong>Project</strong> Scenario is comprised of a combination of the first two.<br />
Feedstock Scenario<br />
The development of a feedstock scenario allows the user to build a feedstock development and<br />
delivery system ending with a cost per MMBTU for a fully-processed fuel at the power plant. You<br />
may make as many Feedstock Scenarios as you wish. All Feedstock Scenarios must be logged<br />
to be used for future analysis.<br />
Power Plant Scenario<br />
The development of a power plant scenario allows the user to define the characteristics of an<br />
operating power plant. This includes such things as power plant size, capital costs, operating<br />
expenses, rate of return, inflation, etc… Once a scenario has been defined, it must be logged<br />
to be used for future analysis.<br />
<strong>Project</strong> Summary<br />
Once a Feedstock Scenario and a Power Plant Scenario have been created and logged, it is<br />
possible to calculate the estimated cost of delivered energy. One may select a Power Plant<br />
Scenario and input different Feedstock Scenarios to evaluate the economic impacts of various<br />
options. One may also conduct sensitivity analysis on the <strong>Project</strong> Scenarios to understand the<br />
impacts of fluctuating inputs on the final energy cost. <strong>Project</strong> Scenarios can also be logged for<br />
future reference.<br />
Define<br />
Feedstock<br />
Scenario(s)<br />
Log Scenario<br />
Results<br />
Define Power<br />
Plant<br />
Scenario(s)<br />
Log Scenario<br />
Results<br />
Select a Logged Feedstock<br />
and Power Plant Scenario<br />
RESULT<br />
Estimated Cost of<br />
Delivered <strong>Energy</strong><br />
Figure A-2: Evaluation Methodology<br />
Page A-2<br />
Identifying Effective <strong>Biomass</strong> Strategies:<br />
Quantifying Minnesota’s Resources and Evaluating Future Opportunities
BIOMASS FEEDSTOCKS<br />
Figure A-3: Main Feedstock Screen<br />
The user can choose from over 60 biomass feedstocks from the pull down menu, or create their<br />
own. Each feedstock can be assigned values for a number of characteristics. Where possible,<br />
generic data for each characteristic is provided for each feedstock. In cases where generic<br />
information is not provided, or when the user has specific information for a known feedstock<br />
source, the user can provide their own information or use values of other feedstocks as a<br />
substitute.<br />
After updating information for a feedstock (if needed) clicking “Save Settings” will save the userprovided<br />
information and over-write the default values. This allows a feedstock whose attributes<br />
vary from the default to be used in multiple feedstock scenarios without requiring re-entry of<br />
data in each scenario. Clicking the “Restore Factory Defaults” will return all feedstock<br />
information to their original factory-set default values. Clicking “Restore Look-Ups” will reset onscreen<br />
values to the saved numbers associated with the currently-selected feedstock,<br />
effectively undoing any unsaved changes.<br />
New feedstocks can be created by selecting one of the “User Defined Field” options from the<br />
dropdown menu, entering the relevant data, and clicking on “Save Settings.” If desired, the<br />
user can also rename feedstocks (e.g., to make the name easier to recognize than “User<br />
Defined Field”).<br />
Identifying Effective <strong>Biomass</strong> Strategies: Page A-3<br />
Quantifying Minnesota’s Resources and Evaluating Future Opportunities
Field Characteristics<br />
<strong>Energy</strong> Content<br />
Each fuel comes with a default value for energy content. The energy content provided is the<br />
high heating value for each fuel, which disregards the moisture content of the fuel. <strong>Biomass</strong><br />
feedstocks are variable by nature, and therefore may vary significantly in their asharvested/processed<br />
energy content. If the user has more specific energy content the default<br />
values can be overwritten.<br />
Payment/Market Price<br />
The Payment/Market Price is the price paid to the landowner for the feedstock itself, or the right<br />
to harvest the feedstock. If the proposed project is to be fueled with agricultural products for<br />
which there is a pre-existing market current market prices should be utilized. Market prices for<br />
some commonly traded feedstocks have been provided based on currently available<br />
information. If a market price is not provided they can often be found on the web.<br />
For feedstocks for which there is not an existing market price a landowner payment should be<br />
entered that represents the price paid for the right to harvest the feedstock. A value of $10/ton<br />
has been entered as a default value for many feedstocks.<br />
Typically, market prices represent the price paid for feedstock that is ready for transportation to<br />
storage or the power plant. Additional fields (described below) are provided for a number of<br />
other costs, such as on-site processing. Users can choose to break each cost out separately or<br />
use the Market Price field to represent the total of all costs prior to the fuel leaving the point of<br />
production. The important point is simply to avoid double-counting, so that (for example)<br />
processing costs that are folded into the market price are not entered again on the Processing<br />
line.<br />
Avoided Disposal Costs<br />
If the fuel is derived from a waste stream, such as processing wastes, or urban wood waste a<br />
value can be provided for the avoided cost of disposal.<br />
Recoverable Portion<br />
Some biomass feedstocks cannot be fully recovered. This may be due to the potential for<br />
increased soil erosion or decreased soil carbon if too much of the feedstock is removed. It may<br />
also be due to technological limitations relating to harvest technology. The percentage of each<br />
feedstock that can be removed is highly dependent upon local soil types as well as agricultural<br />
practices. For instance, a high percentage of corn stover can be removed only where no-till or<br />
mulch till practices are employed. Where these practices are not utilized corn stover should not<br />
be harvested. A single value has been assumed for the recoverable portion of each feedstock.<br />
The value used represents an average estimate.<br />
Moisture Content<br />
The moisture content of biomass fuels has a significant impact on the percentage of the energy<br />
content of the fuel that can be used to produce power. This is due to the energy needed to<br />
evaporate the moisture found in the fuel. A fuel’s moisture content will depend on the time of<br />
Page A-4<br />
Identifying Effective <strong>Biomass</strong> Strategies:<br />
Quantifying Minnesota’s Resources and Evaluating Future Opportunities
harvest, the extent to which the fuel was dried after harvest and the way in which the fuel was<br />
processed and stored. Default values have been provided for a number of the fuels in the<br />
model.<br />
Site Processing<br />
Some degree of processing may be necessary at the source of the biomass feedstock.<br />
Agricultural residues may need to be dried and/or baled in the field. Logging residues may be<br />
chipped prior to shipment to a storage facility or the power plant. Food processing wastes may<br />
need to be dewatered prior to use in an anaerobic digester. Default cost values are provided<br />
for each processing option. If more accurate information is available user defined values can<br />
be substituted.<br />
Feedstock Type<br />
The physical characteristics of the feedstock will affect the fuel’s collection and loading costs.<br />
Bales are handled with different equipment than loose woodchips.<br />
Availability<br />
The feedstock availability tool provides an estimate of the quantity of a given biomass feedstock<br />
available within a defined radius of the desired county. County level feedstock availability was<br />
derived from a number of sources including the National Agricultural Statistics Service county<br />
level database. For some feedstocks the quantity available had to be inferred from the<br />
available data. For instance the quantity of corn stover available was derived from the quantity<br />
of corn harvested in each county, based on the typical ratio of corn stover to corn grain.<br />
For the purposes of determining the quantity of fuel available at various transport distances from<br />
a proposed facility the biomass resources of each county were assigned to a point at the<br />
geographical center of the county. The biomass resources available within 25 to 150 miles (in<br />
25-mile increments) of the county center are determined by the county centers that fall within<br />
each radius. For this reason the feedstock availability tool should only be used to gauge the<br />
order of magnitude of specific biomass resources within a region. For instance a county center<br />
that falls just within the 25-mile radius of another county center may have biomass resources<br />
assigned to it that could be significantly more than 25 miles from the original county center<br />
depending upon county geography. A proposal for a commercial bio-power plant should<br />
include much more detailed estimates of available biomass than what is generated by this tool.<br />
Defining the Fuel Delivery Path<br />
It is necessary to develop a full-cost approximation for the delivery of a fully-usable fuel to the<br />
power generation facility. This delivery path can vary significantly across feedstocks and<br />
projects and may take many forms. The user is required to select which options will be included<br />
in the normal operation of the proposed project.<br />
Identifying Effective <strong>Biomass</strong> Strategies: Page A-5<br />
Quantifying Minnesota’s Resources and Evaluating Future Opportunities
Feedstock<br />
Site<br />
Processing<br />
Yard<br />
(optional)<br />
Storage<br />
Facility<br />
(optional)<br />
Power<br />
Plant<br />
Figure A-4: Feedstock Delivery Path<br />
The most complicated delivery path will include stops at all available stages. If storage will not<br />
take place at a dedicated storage facility, but will instead take place at the Feedstock Site,<br />
Processing Yard or Power Plant the transport distances under the “Storage” menu should be set<br />
to zero. Similarly, if there is not a separate Processing Yard in the delivery path, the distances<br />
under “Ship to Processing Yard” should be set to zero.<br />
Transportation Costs<br />
The user may define up to three different methods of transportation (road, rail, and barge) and<br />
the associated distances of each for each link in the feedstock delivery chain. The user may<br />
therefore set a delivery path for biomass fuels that includes transporting the feedstock X miles by<br />
truck, Y miles by train, and Z miles by barge.<br />
A single default cost value is provided for each mode of transportation and each feedstock. If<br />
the user anticipates that transportation costs will be different for each link in the feedstock<br />
delivery chain he may define different values for each link. This can be done through entering a<br />
new cost per ton/mile under the “Processing Yard”, “Storage” and/or “Power Plant” screens and<br />
then clicking on the “Save Settings” button. This will assign the new transportation costs to the<br />
relevant link in the supply chain. The user may also enter transportation costs in the “Inputs”<br />
worksheet accessed through the “View All Inputs” link on the “Feedstock Selection” screen.<br />
Different transportation assumptions may be made depending upon the consistency of the fuel.<br />
The user may define the feedstock as a solid or liquid. This distinction was made assuming that<br />
transportation of a liquid would require significantly different equipment for loading and<br />
unloading needs.<br />
The cost impact of omitting a stage of the delivery path can be observed by use of the dropdown<br />
“Yes” and “No” menus for the Processing Yard and Storage Facility. If the value is set to<br />
“No,” the stage will be ignored in calculating the delivered cost per MMBTU. It should be noted,<br />
however, that all costs associated with the stage will be ignored; if the feedstock must be<br />
processed before being used, these costs will need to be added to a different stage in order to<br />
preserve the accuracy of the calculation.<br />
Page A-6<br />
Identifying Effective <strong>Biomass</strong> Strategies:<br />
Quantifying Minnesota’s Resources and Evaluating Future Opportunities
Processing Yard<br />
Figure A-5: Feedstock to Processing Yard Screen<br />
Some biomass feedstocks may be shipped to a processing yard prior to shipment to a storage<br />
facility or power plant. There are two general models for processing yards. The first would be<br />
local processing yards where materials are hauled a short distance to a local processing facility<br />
before shipment to the plant or storage. Instances of this may include logging residues<br />
transported a short distance to a central yard where it can be chipped and loaded for<br />
transport. The other model for a processing yard is one that is relatively close and accessible to<br />
the power plant, and often under the control of the power plant. Such processing yards may be<br />
advantageous to facilities with little room for processing or storage. For example, in one known<br />
proposal, two separate facilities plan on using a single processing yard due to their inability to<br />
store significant quantities of fuel on-site. The partnership will also allow each individual project<br />
to capture some economies of scale.<br />
Identifying Effective <strong>Biomass</strong> Strategies: Page A-7<br />
Quantifying Minnesota’s Resources and Evaluating Future Opportunities
Storage Facility<br />
Figure A-6: Feedstock to Storage Facility Screen<br />
Some biomass feedstocks will need to be stored at offsite storage facilities until they are needed<br />
by the power plant. This will often be the case for facilities dependent upon biomass that is<br />
harvested during a narrow window of time during the year (switchgrass or corn stover for<br />
instance). Fuel processing for storage may take place at the storage facility or prior to delivery.<br />
Storage facilities can take many forms from stacks of uncovered bales in a field to relatively<br />
large fully enclosed storage barns. To estimate storage costs one must estimate the capital and<br />
handling costs associated with each storage method as well as the expected dry matter loss<br />
associated with each method. Storing unprotected bales in the open requires no capital<br />
expenditures and very little handling; however the loss of dry matter from such a storage<br />
method can be quite significant.<br />
Page A-8<br />
Identifying Effective <strong>Biomass</strong> Strategies:<br />
Quantifying Minnesota’s Resources and Evaluating Future Opportunities
Figure A-7: Feedstock to Power Plant Screen<br />
Power Plant<br />
<strong>Biomass</strong> fuel must ultimately be shipped to the power plant. Once on site the fuel may be stored<br />
or immediately processed to generate electricity. <strong>Final</strong> processing steps often include screening<br />
and size reduction to the appropriate particle size. Default costs for transport to the plant,<br />
processing and unloading are provided, or the user can provide more specific costs if available.<br />
Calculate<br />
Once the fuel characteristics and the delivery path are defined, a calculation for the delivered<br />
cost of a fully-processed feedstock to the Power Plant is provided. It is the experience of biopower<br />
facilities that a diversity of fuel supplies enables them to keep their costs low as well as<br />
enable them to ensure a reliable supply. In addition, the relatively high cost of transporting<br />
biomass fuels can have a profound effect on the cost of delivered fuel. For these reasons a user<br />
may find it advantageous to estimate the costs of a number of biomass feedstocks transported<br />
over a range of distances for a given location. This will enable the user to generate a more<br />
comprehensive picture of the biomass fuels available within a region as well as the range of<br />
delivered costs that each fuel can be sourced for.<br />
Save This Feedstock<br />
Each <strong>Biomass</strong> Feedstock Scenario must be saved in the Feedstock Log. Once all data has been<br />
entered, click “Save This Feedstock” to save the feedstock scenario. The cost per MMBTU will be<br />
recalculated before saving in order to ensure that the most recent changes are preserved, and<br />
the new feedstock scenario is then available for comparison with other scenarios. The data for<br />
the scenario can be reviewed, edited, copied, and deleted by selecting “Feedstock” under<br />
Identifying Effective <strong>Biomass</strong> Strategies: Page A-9<br />
Quantifying Minnesota’s Resources and Evaluating Future Opportunities
“Logs” in the Navigation Menu. Note that every time the user clicks “Save This Feedstock,” a<br />
new entry is created in the Feedstock Log, even if an identical entry exists. For this reason, edits<br />
should be made in the log, and the Feedstock Worksheet used to create new scenarios.<br />
ELECTRIC GENERATING FACILITY<br />
The Power Plant Definition worksheet allows the user to generate a number of proposed power<br />
plants in order to evaluate the effects of changing power plant characteristics and economic<br />
assumptions on proposed projects. Each proposed power plant can be saved with the “Add to<br />
Power Plant Log” button. The user must provide many of the values for this worksheet. There are<br />
built-in financing assumptions for this worksheet, though these can be replaced with user input.<br />
The economic engine for the Power Plant section is based on the “Generic <strong>Biomass</strong> Power Plant<br />
Model” developed at the University of California – Davis. More highly technical users may get<br />
more value from using this and other tools that can be accessed via the web. 6<br />
Navigation Bar<br />
Power Plant<br />
Main<br />
Directory Scenario Default<br />
Feedstock<br />
Availability<br />
Plant Characteristics<br />
Defaults<br />
Processing Capital Cost (total) $ 70,000,000.00<br />
Storage Plant Capacity (kW) 25,000 kW<br />
Power Plant Capacity Factor (operating hrs / 8760) 85.0%<br />
Power Plant Net Electrical Efficiency 20.0%<br />
Expenses Expenses $ 5,800,000.00 / yr<br />
Financing<br />
<strong>Project</strong> Summary<br />
Non-Electrical <strong>Energy</strong> Income<br />
Logs<br />
Feedstock Capacity Payment $ 166.00 / kW-year<br />
Power Plant Other Income $ - / year<br />
<strong>Project</strong> Reserve Interest Rate 5.00%<br />
Financing<br />
Power Plant Characteristics<br />
Figure A-8: Power Plant Screen<br />
The user must generate estimates for basic power plant characteristics. Overall plant capacity,<br />
as well as total capital costs must be estimated.<br />
6 California <strong>Biomass</strong> Collaborative. <strong>Energy</strong> Cost Calculator Website<br />
http://faculty.engineering.ucdavis.edu/jenkins/CBC/Calculator/index.html<br />
Page A-10<br />
Identifying Effective <strong>Biomass</strong> Strategies:<br />
Quantifying Minnesota’s Resources and Evaluating Future Opportunities
Capital Cost<br />
Users must estimate the capital costs of a proposed facility. For new biomass powered plants<br />
the <strong>Energy</strong> Information Agency (EIA) estimates the costs of a new facility to be $1,809 per kW.<br />
For proposals to co-fire biomass with coal the EIA estimates that expenditures of $108 to $248 per<br />
kilowatt of biomass capacity will be necessary.<br />
Plant Capacity<br />
The optimal capacity of a proposed plant will largely depend upon the low cost biomass<br />
resources available to the plant. Building a plant that is too large for the local and regional<br />
resource base to support will likely lead to high fuel costs, and potentially an inability to supply<br />
sufficient fuel for the plant. As a general rule biomass plants are assumed to draw their fuel<br />
supplies from a fifty-mile radius. Transporting biomass fuels for more than 50 miles by road may<br />
be uneconomical. Procuring low cost fuels from greater distances may be possible if rail<br />
transport is utilized. This will largely depend on a facility’s ability to take advantage of existing rail<br />
infrastructure.<br />
Capacity Factor<br />
The capacity factor of an electric generating plant plays an important role in the plant’s<br />
economics. More reliable plants have a greater opportunity to generate revenue than less<br />
reliable plants because they operate for more hours out of the year, thus producing more<br />
electricity to sell to the utility. The capacity factor measures reliability by representing the<br />
average amount of time that the plant is expected to be operating at full capacity over the<br />
course of a year, expressed as a percentage. A plant that operated at full capacity all year<br />
would thus have a 100% capacity factor, while time spent operating at less than full capacity, or<br />
time when the plant was shut down for maintenance (scheduled or unscheduled) would reduce<br />
the capacity factor. For example, a plant that experienced 100 hours per year of maintenance<br />
or other shutdown, and operated at 80% capacity the rest of the year, would have a capacity<br />
factor of 79.1%<br />
Net Electrical Efficiency<br />
Net electrical efficiency is the ratio of electrical energy output from the plant to the energy<br />
contained in the fuel input. This measures how efficiently the plant converts the fuel energy to<br />
electricity.<br />
Non-Electrical <strong>Energy</strong> Income<br />
Capacity Payments<br />
A plant’s reliability also presents opportunities to generate revenue through the capacity<br />
payments paid by the utility. Plants that are more reliable have the potential to receive higher<br />
capacity payments for the capacity that they provide to the system.<br />
Independent power producers are paid by utilities based on the utility’s avoided energy and<br />
capacity costs. Capacity payments are based on a utility’s avoided capital costs, fixed O&M<br />
costs, and startup costs for a new capacity addition. Proposed facilities greater than 10 MW in<br />
size must negotiate the rates that they will receive from the utility.<br />
Identifying Effective <strong>Biomass</strong> Strategies: Page A-11<br />
Quantifying Minnesota’s Resources and Evaluating Future Opportunities
2001 legislation ordered Minnesota’s utilities to establish standards for the interconnection and<br />
operation of distributed generation facilities under 10MW. While the utilities are not required to<br />
offer standard contracts, the model contracts that each utility must propose is intended to<br />
provide distributed generation facilities under 10 MW with sufficient information to plan for new<br />
facilities.<br />
Other Income<br />
In addition to capacity payments independent power producers can potentially receive credit<br />
for a utility’s avoided distribution costs, as well as renewable energy credits and emission credits.<br />
According to PUC, 2005b, generators should receive no additional credits for diversity, line losses,<br />
or reliability.<br />
Some biomass facilities may derive income from waste heat or excess biogas to industrial or<br />
commercial facilities. The waste products from biomass energy facilities may have some<br />
commercial value as well. Anaerobic digester waste is often used as a high quality soil<br />
amendment. Ash may be used as a soil amendment in some circumstances, or it may be used<br />
as a component of cement.<br />
Interest Rate<br />
Enter the expected rate of interest that will be earned on the project’s debt reserve.<br />
No estimates are provided for these potential sources of revenue; however the user may enter<br />
estimates of their own.<br />
Figure A-9: Power Plant Expenses Screen<br />
Page A-12<br />
Identifying Effective <strong>Biomass</strong> Strategies:<br />
Quantifying Minnesota’s Resources and Evaluating Future Opportunities
Expenses<br />
A number of common expenses are included in the expense detail. Expenses are incorporated<br />
into the cost estimate on an annual cost basis, as opposed to a per kWh basis.<br />
Labor Costs<br />
These include the salaries of plant employees.<br />
Maintenance Costs<br />
All power plants require occasional maintenance. Maintenance costs (as well as the downtime<br />
associated with plant maintenance) can have a significant effect on a plant’s economic<br />
success.<br />
Insurance/Property Tax<br />
Power plants will need to be insured and pay property taxes.<br />
Utilities<br />
Power plants may need connection to water supply, sewage and the electrical grid. Plants<br />
must contract with the utility if backup power to the plant will be needed.<br />
Ash Disposal<br />
The ash produced by a power plant may need to be landfilled.<br />
Management/Administration<br />
These represent the costs of managing and administering a plant.<br />
Other Expenses<br />
Any other expenses can be accounted for here.<br />
Identifying Effective <strong>Biomass</strong> Strategies: Page A-13<br />
Quantifying Minnesota’s Resources and Evaluating Future Opportunities
Figure A-10: Financial Assumption Screen<br />
Financing<br />
For a more detailed explanation of the financing of power plants see Appendix C.<br />
Debt Ratio<br />
The debt ratio is the percentage of the project’s costs that are financed. The remaining funds<br />
are assumed to come from private equity. The default ratio of 75% is common.<br />
Interest Rate on Debt<br />
The interest rate on debt is the interest rate paid on loans to finance the project.<br />
Economic Life<br />
When estimating the costs of a plant it is common to assume a 20-year commercial life of the<br />
plant.<br />
Cost of Equity (Rate of Return)<br />
The cost of equity is the rate of return that would have been achieved with any private equity<br />
used to finance the project, if it had not been invested in the project. This is a measure used by<br />
firms to ensure that they direct their investments to ensure the highest return possible.<br />
Page A-14<br />
Identifying Effective <strong>Biomass</strong> Strategies:<br />
Quantifying Minnesota’s Resources and Evaluating Future Opportunities
General Economic Inflation Rate<br />
The general economic inflation rate represents the rate of degradation of the purchasing power<br />
of the dollar. In 2005 the rate was 3.4%. Rates have been rising generally since January of 2002.<br />
Inflation rates are difficult to predict, however they can have a significant influence on<br />
investment decisions and outcomes. Current and historical inflation data is available at the U.S.<br />
Department of Labor Bureau of Labor Statistics (www.bls.gov).<br />
Fuel Escalation Rate<br />
Enter the nominal rate at which fuel costs are expected to increase. This figure should include<br />
any increase due to inflation: if real fuel costs are expected to increase at 1% and inflation is<br />
2.1%, then the Fuel Escalation Rate should be 3.1%. If fuel costs are expected to decrease over<br />
time, subtract the real change in price from the inflation rate.<br />
Production Tax Credit Escalation Rate<br />
The Federal Production Tax Credit (see below) is indexed to inflation and re-calculated each<br />
year. Thus, the most appropriate value for this field would be the same as the General<br />
Economic Inflation Rate. Other values can be entered if changes to federal policy are<br />
anticipated.<br />
Escalation Rate - Other (Non-Fuel)<br />
This represents the Non-fuel escalation rate. This accounts for the escalation of costs not<br />
associated with general inflation, fuel costs, or the escalation of available Production Tax<br />
Credits.<br />
Federal Tax Rate<br />
The default federal tax rate is 34%. If another federal tax rate is relevant it can be user defined.<br />
State Tax Rate<br />
The default state tax rate is 9.6%. If another state tax rate is relevant it can be user defined.<br />
Participation in Minnesota’s JOBZ program could significantly change a facility’s state tax<br />
burden through 2015.<br />
Production Tax Credit<br />
There is a federal tax credit for 10 years for projects installed by January 1, 2008. As of 2005, this<br />
credit is worth $0.009/kWh; the credit is increased annually to keep pace with inflation. There is a<br />
state payment of $0.015/kWh for ten years for generation from on-farm anaerobic manure<br />
digester systems.<br />
Save This Power Plant<br />
Each Power Plant Scenario must be saved in the Power Plant Log. Once all data has been<br />
entered, click “Save This Power Plant” to save the power scenario. The new power plant<br />
scenario is then available for comparison with other scenarios. The data for the scenario can be<br />
reviewed, edited, copied, and deleted by selecting “Power Plant” under “Logs” in the<br />
Identifying Effective <strong>Biomass</strong> Strategies: Page A-15<br />
Quantifying Minnesota’s Resources and Evaluating Future Opportunities
Navigation Menu. Note that every time the user clicks “Save This Power Plant,” a new entry is<br />
created in the Power Plant Log, even if an identical entry exists. For this reason, edits should be<br />
made in the log, and the Power Plant Worksheet used to create new scenarios.<br />
PROJECT SUMMARY<br />
Figure A-11: <strong>Project</strong> Summary Screen<br />
Once the first two worksheets have been completed, the Evaluate the Complete <strong>Project</strong><br />
worksheet provides a means of pairing various feedstock(s) and power plant scenarios. This<br />
should enable a user to determine which combination of feedstock(s) and power plant will<br />
generate the lowest cost energy. Each project scenario can be saved to the project scenarios<br />
log.<br />
A percentage (on an output basis) can be entered for situations in which multiple feedstocks<br />
are used (ie. co-firing, seasonal variation, etc…). The percentage should always sum to 100%.<br />
Results<br />
Each project scenario is capable of generating a levelized annual cost of energy (in cents/kWh)<br />
and overnight cost (in $/kW). The levelized cost of energy is the real (inflation-adjusted) cost,<br />
while the overnight cost is presented in nominal (current-dollar) terms. The levelized annual cost<br />
of energy is the inflation-adjusted price that a plant must receive for its electricity that ensures<br />
that costs will be covered and equity fully paid off at the end of the economic life of the project.<br />
Overnight cost is the full capital cost of the plant without the inclusion of interest paid on loans<br />
during the construction period.<br />
Sensitivity Analysis<br />
The sensitivity analysis performed on each proposal evaluation illustrates the change in constant<br />
levelized cost of energy that one could expect from varying the rate of one of the included<br />
Page A-16<br />
Identifying Effective <strong>Biomass</strong> Strategies:<br />
Quantifying Minnesota’s Resources and Evaluating Future Opportunities
variables, while holding all other variables constant. The sensitivity analysis is presented in terms<br />
of the relative (%) change of each variable, as opposed to an absolute change in value.<br />
Sensitivity Analysis<br />
Feedstock Costs<br />
0.18<br />
0.16<br />
0.14<br />
Cost of <strong>Energy</strong><br />
($/kWh, Constant)<br />
0.12<br />
0.10<br />
0.08<br />
0.06<br />
0.04<br />
0.02<br />
0.00<br />
-50 -40 -30 -20 -10 0 10 20 30 40 50 60 70 80 90 100<br />
Relative Change (%)<br />
Figure A-12: Sensitivity Analysis Graph<br />
LOGS<br />
Since the Feedstock Log and the <strong>Project</strong> Scenario Log each have a comparative data point<br />
that allows the user to evaluate different strategies (ie. $/MMBtu and $/kWh respectively), basic<br />
graphing functionality was included to compare all data entries. This can be found at the far<br />
right column of each Log sheet. When pressed it creates a chart as shown in the example<br />
below.<br />
Identifying Effective <strong>Biomass</strong> Strategies: Page A-17<br />
Quantifying Minnesota’s Resources and Evaluating Future Opportunities
<strong>Project</strong> Comparisons<br />
$0.140<br />
$0.135<br />
$0.130<br />
$ / kWh<br />
(LAC - constant $)<br />
$0.125<br />
$0.120<br />
$0.115<br />
$0.110<br />
$0.105<br />
Test 1 Test 2 Test 3 Test 4 Test 5<br />
<strong>Project</strong> Scenario<br />
Figure A-13: Example of <strong>Project</strong> Log Scenario Graph<br />
Figure A-14: Directory Screen<br />
Page A-18<br />
Identifying Effective <strong>Biomass</strong> Strategies:<br />
Quantifying Minnesota’s Resources and Evaluating Future Opportunities
RESOURCE DIRECTORY<br />
Additionally, a directory of organizational resources for those considering developing biomass<br />
projects in Minnesota is available for reference. The directory can be viewed alphabetically or<br />
categorized by the general type of work that they do. Many of the organizations are involved in<br />
various aspects of biomass projects. This list does not imply that the organizations shown cannot<br />
also assist in other needs. Also, this list is not meant to be an endorsement of any of the<br />
organizations listed.<br />
CONSULTING<br />
Provides technical reviews, plans, advice, and/or<br />
insight into the actual development, construction,<br />
and operation of biomass electric power plants<br />
FINANCING<br />
Offers financing alternatives<br />
NON-PROFIT/ADVOCACY Promotes various biomass strategies and has<br />
particular insights on political and/or strategic issues<br />
RESEARCH<br />
TECHNICAL VENDOR<br />
TRADE GROUP<br />
UTILITY<br />
Evaluates newer technologies and approaches<br />
Provides equipment for biomass applications<br />
Member-based industry organizations that work on<br />
biomass issues<br />
Electricity providers that have been involved in<br />
biomass projects<br />
This list is focused on organizations that are in Minnesota, do business in Minnesota, have been<br />
involved in Minnesota projects, or have a particular understanding of the biomass<br />
feedstocks/technologies that are particular to Minnesota. It is not meant to be an exhaustive<br />
list, but it is representative of the organizations that are available to assist interested parties.<br />
Identifying Effective <strong>Biomass</strong> Strategies: Page A-19<br />
Quantifying Minnesota’s Resources and Evaluating Future Opportunities
APPENDIX B : INDUSTRY CONTACT LIST<br />
Organizational resources for those considering developing biomass projects in Minnesota are<br />
presented in two formats. The first is an alphabetical list, the second is a list categorized by the<br />
general type of work that they do. However many of the organizations are involved in various<br />
aspects of biomass projects and this list does not imply that the organizations shown cannot also<br />
assist in other needs.<br />
CONSULTING<br />
FINANCING<br />
NON-PROFIT/ADVOCACY<br />
RESEARCH<br />
TECHNICAL VENDOR<br />
TRADE GROUP<br />
UTILITY<br />
Provides technical reviews, plans, advice, and/or insight into the<br />
actual development, construction, and operation of biomass<br />
electric power plants<br />
Offers financing alternatives<br />
Promotes various biomass strategies and has particular insights<br />
on political and/or strategic issues<br />
Evaluates newer technologies and approaches<br />
Provides equipment for biomass applications<br />
Member-based industry organizations that work on biomass<br />
issues<br />
Electricity providers that have been involved in biomass projects<br />
This list is focused on organizations that are in Minnesota, do business in Minnesota, have been<br />
involved in Minnesota projects, or have a particular understanding of the biomass<br />
feedstocks/technologies that are particular to Minnesota. It is not meant to be an exhaustive<br />
list, but it is representative of the organizations that are available to assist interested parties.<br />
Identifying Effective <strong>Biomass</strong> Strategies: Page B-1<br />
Quantifying Minnesota’s Resources and Evaluating Future Opportunities
Table B-1: Alphabetized List<br />
Company Name<br />
City, State Zip<br />
Main Phone<br />
Website<br />
Category<br />
Brief Description<br />
Agriculture Utilization and Research<br />
Institute<br />
Crookston, MN 56716-0599<br />
(800) 279-5010<br />
www.auri.org<br />
Research<br />
Conducting research on value-added products<br />
from agriculture, including pelletized fuel, energy<br />
crops, and community anaerobic digestors. Offices<br />
are in Crookston (headquarers), Marshall, and<br />
Waseca.<br />
AgSTAR<br />
Washington, DC 20460<br />
(202) 343-9041<br />
www.epa.gov/agstar/index.html<br />
Research<br />
Technical assistant program though the U.S.<br />
Environmental Protection Agency for anaerobic<br />
digester systems for animal agriculture.<br />
AgStar Financial Services<br />
Rochester, MN 55901<br />
(507) 529-2049<br />
www.agstar.com<br />
Financing<br />
Provide financing for anaerobic digester and wind<br />
projects. Financed Haubenschild project near<br />
Princeton, MN.<br />
Alliant <strong>Energy</strong><br />
Madison, WI 53707-1007<br />
(800) 255-4268<br />
www.alliantenergy.com<br />
Utility<br />
Has three anaerobic digesters (0.8 MWs). Also, the<br />
Chariton Valley <strong>Biomass</strong> <strong>Project</strong> (a cooperative<br />
effort with Chariton Valley Resource Conservation<br />
and Development, and the U.S. Dept. of <strong>Energy</strong>) is<br />
an initiative to develop switchgrass and other<br />
grasses as a supplemental for coal-fired power<br />
plants.<br />
Barr Engineering<br />
Hibbing, MN 55746<br />
(218) 262-3465<br />
www.barr.com<br />
Consulting<br />
Design wood handling systems. Helped design<br />
system for Virginia/Hibbing biomass district heating.<br />
Black and Veatch<br />
Ann Arbor, MI 48105<br />
(734) 665-1000<br />
www.bv.com<br />
Consulting<br />
One of largest power plant engineering companies<br />
in the world, have designed and built numerous<br />
biomass plants. Did conceptual engineering for<br />
Phillips <strong>Biomass</strong> <strong>Project</strong>.<br />
CH2MHill<br />
Eagan, MN 55121<br />
(651) 688-8100<br />
www.ch2m.com<br />
Consulting<br />
Environmental review and air permitting expertise.<br />
Also have biomass power plant division.<br />
Page B-2<br />
Identifying Effective <strong>Biomass</strong> Strategies:<br />
Quantifying Minnesota’s Resources and Evaluating Future Opportunities
Clean <strong>Energy</strong> Resource Teams<br />
(CERTs)<br />
St. Paul, MN 55108<br />
(612) 624-2293<br />
www.cleanenergyresourceteams.or<br />
g<br />
Non-profit/<br />
advocacy<br />
Working to create regional resources for clean<br />
energy and economic development for<br />
communities across the state. Website has case<br />
studies and resources for developing clean energy<br />
projects, including biomass.<br />
Cornerstone Partners<br />
Minneapolis, MN 55403<br />
(847) 601-3812<br />
www.cornerstonepartners.info<br />
Financing<br />
Provide financial services to biomass and other<br />
power projects, including financial model<br />
development and equity and debt placement.<br />
Delve <strong>Energy</strong><br />
Medina, MN 55340<br />
(763) 478-3580<br />
www.delveenergy.com/<br />
Consulting<br />
Experience with Combined Heat and Power<br />
applications.<br />
Department of <strong>Energy</strong> - <strong>Biomass</strong><br />
Division<br />
Washington, DC 20585<br />
www1.eere.energy.gov/biomass<br />
Research<br />
Expertise in small biomass, biorefinery technologies<br />
and applications.<br />
Electric Power Research Institute<br />
Palo Alto, CA 94304<br />
(650) 855-2000<br />
www.epri.com<br />
Research<br />
Funded by utilities, do research on biomass, among<br />
other issues. Involved in fuel cell application on<br />
Haubenshild Farms digester, near Princeton, MN.<br />
<strong>Energy</strong> Products of Idaho<br />
Coeur d'Alene, ID 83815-8928<br />
(208) 765-1611<br />
www.energyproducts.com/<br />
Technology<br />
vendor<br />
Produce fluidized bed and gasifier biomass<br />
conversion technologies.<br />
Environomics<br />
Salt Point, NY 12578<br />
(845) 635-4206<br />
www.waste2profits.com/index.htm<br />
Consulting<br />
Consulting and design services for anaerobic<br />
digesters. Was involved with Haubenschild digester<br />
near Princeton, MN.<br />
FibroWatt<br />
Newtown, PA 19067<br />
(267) 352 0014<br />
www.fibrowattusa.com<br />
Technology<br />
vendor<br />
Building a turkey litter plant near Benson, MN.<br />
Identifying Effective <strong>Biomass</strong> Strategies: Page B-3<br />
Quantifying Minnesota’s Resources and Evaluating Future Opportunities
Foster Wheeler<br />
Clinton, NJ 08809-4000<br />
www.fwc.com<br />
Technology<br />
vendor<br />
Design and build biomass thermal and power<br />
plants. Built the U of M steam plant fluidized bed<br />
coal/biomass boiler.<br />
Fresh <strong>Energy</strong><br />
St. Paul, MN 55102<br />
(651) 225-0878<br />
www.fresh-energy.org<br />
Nonprofit/advoc<br />
acy<br />
Comprehensive list of state-level biomass policy<br />
measures/papers.<br />
FVB <strong>Energy</strong><br />
Minneapolis, MN 55402<br />
(612) 607-4544<br />
www.fvbenergy.com<br />
Consulting<br />
One of the largest district heating firms in the world,<br />
involved with multiple biomass combined heat and<br />
power projects.<br />
GHD, Inc.<br />
Chilton, WI 53014<br />
(920) 849-9797<br />
Consulting<br />
Have built and designed multiple digester systems<br />
in Wisconsin.<br />
Golder and Associates<br />
Roseville, MN 55113<br />
(651) 697-9737<br />
www.golder.com<br />
Consulting<br />
Environmental review and air permitting expertise.<br />
Involved with air permitting for several Minnesota<br />
biomass projects.<br />
Great Plains Institute for Sustainable<br />
Development (GPISD)<br />
Minneapolis, MN 55407<br />
612) 278-7150<br />
www.gpisd.net<br />
Nonprofit/advoc<br />
acy<br />
Work in Upper Midwest, researching energy crop<br />
production and utilization.<br />
HDR<br />
Minneapolis, MN 55416-1567<br />
(763) 591-5400<br />
www.hdrinc.com<br />
Consulting<br />
Engineering and environmental review expertise.<br />
Did work for former NGPP hybrid popular project<br />
near Waseca.<br />
HGA<br />
Minneapolis, MN 55401<br />
(612) 758-4463<br />
www.hga.com<br />
Consulting<br />
Designing biomass campus heating system for<br />
University of Minnesota Morris.<br />
Page B-4<br />
Identifying Effective <strong>Biomass</strong> Strategies:<br />
Quantifying Minnesota’s Resources and Evaluating Future Opportunities
Home Farms Technologies<br />
Brandon, Manitoba R7A 5A3<br />
Canada<br />
(877) 464-7667<br />
www.homefarmstech.com<br />
Initiative for Renewable <strong>Energy</strong> and<br />
the Environment - University of<br />
Minnesota<br />
St. Paul, MN 55108<br />
(612) 624-7266<br />
www1.umn.edu/iree<br />
Institute for Agriculture and Trade<br />
Policy (IATP)<br />
Minneapolis, MN 55404<br />
(612) 870-0453<br />
www.iatp.org<br />
Technology<br />
vendor<br />
Research<br />
Nonprofit/advoc<br />
acy<br />
Produce small scale biomass gasifiers. Working on<br />
several potential applications in Minnesota.<br />
Provide financial and research support for<br />
renewable energy production across Minnesota.<br />
Work on developing new, sustainable markets for<br />
family farmers and foresters, including bio-energy,<br />
wood waste, and energy crop utilization.<br />
Institute for Local Self-Reliance (ILSR)<br />
Minneapolis, MN 55414<br />
(612) 379-3815<br />
www.ilsr.org<br />
Non-<br />
Profit/Advoc<br />
acy<br />
Comprehensive understanding of state/regional<br />
biomass and distributed generation policies/rules.<br />
Izaak Walton League of America,<br />
Midwest Office<br />
1619 Dayton Avenue, Suite 202<br />
St. Paul, MN 55104<br />
www.iwla.org<br />
Non-<br />
Profit/Advoc<br />
acy<br />
State, regional, and national energy policy<br />
knowledge on renewable energy as well as other<br />
environmental concerns.<br />
John Madole and Associates<br />
Minneapolis, MN 55436<br />
(952) 927-5179<br />
Consulting<br />
Consulting services on wood procurment and<br />
anaerobic digestion. Conducted wood assessment<br />
study for District <strong>Energy</strong> St. Paul.<br />
L & J Dairy Services<br />
Harmony, MN 55939<br />
(507) 261-1379<br />
Consulting<br />
Consulting on anaerobic digester systems.<br />
Laurentian Engineering Group<br />
Duluth, MN 55811<br />
(218) 733-999<br />
www.legroup.com<br />
Consulting<br />
Power engineering and air permit consulting.<br />
Involved in the conversion of Hibbing plant to<br />
wastewood firing.<br />
Identifying Effective <strong>Biomass</strong> Strategies: Page B-5<br />
Quantifying Minnesota’s Resources and Evaluating Future Opportunities
Market Street <strong>Energy</strong><br />
St. Paul, MN 55102-1611<br />
(651) 297-8955<br />
www.districtenergy.com<br />
Consulting<br />
Consulting unit of District <strong>Energy</strong> St. Paul. Did some<br />
conceptual engineering for Rock-Tenn project in St.<br />
Paul.<br />
Minnesota Department of<br />
Agriculture<br />
St. Paul, MN<br />
(800) 967-2474<br />
www.mda.state.mn.us/<br />
Financing<br />
Involved in promoting anaerobic digesters for the<br />
MN dairy industry, run loan program for digesters.<br />
Minnesota Department of<br />
Commerce - State <strong>Energy</strong> Office<br />
St. Paul, MN 55101<br />
(651) 296-5175<br />
www.commerce.state.mn.us<br />
Research<br />
State planning studies on biogas and plant energy.<br />
Once on the website, do an internal search for<br />
"bioenergy" to access documents.<br />
Minnesota Milk Producers<br />
Waite Park, MN 56387<br />
(877) 577-0741<br />
www.mnmilk.org/<br />
Trade group<br />
Involved in promoting anaerobic digesters for the<br />
MN dairy industry.<br />
Minnesota Power<br />
Duluth, MN 55802<br />
(218) 722-2641<br />
www.mnpower.com<br />
Utility<br />
Operates two biomass-fueled facilities: Rapids<br />
<strong>Energy</strong> Center at Grand Rapids and Hibbard<br />
<strong>Energy</strong> Center in Duluth that mainly consume<br />
production waste from adjacent paper mills and<br />
purchased wood. Both units also burn coal.<br />
National Renewable <strong>Energy</strong><br />
Laboratory<br />
Golden, CO 80401<br />
www.nrel.gov<br />
Research<br />
Expertise in national planning on bioenergy<br />
resources and applications.<br />
Northland Securities<br />
Minneapolis, MN 55402<br />
(612) 851-4952<br />
www.northlandsecurities.com<br />
Financing<br />
Handle many financial services related to biomass<br />
projects, including project due dilligence, bond<br />
issuing, equity placement. Doing financing for<br />
Virginia/Hibbing biomass district heating plant.<br />
Prime <strong>Energy</strong><br />
Tulsa, OK 74158<br />
(918) 835-1011<br />
www.primenergy.com<br />
Technology<br />
vendor<br />
Produce gasifier for thermal/power applications.<br />
Providing gasifier for Little Falls ethanol plant.<br />
Page B-6<br />
Identifying Effective <strong>Biomass</strong> Strategies:<br />
Quantifying Minnesota’s Resources and Evaluating Future Opportunities
RCM Digesters<br />
Berkeley, CA 94704<br />
(510) 834.4568<br />
www.rcmdigesters.com<br />
Consulting<br />
Design and build anaerobic digesters for animal<br />
agriculture industry. Designed Haubenschild system<br />
near Princeton, MN.<br />
Recovered <strong>Energy</strong> Resources<br />
Rochester, MI 48308<br />
(540) 675-2492<br />
www.recoveredenergyresources.co<br />
m<br />
Technology<br />
vendor<br />
Produce small scale biomass gasifiers. U of M Morris<br />
considering this technology.<br />
RW Beck<br />
St. Paul, MN 55121<br />
(651) 994-8415<br />
www.rwbeck.com/home.asp<br />
Consulting<br />
History of work in MN on analysis of waste streams.<br />
Nationally, have acted as owners engineer for<br />
numerous biomass projects<br />
Sebesta Blomberg<br />
Roseville, MN 55113-0020<br />
(651) 634-0775<br />
www.sebesta.com<br />
Consulting<br />
Engineering & environmental review expertise for<br />
bioenergy facilities. Involved in Little Falls ethanol<br />
plant gasifier.<br />
The Green Institute<br />
Minneapolis, MN 55407<br />
(612) 278-7100<br />
www.greeninstitute.org<br />
Nonprofit/advoc<br />
acy<br />
Expertise in developing small wood combined heat<br />
and power projects.<br />
The Minnesota <strong>Project</strong><br />
St. Paul, MN 55104<br />
(651) 645-6159<br />
www.mnproject.org<br />
Nonprofit/advoc<br />
acy<br />
State level biomass policy knowledge, background<br />
developin anaerobic digesters, rural renewable<br />
energy projects.<br />
Tim Goodman and Associates<br />
St. Louis Park, MN 55426<br />
(952) 544-6005<br />
Consulting<br />
Waste and recycling consultant. Has completed<br />
analysis of waste wood industry in St.<br />
Paul/Minneapolis area.<br />
University of Minnesota, Dept. of<br />
Applied Economics<br />
St. Paul, MN 55108-6040<br />
(612) 625-1222<br />
www.apec.umn.edu<br />
Research<br />
Currently studies include: food marketing and<br />
consumption economics; economic development,<br />
trade and policy; production and managerial<br />
economics; resource and environmental<br />
economics; public sector economics; and<br />
agribusiness management.<br />
Identifying Effective <strong>Biomass</strong> Strategies: Page B-7<br />
Quantifying Minnesota’s Resources and Evaluating Future Opportunities
University of Minnesota, Dept. of<br />
Biosystems and Ag Engineering<br />
St. Paul, MN 55108<br />
(612) 625-4215<br />
www.bae.umn.edu<br />
Research<br />
Involved with researching and assessing anaerobic<br />
digester systems.<br />
University of North Dakota - <strong>Energy</strong><br />
& Environmental Research Center<br />
Grand Forks, ND 58202-9018<br />
(701) 777-5000<br />
www.eerc.und.nodak.edu<br />
Research<br />
Mapped biomass resources regionally, expertise in<br />
small biomass power system technologies and<br />
applications.<br />
Utility Engineering<br />
Minneapolis, MN 55402<br />
(612) 215-1304<br />
www.ue-corp.com<br />
Consulting<br />
Power plant engineering, as well as fuels<br />
assessment work. Conducted a fuels assessment for<br />
a project in Minnesota.<br />
West Central Research and<br />
Outreach Center<br />
Morris, MN 56267<br />
(320) 589-1711<br />
wcroc.coafes.umn.edu<br />
Research<br />
Developing a campus heating system fueled by<br />
biomass for U of M Morris as well as conducting<br />
other related research.<br />
Wolf and Associates<br />
Elk River, MN 55330<br />
(763) 576-9040<br />
Consulting<br />
Design and build fuel handling systems. Built St. Paul<br />
District <strong>Energy</strong> fuel handling system.<br />
<strong>Xcel</strong> <strong>Energy</strong><br />
Minneapolis, MN 55401-1993<br />
(800) 328-8226<br />
www.xcelenergy.com<br />
Utility<br />
<strong>Xcel</strong> <strong>Energy</strong> has contracted for the development of<br />
110 megawatts of electricity generated by<br />
biomass-fueled technologies. Waste wood, fastgrowth<br />
poplar trees, and poultry litter will all be<br />
used as fuel to generate electricity.<br />
Page B-8<br />
Identifying Effective <strong>Biomass</strong> Strategies:<br />
Quantifying Minnesota’s Resources and Evaluating Future Opportunities
Table B-2: Categorized List<br />
CATEGORY<br />
COMPANY NAME<br />
CITY, STATE ZIP<br />
MAIN PHONE<br />
WEBSITE<br />
BRIEF DESCRIPTION<br />
CONSULTING<br />
Barr Engineering<br />
Hibbing, MN 55746<br />
(218) 262-3465<br />
www.barr.com<br />
Design wood handling systems. Helped design<br />
system for Virginia/Hibbing biomass district<br />
heating.<br />
CONSULTING<br />
Black and Veatch<br />
Ann Arbor, MI 48105<br />
(734) 665-1000<br />
www.bv.com<br />
One of largest power plant engineering<br />
companies in the world, have designed and built<br />
numerous biomass plants. Did conceptual<br />
engineering for Phillips <strong>Biomass</strong> <strong>Project</strong>.<br />
CONSULTING<br />
CH2MHill<br />
Eagan, MN 55121<br />
(651) 688-8100<br />
www.ch2m.com<br />
Environmental review and air permitting expertise.<br />
Also have biomass power plant division.<br />
CONSULTING<br />
Delve <strong>Energy</strong><br />
Medina, MN 55340<br />
(763) 478-3580<br />
www.delveenergy.com/<br />
Experience with Combined Heat and Power<br />
applications.<br />
CONSULTING<br />
Environomics<br />
Salt Point, NY 12578<br />
(845) 635-4206<br />
www.waste2profits.com/index.htm<br />
Consulting and design services for anaerobic<br />
digesters. Was involved with Haubenschild<br />
digester near Princeton, MN.<br />
CONSULTING<br />
FVB <strong>Energy</strong><br />
Minneapolis, MN 55402<br />
(612) 607-4544<br />
www.fvbenergy.com<br />
One of the largest district heating firms in the<br />
world, involved with multiple biomass combined<br />
heat and power projects.<br />
CONSULTING<br />
GHD, Inc.<br />
Chilton, WI 53014<br />
(920) 849-9797<br />
Have built and designed multiple digester systems<br />
in Wisconsin.<br />
Identifying Effective <strong>Biomass</strong> Strategies: Page B-9<br />
Quantifying Minnesota’s Resources and Evaluating Future Opportunities
CONSULTING<br />
Golder and Associates<br />
Roseville, MN 55113<br />
(651) 697-9737<br />
www.golder.com<br />
Environmental review and air permitting expertise.<br />
Involved with air permitting for several Minnesota<br />
biomass projects.<br />
CONSULTING<br />
HDR<br />
Minneapolis, MN 55416-1567<br />
(763) 591-5400<br />
www.hdrinc.com<br />
Engineering and environmental review expertise.<br />
Did work for former NGPP hybrid popular project<br />
near Waseca.<br />
CONSULTING<br />
HGA<br />
Minneapolis, MN 55401<br />
(612) 758-4463<br />
www.hga.com<br />
Designing biomass campus heating system for<br />
University of Minnesota Morris.<br />
CONSULTING<br />
John Madole and Associates<br />
Minneapolis, MN 55436<br />
(952) 927-5179<br />
Consulting services on wood procurment and<br />
anaerobic digestion. Conducted wood<br />
assessment study for District <strong>Energy</strong> St. Paul.<br />
CONSULTING<br />
L & J Dairy Services<br />
Harmony, MN 55939<br />
(507) 261-1379<br />
Consulting on anaerobic digester systems.<br />
CONSULTING<br />
Laurentian Engineering Group<br />
Duluth, MN 55811<br />
(218) 733-999<br />
www.legroup.com<br />
Power engineering and air permit consulting.<br />
Involved in the conversion of Hibbing plant to<br />
wastewood firing.<br />
CONSULTING<br />
Market Street <strong>Energy</strong><br />
St. Paul, MN 55102-1611<br />
(651) 297-8955<br />
www.districtenergy.com<br />
Consulting unit of District <strong>Energy</strong> St. Paul. Did some<br />
conceptual engineering for Rock-Tenn project in<br />
St. Paul.<br />
CONSULTING<br />
RCM Digesters<br />
Berkeley, CA 94704<br />
(510) 834.4568<br />
www.rcmdigesters.com/<br />
Design and build anaerobic digesters for animal<br />
agriculture industry. Designed Haubenschild<br />
system near Princeton, MN.<br />
Page B-10<br />
Identifying Effective <strong>Biomass</strong> Strategies:<br />
Quantifying Minnesota’s Resources and Evaluating Future Opportunities
CONSULTING<br />
RW Beck<br />
St. Paul, MN 55121<br />
(651) 994-8415<br />
www.rwbeck.com/home.asp<br />
History of work in MN on analysis of waste streams.<br />
Nationally, have acted as owners engineer for<br />
numerous biomass projects<br />
CONSULTING<br />
Sebesta Blomberg<br />
Roseville, MN 55113-0020<br />
(651) 634-0775<br />
www.sebesta.com<br />
Engineering & environmental review expertise for<br />
bioenergy facilities. Involved in Little Falls ethanol<br />
plant gasifier.<br />
CONSULTING<br />
Tim Goodman and Associates<br />
St. Louis Park, MN 55426<br />
(952) 544-6005<br />
Waste and recycling consultant. Has completed<br />
analysis of waste wood industry in St.<br />
Paul/Minneapolis area.<br />
CONSULTING<br />
Utility Engineering<br />
Minneapolis, MN 55402<br />
(612) 215-1304<br />
www.ue-corp.com<br />
Power plant engineering, as well as fuels<br />
assessment work. Conducted a fuels assessment<br />
for a project in Minnesota.<br />
CONSULTING<br />
Wolf and Associates<br />
Elk River, MN 55330<br />
(763) 576-9040<br />
Design and build fuel handling systems. Built St.<br />
Paul District <strong>Energy</strong> fuel handling system.<br />
FINANCING<br />
AgStar Financial Services<br />
Rochester, MN 55901<br />
(507) 529-2049<br />
www.agstar.com<br />
Provide financing for anaerobic digester and wind<br />
projects. Financed Haubenschild project near<br />
Princeton, MN.<br />
FINANCING<br />
Cornerstone Partners<br />
Minneapolis, MN 55403<br />
(847) 601-3812<br />
www.cornerstonepartners.info<br />
Provide financial services to biomass and other<br />
power projects, including financial model<br />
development and equity and debt placement.<br />
FINANCING<br />
Minnesota Department of<br />
Agriculture<br />
St. Paul, MN<br />
(800) 967-2474<br />
www.mda.state.mn.us/<br />
Involved in promoting anaerobic digesters for the<br />
MN dairy industry, run loan program for digesters.<br />
Identifying Effective <strong>Biomass</strong> Strategies: Page B-11<br />
Quantifying Minnesota’s Resources and Evaluating Future Opportunities
FINANCING<br />
Northland Securities<br />
Minneapolis, MN 55402<br />
(612) 851-4952<br />
www.northlandsecurities.com<br />
Handle many financial services related to biomass<br />
projects, including project due dilligence, bond<br />
issuing, equity placement. Doing financing for<br />
Virginia/Hibbing biomass district heating plant.<br />
Clean <strong>Energy</strong> Resource Teams<br />
(CERTs)<br />
St. Paul, MN 55108<br />
(612) 624-2293<br />
www.cleanenergyresourceteams.<br />
org<br />
Working to create regional resources for clean<br />
energy and economic development for<br />
communities across the state. Website has case<br />
studies and resources for developing clean energy<br />
projects, including biomass.<br />
Fresh <strong>Energy</strong><br />
St. Paul, MN 55102<br />
(651) 225-0878<br />
www.fresh-energy.org<br />
Comprehensive list of state-level biomass policy<br />
measures/papers.<br />
Great Plains Institute for<br />
Sustainable Development (GPISD)<br />
Minneapolis, MN 55407<br />
612) 278-7150<br />
www.gpisd.net<br />
Work in Upper Midwest, researching energy crop<br />
production and utilization.<br />
Institute for Agriculture and Trade<br />
Policy (IATP)<br />
Minneapolis, MN 55404<br />
(612) 870-0453<br />
www.iatp.org<br />
Work on developing new, sustainable markets for<br />
family farmers and foresters, including bio-energy,<br />
wood waste, and energy crop utilization.<br />
Institute for Local Self-Reliance<br />
(ILSR)<br />
Minneapolis, MN 55414<br />
(612) 379-3815<br />
www.ilsr.org<br />
Comprehensive understanding of state/regional<br />
biomass and distributed generation policies/rules.<br />
Izaak Walton League of America,<br />
Midwest Office<br />
1619 Dayton Avenue, Suite 202<br />
St. Paul, MN 55104<br />
www.iwla.org<br />
State, regional, and national energy policy<br />
knowledge on renewable energy as well as other<br />
environmental concerns.<br />
NON-<br />
PROFIT/ADVOCACY<br />
NON-<br />
PROFIT/ADVOCACY<br />
NON-<br />
PROFIT/ADVOCACY<br />
NON-<br />
PROFIT/ADVOCACY<br />
NON-<br />
PROFIT/ADVOCACY<br />
NON-<br />
PROFIT/ADVOCACY<br />
NON-<br />
PROFIT/ADVOCACY<br />
The Green Institute<br />
Minneapolis, MN 55407<br />
(612) 278-7100<br />
www.greeninstitute.org<br />
Expertise in developing small wood combined<br />
heat and power projects.<br />
Page B-12<br />
Identifying Effective <strong>Biomass</strong> Strategies:<br />
Quantifying Minnesota’s Resources and Evaluating Future Opportunities
NON-<br />
PROFIT/ADVOCACY<br />
The Minnesota <strong>Project</strong><br />
St. Paul, MN 55104<br />
(651) 645-6159<br />
www.mnproject.org<br />
State level biomass policy knowledge,<br />
background developin anaerobic digesters, rural<br />
renewable energy projects.<br />
RESEARCH<br />
Agriculture Utilization and<br />
Research Institute<br />
Crookston, MN 56716-0599<br />
(800) 279-5010<br />
www.auri.org<br />
Conducting research on value-added products<br />
from agriculture, including pelletized fuel, energy<br />
crops, and community anaerobic digestors.<br />
Offices are in Crookston (headquarers), Marshall,<br />
and Waseca.<br />
RESEARCH<br />
AgSTAR<br />
Washington, DC 20460<br />
(202) 343-9041<br />
www.epa.gov/agstar/index.html<br />
Technical assistant program though the U.S.<br />
Environmental Protection Agency for anaerobic<br />
digester systems for animal agriculture.<br />
RESEARCH<br />
Department of <strong>Energy</strong> - <strong>Biomass</strong><br />
Division<br />
Washington, DC 20585<br />
www1.eere.energy.gov/biomass<br />
Expertise in small biomass, biorefinery technologies<br />
and applications.<br />
RESEARCH<br />
Electric Power Research Institute<br />
Palo Alto, CA 94304<br />
(650) 855-2000<br />
www.epri.com<br />
Funded by utilities, do research on biomass,<br />
among other issues. Involved in fuel cell<br />
application on Haubenshild Farms digester, near<br />
Princeton, MN.<br />
RESEARCH<br />
Initiative for Renewable <strong>Energy</strong><br />
and the Environment - University of<br />
Minnesota<br />
St. Paul, MN 55108<br />
(612) 624-7266<br />
www1.umn.edu/iree<br />
Provide financial and research support for<br />
renewable energy production across Minnesota.<br />
RESEARCH<br />
Minnesota Department of<br />
Commerce - State <strong>Energy</strong> Office<br />
St. Paul, MN 55101<br />
(651) 296-5175<br />
www.commerce.state.mn.us<br />
State planning studies on biogas and plant<br />
energy. Once on the website, do an internal<br />
search for "bioenergy" to access documents.<br />
RESEARCH<br />
National Renewable <strong>Energy</strong><br />
Laboratory<br />
Golden, CO 80401<br />
www.nrel.gov<br />
Expertise in national planning on bioenergy<br />
resources and applications.<br />
Identifying Effective <strong>Biomass</strong> Strategies: Page B-13<br />
Quantifying Minnesota’s Resources and Evaluating Future Opportunities
RESEARCH<br />
University of Minnesota, Dept. of<br />
Applied Economics<br />
St. Paul, MN 55108-6040<br />
(612) 625-1222<br />
www.apec.umn.edu<br />
Currently studies include: food marketing and<br />
consumption economics; economic<br />
development, trade and policy; production and<br />
managerial economics; resource and<br />
environmental economics; public sector<br />
economics; and agribusiness management.<br />
RESEARCH<br />
University of Minnesota, Dept. of<br />
Biosystems and Ag Engineering<br />
St. Paul, MN 55108<br />
(612) 625-4215<br />
www.bae.umn.edu<br />
Involved with researching and assessing<br />
anaerobic digester systems.<br />
RESEARCH<br />
University of North Dakota - <strong>Energy</strong><br />
& Environmental Research Center<br />
Grand Forks, ND 58202-9018<br />
(701) 777-5000<br />
www.eerc.und.nodak.edu<br />
Mapped biomass resources regionally, expertise in<br />
small biomass power system technologies and<br />
applications.<br />
RESEARCH<br />
West Central Research and<br />
Outreach Center<br />
Morris, MN 56267<br />
(320) 589-1711<br />
wcroc.coafes.umn.edu<br />
Developing a campus heating system fueled by<br />
biomass for U of M Morris as well as conducting<br />
other related research.<br />
TECHNOLOGY<br />
VENDOR<br />
<strong>Energy</strong> Products of Idaho<br />
Coeur d'Alene, ID 83815-8928<br />
(208) 765-1611<br />
www.energyproducts.com/<br />
Produce fluidized bed and gasifier biomass<br />
conversion technologies.<br />
TECHNOLOGY<br />
VENDOR<br />
FibroWatt<br />
Newtown, PA 19067<br />
(267) 352 0014<br />
www.fibrowattusa.com<br />
Building a turkey litter plant near Benson, MN.<br />
TECHNOLOGY<br />
VENDOR<br />
Foster Wheeler<br />
Clinton, NJ 08809-4000<br />
www.fwc.com<br />
Design and build biomass thermal and power<br />
plants. Built the U of M steam plant fluidized bed<br />
coal/biomass boiler.<br />
TECHNOLOGY<br />
VENDOR<br />
Home Farms Technologies<br />
Brandon, Manitoba R7A 5A3<br />
Canada<br />
(877) 464-7667<br />
www.homefarmstech.com<br />
Produce small scale biomass gasifiers. Working on<br />
several potential applications in Minnesota.<br />
TECHNOLOGY<br />
VENDOR<br />
Prime <strong>Energy</strong><br />
Tulsa, OK 74158<br />
(918) 835-1011<br />
www.primenergy.com<br />
Produce gasifier for thermal/power applications.<br />
Providing gasifier for Little Falls ethanol plant.<br />
Page B-14<br />
Identifying Effective <strong>Biomass</strong> Strategies:<br />
Quantifying Minnesota’s Resources and Evaluating Future Opportunities
TECHNOLOGY<br />
VENDOR<br />
Recovered <strong>Energy</strong> Resources<br />
Rochester, MI 48308<br />
(540) 675-2492<br />
www.recoveredenergyresources.c<br />
om<br />
Produce small scale biomass gasifiers. U of M<br />
Morris considering this technology.<br />
TRADE GROUP<br />
UTILITY<br />
UTILITY<br />
UTILITY<br />
Minnesota Milk Producers<br />
Waite Park, MN 56387<br />
(877) 577-0741<br />
www.mnmilk.org/<br />
Alliant <strong>Energy</strong><br />
Madison, WI 53707-1007<br />
(800) 255-4268<br />
www.alliantenergy.com<br />
Minnesota Power<br />
Duluth, MN 55802<br />
(218) 722-2641<br />
www.mnpower.com<br />
<strong>Xcel</strong> <strong>Energy</strong><br />
Minneapolis, MN 55401-1993<br />
(800) 328-8226<br />
www.xcelenergy.com<br />
Involved in promoting anaerobic digesters for the<br />
MN dairy industry.<br />
Has three anaerobic digesters (0.8 MWs). Also, the<br />
Chariton Valley <strong>Biomass</strong> <strong>Project</strong> (a cooperative<br />
effort with Chariton Valley Resource Conservation<br />
and Development, and the U.S. Dept. of <strong>Energy</strong>) is<br />
an initiative to develop switchgrass and other<br />
grasses<br />
Operates two biomass-fueled facilities: Rapids<br />
<strong>Energy</strong> Center at Grand Rapids and Hibbard<br />
<strong>Energy</strong> Center in Duluth that mainly consume<br />
production waste from adjacent paper mills and<br />
purchased wood. Both units also burn coal.<br />
<strong>Xcel</strong> <strong>Energy</strong> has contracted for the development<br />
of 110 megawatts of electricity generated by<br />
biomass-fueled technologies. Waste wood, fastgrowth<br />
poplar trees, and poultry litter will all be<br />
used as fuel to generate electricity.<br />
Identifying Effective <strong>Biomass</strong> Strategies: Page B-15<br />
Quantifying Minnesota’s Resources and Evaluating Future Opportunities
APPENDIX C : FEEDSTOCK CHARACTERISTICS<br />
<strong>Biomass</strong> Feedstock<br />
Sub-Division<br />
dry-weight<br />
HHV (Btu/lb)<br />
dry-weight<br />
HHV (kJ/g)<br />
<strong>Biomass</strong> Feedstock<br />
Sub-Division<br />
dry-weight<br />
HHV (Btu/lb)<br />
dry-weight<br />
HHV (kJ/g)<br />
Agricultural residues<br />
Alfalfa alfalfa 7,729 17.99<br />
Barley<br />
Beans<br />
grain<br />
dry beans<br />
8,063<br />
10,230<br />
18.77<br />
23.81<br />
straw<br />
straw<br />
7,600<br />
7,523<br />
17.69<br />
17.51<br />
canola 10,230 23.81<br />
Canola<br />
meal 8,934 20.80<br />
oil 17,370 40.43<br />
grain 8,100 18.86<br />
stover 8,191 19.07<br />
Corn<br />
cob 7,911 18.42<br />
sileage 8,145 18.96<br />
sweet corn grain 8,100 18.86<br />
Ethanol<br />
ethanol 13,103 30.50<br />
ethanol DDGS 9,422 21.93<br />
switch grass 7,936 18.47<br />
Grasslands<br />
prairie grass 7,000 16.29<br />
brushland 6,000 13.97<br />
Oats<br />
straw 8,242 19.19<br />
grain 8,063 18.77<br />
Potato potato 7,561 17.60<br />
grain 10,230 23.81<br />
Soybean<br />
hulls 7,570 17.62<br />
oil 16,883 39.30<br />
Sugarbeets<br />
sugarbeet 7,561 17.60<br />
sugarbeet pulp 7,345 17.10<br />
grain 10,230 23.81<br />
Sunflower<br />
straw 8,191 19.07<br />
hulls 9,654 22.47<br />
flour 6,444 15.00<br />
Wheat<br />
grain 8,063 18.77<br />
midds 8,415 19.59<br />
straw 7,375 17.17<br />
Miscellaneous<br />
sugar 7,561 17.60<br />
other hay 7,481 17.41<br />
Forest residues<br />
General<br />
Birch<br />
hardwood<br />
birch<br />
8,430<br />
8,650<br />
19.62<br />
20.14<br />
softwood<br />
birch and maple mix<br />
8,771<br />
8,453<br />
20.42<br />
19.68<br />
Cedar northern white cedar 8,400 19.55<br />
Cottonwood cottonwood/willow 8,436 19.64<br />
Fir douglas fir 9,043 21.05<br />
Hemlock western hemlock 8,613 20.05<br />
Maple maple 8,575 19.96<br />
Oak red oak 8,690 20.23<br />
Pine white pine 8,919 20.76<br />
Poplar<br />
aspen/poplar 8,914 20.75<br />
hybrid poplar 8,178 19.04<br />
Spruce spruce 8,759 20.39<br />
forest residue 8,669 20.18<br />
Miscellaneous<br />
land clearing wood 7,408 17.24<br />
peat 4,000 9.31<br />
Urban wood waste<br />
demolotion wood waste 7,916 18.43<br />
Wood<br />
urban wood waste 8,361 19.46<br />
Yard yard waste 7,009 16.32<br />
Mill Residue<br />
Bovine<br />
Poultry<br />
Swine<br />
Other<br />
Miscellaneous<br />
Mill residue<br />
aspen 8,501 19.79<br />
black liquor 5,880 13.69<br />
hardwood pellet 8,573 19.96<br />
hog fuel 7,681 17.88<br />
sawdust (red oak) 8,374 19.49<br />
wood sludge 2,000 4.66<br />
wood waste 8,658 20.15<br />
Animal waste<br />
beef cow-calf manure 6,757 15.73<br />
beef feeders manure 6,757 15.73<br />
dairy manure 6,757 15.73<br />
tallow 15,766 36.70<br />
broiler chicken manure and<br />
litter 6,225 14.49<br />
layer chicken manure 6,225 14.49<br />
turkey manure & litter 5,795 13.49<br />
feathermeal 16,900 39.34<br />
poultry fat<br />
15,766 36.70<br />
hog manure 8,235 19.17<br />
lard 15,766 36.70<br />
horse manure & litter 0 0.00<br />
sheep manure 6,757 15.73<br />
glycerol 15,036 35.00<br />
grease 16,900 39.34<br />
meat meal/tankage 16,900 39.34<br />
Municipal sewage<br />
Municipal sewage sludge waste 3,756 8.74<br />
Fossil Fuels<br />
Anthracite Coal 13,000 30.26<br />
Coal<br />
Bituminous Coal 12,000 27.93<br />
Lignite Coal 10,000 23.28<br />
Fuel Oil<br />
No. 2 19,400 45.16<br />
No. 6 18,600 43.30<br />
Natural Gas Natural Gas 23,100 53.77<br />
Identifying Effective <strong>Biomass</strong> Strategies: Page C-1<br />
Quantifying Minnesota’s Resources and Evaluating Future Opportunities
INTRODUCTION<br />
APPENDIX D : DATA SOURCES<br />
The following pages contain information on the resources and assumptions used to develop the<br />
default feedstock values used in BioPET. The first entry under “Price” for each of these feedstocks<br />
is often “Farm Gate”, “Local Elevator”, or “Plant Gate”. This is to indicate the location in the fuel<br />
supply chain where the price is set. Farm Gate prices signify that the feedstock is available at<br />
the given price at the farm of origin, often in a baled form. Local Elevator prices indicate that<br />
the given price is the price paid for the fuel delivered to a local grain elevator. Plant Gate<br />
prices are often noted in relation to crop processing residues. These prices are the price paid for<br />
the feedstock when it is picked up from the plant of origin.<br />
Some feedstocks have more detail than others based upon readily acceptable information.<br />
Other feedstocks were incorporated as placeholder for common applications, but collection of<br />
the data was outside the purview of this workscope. The original factory settings are provided as<br />
a starting point for scenario generation. The user should feel free to use their own data in any of<br />
these scenarios.<br />
For each major feedstock category a handful of sources provided values for each of the<br />
individual feedstocks. To simplify the appendix those major sources are noted at the beginning<br />
of each major feedstock category. Where a different source was used for a specific value it is<br />
noted separately, and the values that it supports are noted.<br />
CROP RESIDUES<br />
Major Sources<br />
• Material Characteristics<br />
o (Miles, et al., 1995)<br />
o (Bain, et al., 2003)<br />
o (AURI, n.d.)<br />
• Inventory/Availability<br />
o (NASS, 2006)<br />
• Prices<br />
o Farm Gate<br />
o (UMES, 2006)<br />
• Transport and Storage Costs<br />
o (Petrolia, 2005)<br />
o Re-bale Costs - (Antares Group Incorporated, 2002).<br />
o Cost of Holding in Storage ($/T/month) of stover, hay and straw cost was based<br />
on estimates in Sustainable <strong>Biomass</strong> <strong>Energy</strong> Production (Tiffany, 1995). Storage<br />
cost including losses was $6.84. Average storage time was 4 months.<br />
o<br />
o<br />
Rail hauling to storage plant($/T/mi) for large square bales is based on a gondola<br />
car with 28 bales and the Renville to Twin Cities grain hopper car rate of $445 a<br />
car.<br />
Rail hauling to storage plant($/T/mi) for large round bales is based on a gondola<br />
car with 18 bales and the Renville to Twin Cities grain hopper car rate of $445 a<br />
car.<br />
Identifying Effective <strong>Biomass</strong> Strategies: Page D-1<br />
Quantifying Minnesota’s Resources and Evaluating Future Opportunities
o<br />
o<br />
o<br />
o<br />
Barge hauling to storage plant ($/T/mi) for large square bales is based on a barge<br />
with 768 bales or 619 tons per barge and barge rate from Winona to the Twin<br />
Cities of $6400 per barge.<br />
Barge hauling to storage plant($/T/mi) for large round bales is based on a<br />
barge with 384 bales or 272 tons per barge and barge rate from Winona to the<br />
Twin Cities of $6400 per barge.<br />
Truck loading at storage ($/T) of bales includes labor costs of $1.125 per bale and<br />
loader costs of $1.152 per bale for a total of $2.277 per bale or $3.221 per ton.<br />
Rail and barge loading at storage ($/T) of bales includes labor costs of $1.375 per<br />
bale and loader costs of $1.152 per bale for a total of $2.527 per bale or $3.574<br />
per ton. Siding costs are not included. Rail takes 3 times as long to load because<br />
of the need to move bales longer distances and because loading can only be<br />
done from one side.<br />
o Truck unloading of bales at the plant ($/T) for trucks was assumed to take .5<br />
minutes per bale plus 20% overhead at a labor rate of $15 per hour for a cost of<br />
$.15 a bale. It was assumed that the capital cost of unloading equipment is<br />
included in plant costs.<br />
o Rail and barge unloading of bales at the plant ($/T) was assumed to take 1.5<br />
minutes per bale plus .1 minute overhead at a labor rate of $15 per hour for a<br />
cost of $.40 a bale. It was assumed that the capital cost of unloading<br />
equipment is included in plant costs.<br />
Feedstock Specific Assumptions<br />
Barley Straw<br />
• Inventory/Availability<br />
o Barley straw was assumed to be 90% of the as reported weight of barley grain.<br />
Barley straw was assumed to have 10% moisture and was converted to dry tons.<br />
Switchgrass/Other Hay<br />
• Inventory/Availability<br />
o Other hay as reported was assumed to have 12% moisture and was converted to<br />
dry tons.<br />
Wheat Straw<br />
• Inventory/Availability<br />
o Wheat straw was assumed to be 90% of the as reported weight of wheat grain.<br />
Wheat straw was assumed to have 16% moisture and was converted to dry tons.<br />
Corn Stover<br />
• Inventory/Availability<br />
o Dry corn stalk residue was estimated to be 85% of the computed weight of dry<br />
corn grain.<br />
Sunflower Stalks<br />
• Inventory/Availability<br />
o Sunflower stalks were assumed to be 90% of the as reported weight of sunflower<br />
seeds. Sunflower stalks were assumed to have 10% moisture and were converted<br />
to dry tons.<br />
Page D-2<br />
Identifying Effective <strong>Biomass</strong> Strategies:<br />
Quantifying Minnesota’s Resources and Evaluating Future Opportunities
Sweet Corn Stalks<br />
• Inventory/Availability<br />
o Sweet corn stalks were assumed to be 100% of the as reported weight of sweet<br />
corn and have 76% moisture and were converted to dry tons.<br />
CRP Grass 7<br />
• Inventory/Availability<br />
o (USDA, 2006)<br />
CROPS<br />
Major Sources<br />
• Material Characteristics<br />
o (AURI, n.d.)<br />
• Inventory/Availability<br />
o (NASS, 2006)<br />
• Prices<br />
o Local Elevator<br />
o This is assumed to include all costs required to deliver the feedstock to the plant<br />
or processing facility. Only storage, further processing and additional<br />
transportation costs should be added to estimate the final processed fuel costs.<br />
o 2004 marketing year average prices (Hartwig and Lofthus, 2005)<br />
• Transport and Storage Costs<br />
o Commodity transportation costs are estimated as $.157 per ton mile. This is based<br />
on the 25 mile rate estimate of the USDA Grain Transportation <strong>Report</strong> (GTR)<br />
estimate for the North Central region of the 1 st quarter of 2006.<br />
o Although not included in the Inputs worksheet the monthly cost of storing<br />
commodity grains is 1.5% of the crop’s value.<br />
o Rail hauling to storage plant ($/T/mi) for corn grain is based on the Renville to Twin<br />
Cities tariff for a shipment of 25 100 ton cars, a distance 110 miles.<br />
Alfalfa Hay<br />
o Truck, rail and barge loading at storage ($/T) of corn grain consists of a 3.5 cent a<br />
bushel elevation charge or $1.25 a ton.<br />
o Truck, rail and barge unloading of corn grain at the plant ($/T) is 1.5 cents per<br />
bushel or $.534 per ton.<br />
• Inventory/Availability<br />
o Alfalfa hay as reported was assumed to have 9.6% moisture and was converted<br />
to dry tons.<br />
7 The federal Conservation Reserve Program (CRP) pays landowners to temporarily (10 or 15 years) convert their<br />
cropland to permanent cover such as grassland or trees. These lands are not permitted to be harvested under current<br />
program rules, but they remain a potential source of biomass materials. We estimated the energy content of these lands<br />
by first aggregating all 25 official cover types (warm season grass, wetlands, wildlife plots, cool season grass, etc.) into<br />
three main categories: grass, trees, and other. We then applied a common yield estimate for each broad category. For<br />
grasses, we used 2.2 TAY, based on the research of Tilman, et al. 2001. For trees, we assumed 1 TAY, based on a lowyield<br />
estimate that we used in the forest softwood feedstock calculations noted above. The energy content of each<br />
broad category was calculated using the parameters reported in the previous phase of this project.<br />
Identifying Effective <strong>Biomass</strong> Strategies: Page D-3<br />
Quantifying Minnesota’s Resources and Evaluating Future Opportunities
• Prices<br />
o Farm Gate<br />
o (UMES, 2006)<br />
• Transport and Storage Costs<br />
o See explanation under crop residues.<br />
Barley Grain<br />
• Inventory/Availability<br />
o Barley grain was assumed to be reported in 48lb bushels of 14.5% moisture and<br />
converted to dry tons.<br />
Canola Grain<br />
• Inventory/Availability<br />
o Canola was reported in pounds with 13% moisture and converted to tons of dry<br />
matter. Canola straw was not included.<br />
Corn Grain<br />
• Inventory/Availability<br />
o Corn grain was assumed to be reported as 56lb. bushels with 15.5 % moisture.<br />
This was converted to tons of dry matter.<br />
Corn Sileage<br />
• Inventory/Availability<br />
o Corn silage as reported was assumed to be 70% moisture and converted to dry<br />
tons.<br />
• Prices<br />
o Farm Gate<br />
o (Shoemaker, 2003)<br />
Dry Bean Grain<br />
• Inventory/Availability<br />
o Dry edible beans were reported in pounds and assumed to have 10% moisture<br />
and were converted to dry tons. Dry edible bean straw was not included.<br />
Oat Grain<br />
• Inventory/Availability<br />
o Oat grain was assumed to be reported in 32lb bushels of 14% moisture and<br />
converted to dry tons.<br />
Potato<br />
• Inventory/Availability<br />
o Potato tubers in hundred weights of with 21.2% moisture and converted to tons of<br />
dry matter. Potato tops were not included.<br />
Soybean Grain<br />
• Inventory/Availability<br />
o Soybeans were assumed to be reported as 60lb. bushels of 13% moisture beans<br />
and converted to dry tons. Soybean straw was not estimated.<br />
Page D-4<br />
Identifying Effective <strong>Biomass</strong> Strategies:<br />
Quantifying Minnesota’s Resources and Evaluating Future Opportunities
Sugar Beets<br />
• Material Characteristics<br />
o (Duke, 1983)<br />
• Inventory/Availability<br />
o Sugar beet roots were reported in tons with 16.4% moisture and converted to tons<br />
of dry matter. Sugar beet tops were not included.<br />
Sunflower Grain<br />
• Inventory/Availability<br />
o Sunflower seeds, both oil and confectionary reported in hundred weights of 10%<br />
moisture and converted to dry tons.<br />
Sweet Corn Grain<br />
• Inventory/Availability<br />
o Sweet corn as reported was assumed to have 10.3% moisture. This was converted<br />
to dry tons.<br />
Wheat Grain<br />
• Inventory/Availability<br />
o Wheat grain was assumed to be reported in 60lb bushels of 13.5% moisture and<br />
converted to dry tons.<br />
CROP PROCESSING RESIDUES<br />
Major Sources<br />
• Material Characteristics<br />
o (AURI, n.d.)<br />
• Inventory/Availability<br />
o (Jordan and Taff, 2005)<br />
o (Grain and Milling Annual, 2005)<br />
• Prices<br />
o Plant Gate<br />
o (Schroeder, 2006)<br />
Ethanol DDGS<br />
• Material Characteristics<br />
o (Morey, et. al. 2005)<br />
• Inventory/Availability<br />
o DDGS production was estimated using a conversion rate of 18 lbs DDGS<br />
production per bushel of corn used at each plant. Corn inputs per plant were<br />
estimated as 0.4 bushels per gallon of ethanol produced at each plant.<br />
Ethanol Feed<br />
• Material Characteristics<br />
Glycerol from Biodeisel<br />
• Inventory/Availability<br />
Identifying Effective <strong>Biomass</strong> Strategies: Page D-5<br />
Quantifying Minnesota’s Resources and Evaluating Future Opportunities
o<br />
Glycerol production is assumed to be 0.2 pounds per gallon of produced<br />
biodiesel.<br />
Soybean Hulls<br />
• Inventory/Availability<br />
o Soybean hulls were assumed to constitute 6% of the weight of soybeans.<br />
Soybean hull production was estimated from the known capacity of soybean<br />
processing plants in MN.<br />
Soybean Meal<br />
• Inventory/Availability<br />
o Soybean meal was assumed to constitute 76% of the weight of soybeans.<br />
Soybean meal production was estimated from the known capacity of soybean<br />
processing plants in MN.<br />
Soybean Oil<br />
• Inventory/Availability<br />
o Soybean oil was assumed to constitute 18% of the weight of soybeans. Soybean<br />
oil production was estimated from the known capacity of soybean processing<br />
plants.<br />
Wheat Midds<br />
• Inventory/Availability<br />
o Wheat midds were assumed to compose 8.82 dry pounds per bushel of wheat.<br />
Wheat midd production was estimated from the known capacity of Minnesota’s<br />
flour mills.<br />
• Prices<br />
o Plant Gate<br />
o (UME, 2006)<br />
WOOD<br />
Major Sources<br />
• Material Characteristics<br />
o (Miles, et. al. 2006)<br />
• Inventory/Availability<br />
o (Miles, et. al. 2006)<br />
• Prices<br />
o Delivered Fuel Cost.<br />
o The prices used combine stumpage prices with estimated costs of timber harvest,<br />
assembly and shipping.<br />
o Stumpage Prices - (Kilgore and Blinn, 2003)<br />
Page D-6<br />
Identifying Effective <strong>Biomass</strong> Strategies:<br />
Quantifying Minnesota’s Resources and Evaluating Future Opportunities
Aspen 8<br />
• Material Characteristics<br />
o (Gaur and Reed, 1998)<br />
Brushland<br />
• Inventory/Availability<br />
o ("Brushland: Acres by County", 2000)<br />
CRP Trees 9<br />
• Inventory/Availability<br />
o (USDA, 2006)<br />
Urban Wood<br />
• Inventory/Availability<br />
o (Perlack, et. al., 2005)<br />
Mill Residues (Barks, Slabs, and Edgings)<br />
• Material Characteristics<br />
o Assumed to be the same as Logging Residues<br />
• Inventory/Availability<br />
o Inventory from primary sources<br />
o (Jacobson, 2007)<br />
Mill Residues (Sawdust)<br />
• Material Characteristics<br />
o Assumed to be the same as Logging Residues<br />
• Inventory/Availability<br />
o Inventory from primary sources<br />
o (Jacobson, 2007)<br />
MANURES<br />
Major Sources<br />
• Material Characteristics<br />
o (MWPS, 2004)<br />
• Inventory/Availability<br />
8 Minnesota forest production is estimated periodically (annually, starting in 2004) by the US Forest Service and reported<br />
in the Forest Inventory Analysis (FIA) database (U.S. Forest Service, n.d.). Data is reported for each tree species in each<br />
county, but these local estimated means are associated with extremely wide variance, made explicit by the Forest<br />
Service. After consulting with the maintainers of the FIA database, we decided to use for present purposes the county<br />
mean acreage for the three species groupings: softwoods, aspen, and hardwoods-not-aspen. These acreage numbers<br />
were used along with multi-county (we used the four Minnesota FS analysis region boundaries for this assignment) annual<br />
increment (“growing biomass”) estimates to calculate an annual green-tons growth estimate for the three groupings in<br />
each county. To convert these to dry tons per year, we used average moisture content estimates.<br />
9 Ibid.<br />
Identifying Effective <strong>Biomass</strong> Strategies: Page D-7<br />
Quantifying Minnesota’s Resources and Evaluating Future Opportunities
o<br />
Manure inventories are based on NASS county level livestock inventories. While<br />
these data are not complete, they allow for a rough estimate of actual animal<br />
populations and manure production using assumptions based on common<br />
industry practices.<br />
Hog Manure<br />
• Material Characteristics<br />
o (Jensen, Timpe, and Laumb, 2003)<br />
ANIMAL PROCESSING WASTES<br />
Major Sources<br />
• Material Characteristics<br />
o (Dozier, 2002)<br />
• Inventory/Availability<br />
o<br />
Rendered products were estimated through the use of USDA county level<br />
inventories of relevant livestock. From those inventories the USDA’s mortality ratio<br />
and the individual ratios of rendered products to the total production of rendered<br />
products were used to estimate the county level availability of each rendered<br />
product.<br />
• Prices<br />
o (UME, 2006)<br />
o (Schroeder, 2006)<br />
OTHER WASTE STREAMS<br />
Landfill Gas<br />
• Material Characteristics<br />
o (PCA, 2006)<br />
• Inventory/Availability<br />
o (PCA, 2006)<br />
Municipal Solid Waste (MSW)<br />
• Material Characteristics<br />
o (EIA 2007)<br />
o (Foth & Van Dyke and Associates, 2006)<br />
• Inventory/Availability<br />
o (PCA, 2006)<br />
o (Foth & Van Dyke and Associates, 2006)<br />
WWTP Sludge Waste<br />
• Material Characteristics<br />
o (Kokmen, 1999)<br />
• Inventory/Availability<br />
o (DuFresne, 2005)<br />
Page D-8<br />
Identifying Effective <strong>Biomass</strong> Strategies:<br />
Quantifying Minnesota’s Resources and Evaluating Future Opportunities
FOSSIL FUELS<br />
Minnesota Average Coal<br />
• Material Characteristics<br />
o<br />
• Prices<br />
o<br />
Coal (Bituminous)<br />
This figure was arrived at by calculating the weighted average of the BTU content<br />
of the coal used by one of Minnesota’s major investor owned utilities, <strong>Xcel</strong> <strong>Energy</strong>.<br />
The information used to arrive at this figure was found in <strong>Xcel</strong> <strong>Energy</strong>’s Application<br />
for Resource Plan Approval 2005 – 2019.<br />
http://tonto.eia.doe.gov/state/state_energy_profiles.cfmsid=MN<br />
• Material Characteristics<br />
o http://en.wikipedia.org/wiki/Bituminous_coal<br />
• Prices<br />
o http://www.eia.doe.gov/cneaf/coal/page/acr/table31.html<br />
Coal (Sub-Bituminous)<br />
• Material Characteristics<br />
o http://en.wikipedia.org/wiki/Sub-bituminous_coal<br />
• Prices<br />
o http://www.eia.doe.gov/cneaf/coal/page/acr/table31.html<br />
Coal (Lignite)<br />
• Material Characteristics<br />
o http://en.wikipedia.org/wiki/Lignite<br />
• Prices<br />
o http://www.eia.doe.gov/cneaf/coal/page/acr/table31.html<br />
Fuel Oil (No. 2)<br />
• Material Characteristics<br />
o http://www.eia.doe.gov/emeu/iea/tablec1.html<br />
• Prices<br />
o http://tonto.eia.doe.gov/dnav/pet/pet_pri_wfr_dcus_nus_w.htm<br />
Fuel Oil (No. 6)<br />
• Material Characteristics<br />
o http://www.eia.doe.gov/emeu/iea/tablec1.html<br />
• Prices<br />
o http://tonto.eia.doe.gov/dnav/pet/pet_pri_resid_dcu_SMN_m.htm<br />
Natural Gas<br />
• Material Characteristics<br />
o http://www.eia.doe.gov/emeu/aer/txt/ptb1304.html<br />
o http://en.wikipedia.org/wiki/Natural_gas<br />
• Prices<br />
o http://tonto.eia.doe.gov/dnav/ng/ng_pri_sum_dcu_nus_m.htm<br />
Identifying Effective <strong>Biomass</strong> Strategies: Page D-9<br />
Quantifying Minnesota’s Resources and Evaluating Future Opportunities
Propane<br />
• Material Characteristics<br />
o http://www.eia.doe.gov/emeu/iea/tablec1.html<br />
o http://en.wikipedia.org/wiki/Propane<br />
• Prices<br />
o http://tonto.eia.doe.gov/dnav/pet/pet_pri_wfr_dcus_nus_w.htm<br />
Page D-10<br />
Identifying Effective <strong>Biomass</strong> Strategies:<br />
Quantifying Minnesota’s Resources and Evaluating Future Opportunities