Exam topics for the oral examination - biostatistics (1st semester)
Exam topics for the oral examination - biostatistics (1st semester)
Exam topics for the oral examination - biostatistics (1st semester)

You also want an ePaper? Increase the reach of your titles
YUMPU automatically turns print PDFs into web optimized ePapers that Google loves.
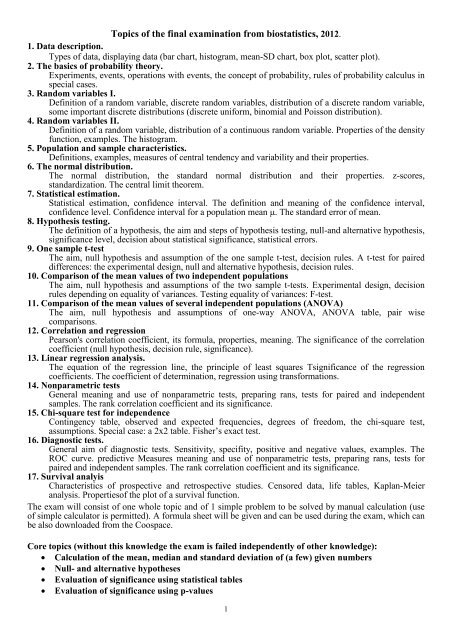
Topics of <strong>the</strong> final <strong>examination</strong> from <strong>biostatistics</strong>, 2012.<br />
1. Data description.<br />
Types of data, displaying data (bar chart, histogram, mean-SD chart, box plot, scatter plot).<br />
2. The basics of probability <strong>the</strong>ory.<br />
Experiments, events, operations with events, <strong>the</strong> concept of probability, rules of probability calculus in<br />
special cases.<br />
3. Random variables I.<br />
Definition of a random variable, discrete random variables, distribution of a discrete random variable,<br />
some important discrete distributions (discrete uni<strong>for</strong>m, binomial and Poisson distribution).<br />
4. Random variables II.<br />
Definition of a random variable, distribution of a continuous random variable. Properties of <strong>the</strong> density<br />
function, examples. The histogram.<br />
5. Population and sample characteristics.<br />
Definitions, examples, measures of central tendency and variability and <strong>the</strong>ir properties.<br />
6. The normal distribution.<br />
The normal distribution, <strong>the</strong> standard normal distribution and <strong>the</strong>ir properties. z-scores,<br />
standardization. The central limit <strong>the</strong>orem.<br />
7. Statistical estimation.<br />
Statistical estimation, confidence interval. The definition and meaning of <strong>the</strong> confidence interval,<br />
confidence level. Confidence interval <strong>for</strong> a population mean . The standard error of mean.<br />
8. Hypo<strong>the</strong>sis testing.<br />
The definition of a hypo<strong>the</strong>sis, <strong>the</strong> aim and steps of hypo<strong>the</strong>sis testing, null-and alternative hypo<strong>the</strong>sis,<br />
significance level, decision about statistical significance, statistical errors.<br />
9. One sample t-test<br />
The aim, null hypo<strong>the</strong>sis and assumption of <strong>the</strong> one sample t-test, decision rules. A t-test <strong>for</strong> paired<br />
differences: <strong>the</strong> experimental design, null and alternative hypo<strong>the</strong>sis, decision rules.<br />
10. Comparison of <strong>the</strong> mean values of two independent populations<br />
The aim, null hypo<strong>the</strong>sis and assumptions of <strong>the</strong> two sample t-tests. Experimental design, decision<br />
rules depending on equality of variances. Testing equality of variances: F-test.<br />
11. Comparison of <strong>the</strong> mean values of several independent populations (ANOVA)<br />
The aim, null hypo<strong>the</strong>sis and assumptions of one-way ANOVA, ANOVA table, pair wise<br />
comparisons.<br />
12. Correlation and regression<br />
Pearson's correlation coefficient, its <strong>for</strong>mula, properties, meaning. The significance of <strong>the</strong> correlation<br />
coefficient (null hypo<strong>the</strong>sis, decision rule, significance).<br />
13. Linear regression analysis.<br />
The equation of <strong>the</strong> regression line, <strong>the</strong> principle of least squares Tsignificance of <strong>the</strong> regression<br />
coefficients. The coefficient of determination, regression using trans<strong>for</strong>mations.<br />
14. Nonparametric tests<br />
General meaning and use of nonparametric tests, preparing rans, tests <strong>for</strong> paired and independent<br />
samples. The rank correlation coefficient and its significance.<br />
15. Chi-square test <strong>for</strong> independence<br />
Contingency table, observed and expected frequencies, degrees of freedom, <strong>the</strong> chi-square test,<br />
assumptions. Special case: a 2x2 table. Fisher’s exact test.<br />
16. Diagnostic tests.<br />
General aim of diagnostic tests. Sensitivity, specifity, positive and negative values, examples. The<br />
ROC curve. predictive Measures meaning and use of nonparametric tests, preparing rans, tests <strong>for</strong><br />
paired and independent samples. The rank correlation coefficient and its significance.<br />
17. Survival analyis<br />
Characteristics of prospective and retrospective studies. Censored data, life tables, Kaplan-Meier<br />
analysis. Propertiesof <strong>the</strong> plot of a survival function.<br />
The exam will consist of one whole topic and of 1 simple problem to be solved by manual calculation (use<br />
of simple calculator is permitted). A <strong>for</strong>mula sheet will be given and can be used during <strong>the</strong> exam, which can<br />
be also downloaded from <strong>the</strong> Coospace.<br />
Core <strong>topics</strong> (without this knowledge <strong>the</strong> exam is failed independently of o<strong>the</strong>r knowledge):<br />
Calculation of <strong>the</strong> mean, median and standard deviation of (a few) given numbers<br />
Null- and alternative hypo<strong>the</strong>ses<br />
Evaluation of significance using statistical tables<br />
Evaluation of significance using p-values<br />
1
Problems<br />
Probability<br />
1. If we roll a dice, <strong>the</strong>re are 6 possible outcomes. If X represents <strong>the</strong> value of <strong>the</strong> outcome, find <strong>the</strong><br />
following probabilities: a) P(X=1); b) P(X>1); c) P(1
t<br />
Ed<br />
aV<br />
JS<br />
tD<br />
decr<br />
Equal variances assumed<br />
Equal variances not<br />
assumed<br />
Independent Samples Test<br />
Levene's Test f or<br />
Equality of Variances<br />
t-test <strong>for</strong> Equality of Means<br />
95% Confidence<br />
Interv al of <strong>the</strong><br />
Mean Std. Error Dif f erence<br />
F Sig. t df Sig. (2-tailed) Dif f erence Dif f erence Lower Upper<br />
4.351 .051 1.634 19 .119 5.27273 3.22667 -1.48077 12.02622<br />
1.604 15.591 .129 5.27273 3.28782 -1.71204 12.25749<br />
Based on <strong>the</strong>se results, decide whe<strong>the</strong>r <strong>the</strong> treatment was effective or not. Explain your decision<br />
(=0.05).<br />
Name of <strong>the</strong> test………….<br />
Null hypo<strong>the</strong>sis………….. Alternative hypo<strong>the</strong>sis…………………..<br />
Assumptions……………..<br />
Result of <strong>the</strong> test<br />
Decision about <strong>the</strong> variances……………<br />
Test statistic, degrees of freedom, p-value………<br />
Decision……………..Interpretation………………….<br />
3. In a study examining eating habits of secondary school girls, <strong>the</strong> body weights were measured in two<br />
Hungarian cities, in Szeged and in Debrecen. The results are in <strong>the</strong> following table:<br />
The means were compared using two - sample t-test .<br />
What is <strong>the</strong> null hypo<strong>the</strong>sis of this test ....................................................................................<br />
.....................................................................................................................................................<br />
Find <strong>the</strong> difference in means: .....................................................<br />
The t-value was t=1.502.<br />
Find <strong>the</strong> value of degrees of freedom ...............................<br />
The p-value was p=0.136<br />
Is <strong>the</strong>re a significant difference between <strong>the</strong> two populations mean at 5% level. ....................<br />
Correlation<br />
1. Based on 5 pairs of data, The coefficient of correlation is r=0.7. Is this correlation significant at 5%<br />
level<br />
Null and alternative hypo<strong>the</strong>sis:………………….<br />
t-value of <strong>the</strong> correlation:......................... Degrees of freedom:...................................<br />
Decision (t-value in <strong>the</strong> table t 3,0.05 =3.182) …………………..<br />
Chi-square tests<br />
1. The following table shows <strong>the</strong> results of placebo and aspirin in an experiment, with <strong>the</strong> number of people<br />
in each treatment group who did and did not develop thromboses. Decide whe<strong>the</strong>r <strong>the</strong> aspirin had or<br />
had not effect on thrombus <strong>for</strong>mation.<br />
Developed thrombi Free of thrombi<br />
Placebo 10 5<br />
Aspirin 10 20<br />
Find <strong>the</strong> value of <strong>the</strong> test statistic, and give your conclusion. (alfa=0.05, 2 table =3.84)<br />
Nullhipo<strong>the</strong>sys ……………………Assumption ………………………………<br />
Test statistic: ……………………..<br />
Degrees os freedom: ……………………<br />
Decision about <strong>the</strong> significance: …………………..: ………………………..<br />
Interpretation: ………………….<br />
3
2. Two medicines are being compared regarding a particular side effect, 60 similar patients are split<br />
randomly into two groups, one on each drug. The results are presented in <strong>the</strong> following table:<br />
Side effects no side effects<br />
Drug A 10 20<br />
Drug B 5 25<br />
Are drug type and side effects independent Find <strong>the</strong> value of <strong>the</strong> test statistic, and give your conclusion.<br />
(alfa=0.05, 2 table =3.84)<br />
4