

A multi-locus time-calibrated phylogeny of the brown algae ...
A multi-locus time-calibrated phylogeny of the brown algae ...
A multi-locus time-calibrated phylogeny of the brown algae ...

Create successful ePaper yourself
Turn your PDF publications into a flip-book with our unique Google optimized e-Paper software.
668 T. Silberfeld et al. / Molecular Phylogenetics and Evolution 56 (2010) 659–674<br />
Table 3<br />
Bayesian posterior probability, mean age and 95% HPD interval for a selection <strong>of</strong> BACR<br />
nodes as displayed in Fig. 3.<br />
Node Description Posterior<br />
probability<br />
3.3. Time-<strong>calibrated</strong> phaeophycean <strong>phylogeny</strong><br />
The <strong>brown</strong> algal chronogram inferred from our data is presented<br />
in Fig. 2. For each labelled node, <strong>the</strong> inferred mean age<br />
and 95% highest density probability (95% HPD) intervals are provided<br />
in Table 3. As a consequence <strong>of</strong> <strong>the</strong> limited number <strong>of</strong> fossil<br />
constraints, most <strong>of</strong> which are fairly recent, <strong>the</strong> 95% HPD dramatically<br />
increase towards <strong>the</strong> root <strong>of</strong> <strong>the</strong> tree. However, when considering<br />
mean node ages, tentative conclusions about divergence<br />
<strong>time</strong>s <strong>of</strong> <strong>the</strong> internal branches <strong>of</strong> <strong>the</strong> BACR are possible.<br />
The first divergence <strong>of</strong> <strong>the</strong> <strong>brown</strong> algal crown radiation (node 1)<br />
would have occurred in <strong>the</strong> Lower Cretaceous (mean age 128.9 Ma)<br />
following a period <strong>of</strong> ca 50 Ma that did not produce any extant sister<br />
lineages to <strong>the</strong> BACR. From this point onwards, cladogenesis<br />
events seemingly occurred rapidly through <strong>time</strong>, with nodes 2–8<br />
spanning a period <strong>of</strong> no more than 20 Ma until <strong>the</strong> end <strong>of</strong> Lower<br />
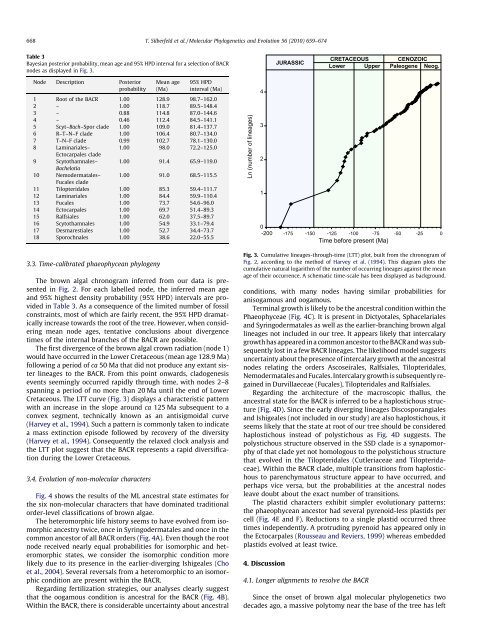
Cretaceous. The LTT curve (Fig. 3) displays a characteristic pattern<br />
with an increase in <strong>the</strong> slope around ca 125 Ma subsequent to a<br />
convex segment, technically known as an antisigmoidal curve<br />
(Harvey et al., 1994). Such a pattern is commonly taken to indicate<br />
a mass extinction episode followed by recovery <strong>of</strong> <strong>the</strong> diversity<br />
(Harvey et al., 1994). Consequently <strong>the</strong> relaxed clock analysis and<br />
<strong>the</strong> LTT plot suggest that <strong>the</strong> BACR represents a rapid diversification<br />
during <strong>the</strong> Lower Cretaceous.<br />
3.4. Evolution <strong>of</strong> non-molecular characters<br />
Mean age<br />
(Ma)<br />
95% HPD<br />
interval (Ma)<br />
1 Root <strong>of</strong> <strong>the</strong> BACR 1.00 128.9 98.7–162.0<br />
2 – 1.00 118.7 89.5–148.4<br />
3 – 0.88 114.8 87.0–144.6<br />
4 – 0.46 112.4 84.5–141.1<br />
5 Scyt–Bach–Spor clade 1.00 109.0 81.4–137.7<br />
6 R–T–N–F clade 1.00 106.4 80.7–134.0<br />
7 T–N–F clade 0.99 102.7 78.1–130.0<br />
8 Laminariales–<br />
Ectocarpales clade<br />
1.00 98.0 72.2–125.0<br />
9 Scytothamnales–<br />
Bachelotia<br />
1.00 91.4 65.9–119.0<br />
10 Nemodermatales–<br />
Fucales clade<br />
1.00 91.0 68.5–115.5<br />
11 Tilopteridales 1.00 85.3 59.4–111.7<br />
12 Laminariales 1.00 84.4 59.9–110.4<br />
13 Fucales 1.00 73.7 54.6–96.0<br />
14 Ectocarpales 1.00 69.7 51.4–89.3<br />
15 Ralfsiales 1.00 62.0 37.5–89.7<br />
16 Scytothamnales 1.00 54.9 33.1–79.4<br />
17 Desmarestiales 1.00 52.7 34.4–73.7<br />
18 Sporochnales 1.00 38.6 22.0–55.5<br />
Fig. 4 shows <strong>the</strong> results <strong>of</strong> <strong>the</strong> ML ancestral state estimates for<br />
<strong>the</strong> six non-molecular characters that have dominated traditional<br />
order-level classifications <strong>of</strong> <strong>brown</strong> <strong>algae</strong>.<br />
The heteromorphic life history seems to have evolved from isomorphic<br />
ancestry twice, once in Syringodermatales and once in <strong>the</strong><br />
common ancestor <strong>of</strong> all BACR orders (Fig. 4A). Even though <strong>the</strong> root<br />
node received nearly equal probabilities for isomorphic and heteromorphic<br />
states, we consider <strong>the</strong> isomorphic condition more<br />
likely due to its presence in <strong>the</strong> earlier-diverging Ishigeales (Cho<br />
et al., 2004). Several reversals from a heteromorphic to an isomorphic<br />
condition are present within <strong>the</strong> BACR.<br />
Regarding fertilization strategies, our analyses clearly suggest<br />
that <strong>the</strong> oogamous condition is ancestral for <strong>the</strong> BACR (Fig. 4B).<br />
Within <strong>the</strong> BACR, <strong>the</strong>re is considerable uncertainty about ancestral<br />
Ln (number <strong>of</strong> lineages)<br />
4<br />
3<br />
2<br />
1<br />
0<br />
-200<br />
conditions, with many nodes having similar probabilities for<br />
anisogamous and oogamous.<br />
Terminal growth is likely to be <strong>the</strong> ancestral condition within <strong>the</strong><br />
Phaeophyceae (Fig. 4C). It is present in Dictyotales, Sphacelariales<br />
and Syringodermatales as well as <strong>the</strong> earlier-branching <strong>brown</strong> algal<br />
lineages not included in our tree. It appears likely that intercalary<br />
growth has appeared in a common ancestor to <strong>the</strong> BACR and was subsequently<br />
lost in a few BACR lineages. The likelihood model suggests<br />
uncertainty about <strong>the</strong> presence <strong>of</strong> intercalary growth at <strong>the</strong> ancestral<br />
nodes relating <strong>the</strong> orders Ascoseirales, Ralfsiales, Tilopteridales,<br />
Nemodermatales and Fucales. Intercalary growth is subsequently regained<br />
in Durvillaeceae (Fucales), Tilopteridales and Ralfsiales.<br />
Regarding <strong>the</strong> architecture <strong>of</strong> <strong>the</strong> macroscopic thallus, <strong>the</strong><br />
ancestral state for <strong>the</strong> BACR is inferred to be a haplostichous structure<br />
(Fig. 4D). Since <strong>the</strong> early diverging lineages Discosporangiales<br />
and Ishigeales (not included in our study) are also haplostichous, it<br />
seems likely that <strong>the</strong> state at root <strong>of</strong> our tree should be considered<br />
haplostichous instead <strong>of</strong> polystichous as Fig. 4D suggests. The<br />
polystichous structure observed in <strong>the</strong> SSD clade is a synapomorphy<br />
<strong>of</strong> that clade yet not homologous to <strong>the</strong> polystichous structure<br />
that evolved in <strong>the</strong> Tilopteridales (Cutleriaceae and Tilopteridaceae).<br />
Within <strong>the</strong> BACR clade, <strong>multi</strong>ple transitions from haplostichous<br />
to parenchymatous structure appear to have occurred, and<br />
perhaps vice versa, but <strong>the</strong> probabilities at <strong>the</strong> ancestral nodes<br />
leave doubt about <strong>the</strong> exact number <strong>of</strong> transitions.<br />
The plastid characters exhibit simpler evolutionary patterns:<br />
<strong>the</strong> phaeophycean ancestor had several pyrenoid-less plastids per<br />
cell (Fig. 4E and F). Reductions to a single plastid occurred three<br />
<strong>time</strong>s independently. A protruding pyrenoid has appeared only in<br />
<strong>the</strong> Ectocarpales (Rousseau and Reviers, 1999) whereas embedded<br />
plastids evolved at least twice.<br />
4. Discussion<br />
JURASSIC<br />
-175<br />
CRETACEOUS<br />
Lower Upper<br />
-150 -125 -100 -75<br />
Time before present (Ma)<br />
4.1. Longer alignments to resolve <strong>the</strong> BACR<br />
CENOZOIC<br />
Paleogene Neog.<br />
Fig. 3. Cumulative lineages-through-<strong>time</strong> (LTT) plot, built from <strong>the</strong> chronogram <strong>of</strong><br />
Fig. 2, according to <strong>the</strong> method <strong>of</strong> Harvey et al. (1994). This diagram plots <strong>the</strong><br />
cumulative natural logarithm <strong>of</strong> <strong>the</strong> number <strong>of</strong> occurring lineages against <strong>the</strong> mean<br />
age <strong>of</strong> <strong>the</strong>ir occurrence. A schematic <strong>time</strong>-scale has been displayed as background.<br />
Since <strong>the</strong> onset <strong>of</strong> <strong>brown</strong> algal molecular phylogenetics two<br />
decades ago, a massive polytomy near <strong>the</strong> base <strong>of</strong> <strong>the</strong> tree has left<br />
-50<br />
-25<br />
0


