Econometrics I
Econometrics I
Econometrics I

Create successful ePaper yourself
Turn your PDF publications into a flip-book with our unique Google optimized e-Paper software.
<strong>Econometrics</strong> I<br />
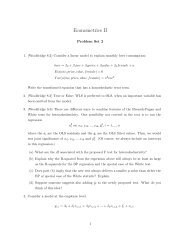
Problem Set 3<br />
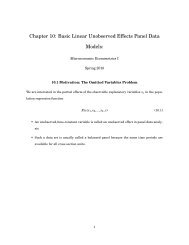
1. (Wooldridge 3.8) Which of the following can cause OLS estimators to be biased<br />
(a) Heteroskedasticity.<br />
(b) Omitting an important variable.<br />
(c) A sample correlation coefficient of .95 between two independent variables both included<br />
in the model.<br />
2. (Wooldridge 3.9) Suppose that you are interested in estimating the ceteris paribus relationship<br />
between y and x 1 . For this purpose, you can collect data on two control variables, x 2<br />
and x 3 . (For concreteness, you might think of y as final exam score, x 1 as class attendance,<br />
x 2 as GPA up through the previous semester, and x 1 as SAT or ACT score.) Let ˜β 1 be the<br />
simple regression estimate from y on x 1 and let ˆβ 1 be the multiple regression estimate from<br />
y on x 1 , x 2 , x 3 .<br />
(a) If x 1 is highly correlated with x 2 and x 3 in the sample, and x 2 and x 3 have large partial<br />
effects on y, would you expect ˜β 1 and ˆβ 1 to be similar or very different Explain.<br />
(b) If x 1 is almost uncorrelated with x 2 and x 3 , but x 2 and x 3 are highly correlated, will<br />
˜β 1 and ˆβ 1 tend to be similar or very different Explain.<br />
(c) If x 1 is highly correlated with x 2 and x 3 , and x 2 and x 3 have small partial effects on<br />
y, would you expect se( ˜β 1 ) or se( ˆβ 1 ) to be smaller Explain.<br />
(d) If x 1 is almost uncorrelated with x 2 and x 3 , x 2 and x 3 have large partial effects on y,<br />
and x 2 and x 3 are highly correlated, would you expect se( ˜β 1 ) or se( ˆβ 1 ) to be smaller<br />
Explain.<br />
3. (Wooldridge 4.1) Consider an equation to explain salaries of CEOs in terms of annual firm<br />
sales, return on equity (roe, in percent form), and return on the firms stock (ros, in percent<br />
1
form):<br />
log(salary) = β 0 + β 1 log(sales) + β 2 roe + β 3 ros + u<br />
(a) In terms of the model parameters, state the null hypothesis that, after controlling for<br />
sales and roe, ros has no effect on CEO salary. State the alternative that better stock<br />
market performance increases a CEOs salary.<br />
(b) Using the data in CEOSAL1.RAW, the following equation was obtained by OLS:<br />
̂ log(salary) = 4.32 + .280 log(sales) + .0174roe + .00024ros<br />
(.32) (.035) (.0041) (.00054)<br />
n = 209, R 2 = 0.283.<br />
By what percentage is salary predicted to increase if ros increases by 50 points Does<br />
ros have a practically large effect on salary<br />
(c) Test the null hypothesis that ros has no effect on salary against the alternative that<br />
ros has a positive effect. Carry out the test at the 10% significance level.<br />
(d) Would you include ros in a final model explaining CEO compensation in terms of firm<br />
performance Explain.<br />
4. Wooldridge C3.6<br />
2