Aegon Americas: Executing our strategy
Aegon Americas: Executing our strategy
Aegon Americas: Executing our strategy

Create successful ePaper yourself
Turn your PDF publications into a flip-book with our unique Google optimized e-Paper software.
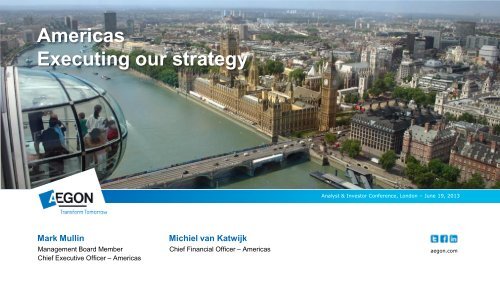
<strong>Americas</strong><br />
<strong>Executing</strong> <strong>our</strong> <strong>strategy</strong><br />
Analyst & Investor Conference, London – June 19, 2013<br />
Mark Mullin<br />
Management Board Member<br />
Chief Executive Officer – <strong>Americas</strong><br />
Michiel van Katwijk<br />
Chief Financial Officer – <strong>Americas</strong><br />
aegon.com
Key messages<br />
• Delivering on core business objectives<br />
►<br />
►<br />
►<br />
Catering to client needs through diverse product mix<br />
Successful expansion of distribution driving new business volumes<br />
Investing in product innovation to fuel future growth<br />
• Balanced risk profile<br />
►<br />
►<br />
Growth in fee-based businesses replaces decline in spread business<br />
Hedge programs in place to reduce capital volatility<br />
• Accelerating profitable growth<br />
►<br />
►<br />
Maintaining pricing discipline results in increasing profitability of new sales<br />
Outperforming the market in core areas, such as variable annuities and pensions<br />
2
Reflections on strategic transformation<br />
Phase 1: 2008 – 2010<br />
Decisions made to exit or<br />
de-emphasize part of earnings base<br />
• Wind down institutional spread business<br />
• Exited automotive credit market<br />
• Exited BOLI/COLI<br />
• Merged broker / dealers<br />
• De-emphasized fixed annuities<br />
• Closed Louisville location<br />
• Monumental Life securitization<br />
• Unhedged delta<br />
Phase 2: 2010 – 2011<br />
Rebasing and positioning<br />
for growth<br />
• Restructured 14 business units into three<br />
core businesses<br />
• New senior leadership team<br />
• Completed TARe divestiture<br />
• Executed FA co-insurance deals<br />
• Business model fee-based – capital light<br />
• Product design changes and repricing<br />
• Reduced exposure to US credit markets<br />
• 80% delta hedged<br />
• Repositioned and strengthened<br />
Transamerica brand<br />
Phase 3: 2012 and future<br />
Profitable, sustainable growth<br />
• Execution of <strong>Aegon</strong> <strong>strategy</strong><br />
• Customer centricity<br />
• Expanding distribution<br />
• Product innovation<br />
• Balanced risk profile<br />
• Profitable sales mix<br />
• Investing in and leveraging technology<br />
• Profitable, sustainable growth<br />
Ongoing commitment to <strong>strategy</strong> yields profitable, sustainable growth<br />
3
Significant opportunities for growth<br />
• 44% of American households have individual life insurance<br />
– a 50 year low<br />
• Half of American households say they need more life<br />
insurance<br />
• Personal responsibility and uncertainty of health insurance<br />
coverage is increasing<br />
Market outlook<br />
— Opportunities for future growth —<br />
• Growing and aging US population with increased need for<br />
accumulation and retirement products<br />
►<br />
►<br />
US population of 307 million<br />
78 million baby boomers heading to retirement<br />
• Market volatility increases probability of wealth destruction<br />
at the wrong time – retirement<br />
Transamerica’s competitive advantages<br />
Life and Health<br />
Protecting families and their dreams<br />
• Breadth of<br />
product offerings<br />
• Strong reputation, recognized<br />
for industry knowledge<br />
• Client service excellence<br />
• Brand recognition<br />
• Extensive distribution<br />
network<br />
• Market share position<br />
Investments and Retirement<br />
Serving individuals in accumulation<br />
to and through retirement<br />
• Leader in products<br />
and service innovation<br />
• Extensive risk management expertise<br />
• Use of technology to increase<br />
efficiencies and improve<br />
customer service<br />
4<br />
S<strong>our</strong>ce for market outlook: LIMRA
<strong>Executing</strong> <strong>our</strong> core growth <strong>strategy</strong> in Life and Health<br />
Growing through . . .<br />
• Broadening existing distribution<br />
• Adding new distribution, including direct<br />
• Introducing less capital<br />
intensive products<br />
• Diverse product mix<br />
• Maintaining pricing discipline<br />
for profitability<br />
• Investing in technology and innovation<br />
• Leveraging technology to<br />
increase efficiencies and improve<br />
customer service<br />
Strong and steady growth is key . . .<br />
US Industry Ranking - Transamerica<br />
2009 2010 2011 2012<br />
Individual life sales 9 6 8 5<br />
Voluntary permanent life<br />
sales<br />
7 7 5 4<br />
Voluntary health sales 7 5 5 5<br />
5<br />
Industry ranking s<strong>our</strong>ce: LIMRA
Growth driven by expanding distribution and product diversity<br />
Broadening existing distribution<br />
through diverse product mix<br />
• Launched universal life with secondary guarantee<br />
products in 1Q 13 with first-to-market, real time pricing<br />
• Increasing sales of supplemental health<br />
and specialty lines, such as Medical Supplement,<br />
Medicare Part D, student health and travel<br />
• Expanding product offerings in voluntary life<br />
and health at worksite<br />
Leveraging expertise in recruiting<br />
new distribution<br />
• ~ 25% of 1Q 13 Life & Protection sales<br />
gained through distribution added post 2008<br />
• ~ 20% increase in Life & Protection distribution<br />
through General Agencies and World Financial Group<br />
in 1Q 13 compared to 1Q 12<br />
Total sales*<br />
(USD million)<br />
1,340 1,394<br />
773 812<br />
1,573<br />
905<br />
567 582 668<br />
• Life<br />
• Accident and health<br />
+5%<br />
388 409<br />
231 264<br />
157 145<br />
2010 2011 2012 1Q 12 1Q 13<br />
Launched direct to consumer initiative<br />
• Directing consumers to digital platform and providing<br />
access to an agent via telephone, e-mail or click-to-chat<br />
• Providing on-line life insurance education, as well as<br />
product recommendations via a Personal Plan Builder<br />
Significant improvement in profitability of new business on a market consistent basis<br />
6<br />
* Life sales are standardized = recurring premium + 1/10 of single premium; health sales are not standardized
<strong>Executing</strong> <strong>our</strong> core growth <strong>strategy</strong> in Investments and Retirement<br />
Growing through . . .<br />
• Expanding distribution – new<br />
Growth in fee-based earnings to 30%**<br />
Variable annuity ranking progression (Morningstar)<br />
and existing<br />
• Increasing fee-based earnings<br />
• Expanding At & After Retirement<br />
products and services<br />
• Maintaining pricing discipline<br />
for profitability<br />
2008 2009 2010 2011 2012<br />
15 12 10 10 8<br />
Transamerica ranks #5 in VA sales through traditional channels (1Q13)<br />
• Investing in technology and innovation<br />
• Leveraging technology to<br />
increase efficiencies and improve<br />
Pension asset growth<br />
400%<br />
300%<br />
200%<br />
— Transamerica CAGR of 13.5%<br />
— Industry* CAGR of 4.3%<br />
312%<br />
customer service<br />
100%<br />
0%<br />
147%<br />
2003 2004 2005 2006 2007 2008 2009 2010 2011 2012*<br />
7<br />
* S<strong>our</strong>ce: pension industry data is an estimate based on Cerulli Quantitative Update 2012 – Private and Public DB/DC<br />
** Percentage based on underlying earnings for <strong>Aegon</strong> <strong>Americas</strong> in the first quarter 2013
Increasing market penetration in Individual Savings & Retirement<br />
Growth in fee-based business driven by:<br />
• Solutions focused, high caliber wholesaling force<br />
<br />
<br />
<br />
Leveraging targeted firms to expand production<br />
Utilizing Advisor Targeting System to increase productivity<br />
Continuing to expand diversity of client base in traditional channels<br />
• Partnering with large firms to provide VA solutions<br />
in both traditional and alternative channels<br />
Launched private label VA with Voya (ING U.S.) in May 2013,<br />
increasing number of private label partners to 8<br />
<br />
Recent launch of co-created, simplified VA product with select partners<br />
• Expanding value-added services to<br />
advisors/clients and increasing internal asset<br />
allocation competencies<br />
• Rounding out mutual fund platform, including<br />
launch of 13 new funds in the last 15 months<br />
<br />
<br />
<br />
5 consecutive quarters of positive net flows for funds<br />
~35% of 1Q 13 sales from funds launched in last 3 years<br />
43% of VA sales and 54% mutual fund sales to funds<br />
managed by <strong>Aegon</strong> Asset Management in 1Q 13<br />
8<br />
Variable annuity sales<br />
(USD billion)<br />
0.4<br />
0.4<br />
0.7 0.9<br />
2.9 3.4 4.6 4.5<br />
0.1<br />
0.2<br />
1.1 1.4<br />
2009 2010 2011 2012 1Q12 1Q13<br />
Traditional channels Alternative channels<br />
1.0%<br />
0.5%<br />
* Variable annuities margin adjusted for one-offs<br />
** 1Q 2013 earnings annualized<br />
VA balances and margin*<br />
(%, USD billion)<br />
38 42 43 48 51<br />
0.0%<br />
2009 2010 2011 2012 1Q13<br />
—— Margin (UEBT** / Assets) - - - Targeted margin<br />
Account balances<br />
(USD billion)<br />
10<br />
12 11<br />
13 14<br />
38 42 43 48 51<br />
2009 2010 2011 2012 1Q13<br />
Variable annuities Mutual funds
Continuing rapid growth in Employer Solutions & Pensions<br />
Growth in fee-based business driven by:<br />
• Expanding enhanced distribution <strong>strategy</strong> to maximize<br />
per firm market share with target firms<br />
<br />
<br />
Implementing with additional partners in emerging markets<br />
Introducing program to institutional markets<br />
• Promoting retirement readiness through social / digital channels<br />
<br />
<br />
<br />
Driving increased plan participant savings rates<br />
Increasing pension plan utilization of auto-enrollment<br />
and auto-escalation<br />
Assisting participants track financial progress to retirement<br />
via Retire OnTrack<br />
• Providing enhanced product and service offerings<br />
under one brand – Transamerica Retirement Solutions<br />
12<br />
20<br />
7<br />
6<br />
10<br />
% 48<br />
USD 3 billion<br />
11<br />
pension<br />
3<br />
sales 1Q13<br />
12<br />
%<br />
58<br />
13<br />
• Retirement advisors<br />
• Broker/dealer – wirehouses<br />
• Consultants<br />
• Participant Counseling Organization<br />
• Other<br />
• Corporate<br />
• Healthcare<br />
• Higher education<br />
• Government / charitable<br />
• Defined benefit<br />
• Multiple Employer Plan<br />
9<br />
Pension deposits<br />
(USD billion)<br />
6.2<br />
1Q 12<br />
11.4 16.3 16.5 19.0 5.8<br />
2009 2010 2011 2012 1Q 13<br />
Pensions balances and margin<br />
(%, USD billion)<br />
0.3%<br />
0.2%<br />
0.1%<br />
0.0%<br />
-0.1%<br />
59 77 83 99 106<br />
2009 2010 2011 2012 1Q13<br />
—— Margin (UEBT** / Assets) - - - Targeted margin<br />
SVS balances and margin<br />
(%, USD billion)<br />
61 59 60 61 61<br />
0.00%<br />
2009 2010 2011 2012 1Q13<br />
—— Margin (UEBT** / Assets) - - - Targeted margin<br />
* Industry ranking s<strong>our</strong>ce: Cerulli Associates; data for private Deferred Compensation plans ** 1Q 2013 earnings annualized<br />
0.25%<br />
0.13%
10 Yr US Treasury rates<br />
Growing value of new business through management action<br />
• Improving profitability and increasing<br />
value on a market consistent basis<br />
MCVNB by line of business<br />
(USD million)<br />
294<br />
<br />
<br />
Responsive to market conditions through<br />
product repricing, redesign, withdrawal,<br />
as well as introduction of new products<br />
Pricing discipline maintained – value<br />
over volume<br />
159<br />
236<br />
62<br />
125<br />
• Innovation led to significant<br />
improvements in MCVNB<br />
<br />
<br />
Variable annuities: speed to market<br />
repricing, first-to-market with tiered equity<br />
pricing by fund risk level and volatility<br />
adjusted funds<br />
Universal life with secondary guarantees:<br />
product withdrawals in 2012 with launch<br />
of new product with first-to-market,<br />
real-time pricing in 1Q 2013<br />
2010 2011 2012 1Q 2012 1Q 2013<br />
L&P IS&R - VA IS&R - MF IS&R - FA ES&P Other markets<br />
<strong>Americas</strong> MCVNB relative to 10-year US Treasury<br />
5<br />
2.5<br />
0<br />
-2.5<br />
1Q 2Q 3Q 4Q 1Q 2Q 3Q 4Q 1Q 2Q 3Q 4Q 1Q<br />
2010 2010<br />
2010<br />
2010 2010 2011 2011<br />
2011<br />
2011 2011 2012 2012<br />
2012<br />
2012 2012 2013<br />
2013<br />
140<br />
70<br />
0<br />
-70<br />
<strong>Aegon</strong> <strong>Americas</strong> MCVNB<br />
10
Managing capital across multiple frameworks<br />
• Capitalization level based on the most stringent of<br />
►<br />
►<br />
►<br />
Local regulatory requirements<br />
Rating agency requirements and / or<br />
Internal management criteria<br />
• Financial flexibility must be deemed strong under normal,<br />
adverse and extreme circumstances<br />
• Governance process over capital adequacy, capital<br />
efficiency and fungibility of capital in place at <strong>Americas</strong><br />
level with escalation thresholds to holding company<br />
United<br />
States<br />
RBC ratio<br />
~485%<br />
S&P ‘AA’<br />
excess capital<br />
+ USD ~900 million<br />
Stabilized capital volatility through extensive asset-liability management and hedging programs<br />
11<br />
Local solvency ratios per 1Q 2013<br />
= current binding constraint
Operational free cash flows fund dividends to the holding<br />
• Normalized operational free cash flows of approximately EUR 900 million or USD 1.2 billion<br />
• Operational free cash flows stable as run-off of capital-intensive spread business is replaced<br />
by growth of fee business<br />
• Distributions to holding company of approximately USD 650 million in first half of 2013<br />
Normalized operational free cash flows<br />
<strong>Aegon</strong> (EUR million)<br />
<strong>Americas</strong> ~900<br />
Netherlands ~250<br />
United Kingdom ~175<br />
New Markets ~50<br />
Total normalized operational free cash flow 1,375<br />
<strong>Aegon</strong> <strong>Americas</strong> (USD million)<br />
Earnings on in-force ~1,200<br />
Return on free surplus -<br />
Release of required surplus ~1,000<br />
Investments in new business ~(1,000)<br />
Total normalized operational free cash flow ~1,200<br />
12
Clear targets to support overall Group targets<br />
Achieve return on capital* of<br />
8.5%<br />
(8.2% geography adjusted**)<br />
by 2015<br />
Grow underlying earnings<br />
before tax by<br />
3-5%<br />
on average per annum<br />
between 2010 and 2015<br />
Double fee-based earnings to<br />
30-35%<br />
of underlying earnings<br />
by 2015<br />
Increase annual<br />
operational free cash flow by<br />
25%<br />
between 2010 and 2015<br />
13<br />
* Excludes leverage benefit at holding<br />
** Geography adjustments as disclosed in 1Q 2012
Getting closer to the people who depend on us<br />
Transforming transamerica.com into an integrated web, mobile and social experience<br />
Improving navigation across devices<br />
• Refreshing the digital customer experience to give customers<br />
what they want to see, hear, and learn from us<br />
Unifying customer service experience<br />
• Moving towards a single point of contact through phone, email and live<br />
chat enabling customers to use their preferred method of communication<br />
Personalizing experience and products<br />
• Using customer data to personalize customer experience resulting<br />
in brand loyalty and retention<br />
Increasing presence across social media channels<br />
• Strengthening connection with customers through engaging<br />
thought leadership across multiple social media channels<br />
®<br />
14
Summary<br />
• Delivering on core business objectives<br />
►<br />
►<br />
►<br />
Catering to client needs through diverse product mix<br />
Successful expansion of distribution driving new business volumes<br />
Investing in product innovation to fuel future growth<br />
• Balanced risk profile<br />
►<br />
►<br />
Growth in fee-based businesses replaces decline in spread business<br />
Hedge programs in place to reduce capital volatility<br />
• Accelerating profitable growth<br />
►<br />
►<br />
Maintaining pricing discipline results in increasing profitability of new sales<br />
Outperforming the market in core areas, such as variable annuities and pensions<br />
15
16<br />
Appendix
Life & Protection at a glance<br />
Business profile<br />
Diverse distribution with target market focus<br />
• Life, health and specialty products<br />
• Stable market with solid earnings growth<br />
• Top 10 player in individual life,<br />
supplemental health and voluntary worksite<br />
• High quality, low risk earnings<br />
• Lower capital markets leverage<br />
• Strong distributable earnings<br />
Affinity Markets<br />
Agency<br />
Brokerage<br />
Employee Benefits<br />
1Q 2013 L&P sales<br />
Life vs. Health*<br />
(USD million)<br />
1Q 2013 <strong>Aegon</strong> <strong>Americas</strong><br />
Inforce premium<br />
(USD billion)<br />
1Q 2013 <strong>Aegon</strong> <strong>Americas</strong><br />
Underlying earnings<br />
(USD million)<br />
• Life<br />
• Health<br />
69%<br />
31%<br />
• L&P<br />
• Other<br />
<strong>Americas</strong><br />
businesses<br />
including<br />
run-off<br />
38% 62%<br />
• L&P<br />
• Other<br />
<strong>Americas</strong><br />
businesses<br />
383 2.6 413<br />
61% 39%<br />
17<br />
* Life sales are standardized = recurring premium + 1/10 of single premium; health sales are not standardized
L&P – sustainable results driven by diverse distribution and product portfolio<br />
Affinity<br />
Analytics driven<br />
marketing<br />
Agency<br />
Close ties with distribution<br />
partners in underserved<br />
middle market<br />
Brokerage<br />
Independent distributors<br />
in middle and affluent<br />
market<br />
Worksite<br />
Accessing families<br />
at the workplace<br />
Distribution<br />
• Associations<br />
• Employers<br />
• Financial institutions<br />
• Retailers<br />
• Specialty (travel agencies,<br />
schools, etc.)<br />
• Career agencies<br />
• Marketing organizations<br />
• World Financial Group<br />
• Broker-dealers<br />
• Traditional general<br />
agencies<br />
• Independent marketing<br />
organizations<br />
• Independent brokers<br />
• Internet life insurance<br />
brokerage firms<br />
• Financial institutions<br />
• Agents and brokers<br />
• National employee benefit<br />
consultants<br />
Products<br />
• Term life<br />
• Supplemental health<br />
• Accidental death<br />
• Specialty (travel, student,<br />
membership)<br />
• Term life<br />
• Universal life<br />
• Variable and indexed<br />
universal life<br />
• Whole life<br />
• Term life<br />
• Universal life<br />
• Indexed universal life<br />
• Long term care<br />
• Supplemental health<br />
• Accident insurance<br />
• Universal life<br />
• Group term life insurance<br />
Competitive<br />
advantages<br />
• Market leader in the affinity<br />
space<br />
• Direct marketing skills and<br />
processes<br />
• Ability to tailor offerings and<br />
products<br />
• Breadth of product offerings<br />
• Brand loyalty/awareness<br />
• Recruiting expertise<br />
• Broad product portfolio<br />
• Lead generation capabilities<br />
from Affinity business<br />
• Close ties with distribution<br />
partners<br />
• Brand awareness<br />
• Integrated sales solutions<br />
• Large case underwriting<br />
and advanced marketing<br />
expertise<br />
• Innovative and marketresponsive<br />
products<br />
• Client service excellence<br />
through:<br />
Comprehensive product<br />
portfolio<br />
Concierge approach to<br />
large cases<br />
Proprietary online<br />
enrollment tool<br />
18
Employer Solutions & Pensions at a glance<br />
Business profile<br />
Industry validation<br />
• Comprehensive solutions for over 23,000<br />
American employers and 3.1 million plan participants<br />
• All pension markets covered: DB, DC, small<br />
to large, private and public, bundled and unbundled<br />
• Extensive product portfolio: Corporate, Not-for-<br />
Profit, Multiple Employer Plan, Retirement Plan<br />
Exchange, Third Party Administration<br />
• Insuring stable value investments for DC market<br />
• Some capital markets leverage (fee-based)<br />
Pension margin<br />
Fee revenue / AUM<br />
Operating expense / AUM<br />
Pre-tax underlying earnings / AUM<br />
Revenue-generating investments<br />
(USD billion)<br />
55 46<br />
59<br />
77 83<br />
99 106<br />
0.29% 0.26%<br />
0.13% 0.21% 0.22% 0.24% 0.24%<br />
2007 2008 2009 2010 2011 2012 1Q Q1 2013<br />
2015p<br />
50 60 61 59 60 61 61<br />
2007 2008 2009 2010 2011 2012 1Q 2013<br />
Retirement Solutions<br />
Stable Value Solutions<br />
19
ES&P – diverse business model designed for sustainable growth<br />
Retirement Solutions<br />
Serving 23,000 employers and 3.1 million individuals<br />
to and through retirement<br />
Stable Value Solutions<br />
Insuring stable value investments<br />
for America’s defined contribution market<br />
Products<br />
• Defined contribution plans<br />
• Defined benefit plans<br />
• Full service record keeping<br />
• Multiple employer plans<br />
• Retirement plan exchange<br />
• Not-for-profit solutions<br />
• Total Retirement Outs<strong>our</strong>cing (TRO)<br />
• Third Party Administrator (TPA)<br />
solutions<br />
• Non qualified defined<br />
contribution plans<br />
• Administrative Services<br />
Only (ASO)<br />
• Full service and<br />
brokerage Individual<br />
Retirement Account<br />
(IRA) capabilities<br />
• Synthetic Guaranteed Investment Contracts (GICs)<br />
► Individual plans<br />
► Pooled funds<br />
• Investment only contracts<br />
• Administrative Services Only (ASO)<br />
• Transamerica maintaining target notional balance<br />
of $58 - $60 billion<br />
Distribution<br />
• Wirehouses<br />
• Banks<br />
• Consultants<br />
• Retirement advisors<br />
• Third Party Administrators<br />
• 57 external wholesalers<br />
– Emerging Markets<br />
• 16 external wholesalers<br />
– Institutional Markets<br />
• Stable value investment managers<br />
• Dedicated client management team<br />
Competitive<br />
advantages<br />
• Extensive distribution network<br />
• Leader in products and service innovation<br />
• Industry leading operational platform<br />
• Award winning customer service<br />
• Among highest levels of customer loyalty<br />
• 191 field education specialists<br />
• #2 market share position<br />
• Industry leading operational platform<br />
and use of technology<br />
• Extensive risk management expertise<br />
• Strong reputation, recognized for industry knowledge<br />
20
Individual Savings & Retirement at a glance<br />
Business profile<br />
• Annuity and mutual fund products<br />
• Strong growth potential due to scale, diversity<br />
of distribution and technical requirements<br />
• Fee-based quality earnings<br />
• Some capital markets leverage post hedging<br />
IS&R underlying earnings mix shift<br />
from FA to VA and mutual funds<br />
100%<br />
80%<br />
60%<br />
40%<br />
20%<br />
0%<br />
2010 2011 2012 1Q 2013<br />
Retail mutual funds Variable annuities Fixed annuities<br />
Gross deposits FY 2008<br />
(USD billion)<br />
Gross deposits FY 2011<br />
(USD billion)<br />
Gross deposits FY 2012<br />
(USD billion)<br />
4%<br />
4%<br />
49% 12.1<br />
28%<br />
23%<br />
Growing fee business<br />
• Fixed annuities<br />
• Variable annuities<br />
• Retail mutual funds<br />
33%<br />
8.4<br />
63%<br />
38%<br />
9.2<br />
58%<br />
21
IS&R – positioned to capitalize on significant market opportunities<br />
Overview<br />
Annuities – variable and fixed<br />
Wealth accumulation, preservation and retirement income<br />
• Transamerica Capital Management (TCM)<br />
► Manufactures variable and fixed annuities<br />
► Distributes variable and fixed annuities<br />
• Variable annuities:<br />
► Dedicated wholesaling team<br />
► Fee-based earnings retain some capital markets leverage posthedging<br />
• Fixed annuities (business is de-emphasized):<br />
► Profitability managed over time through rate setting<br />
► Back book management through select reinsurance transactions<br />
Retail mutual funds<br />
Wealth accumulation and asset allocation<br />
• Transamerica Asset Management (TAM)<br />
► Investment advisor to all AEGON USA mutual funds<br />
► Manufactures mutual funds<br />
► Provides asset allocation<br />
► Offers a continuum of asset allocation<br />
and partner funds/asset management –<br />
effectively a ―manager of managers‖<br />
• Dedicated wholesaling team and award winning shareholder<br />
servicing<br />
• Fee-based earnings with low required capital<br />
Distribution<br />
Competitive<br />
advantages<br />
• Focused on third-party distribution (advisors)<br />
► Banks<br />
► Wires<br />
► Independent broker dealers<br />
• Adding new channels<br />
• Highly recognized brand – Transamerica<br />
• Distribution capabilities and execution<br />
• Customer service<br />
• Advanced Markets support for advisors on complex<br />
planning concepts and strategies<br />
• Advisor Targeting System (ATS)<br />
• Low maintenance costs<br />
• Innovative approach: speed to market, pricing discipline<br />
and back book management<br />
• Focused on third party distribution (advisors)<br />
► Banks<br />
► Wires<br />
► Independent broker dealers<br />
• Adding new channels<br />
• Open architecture - focus on ―Best in Class‖<br />
• Manager research and selection capabilities<br />
• Diversified channels with strong wholesaling distribution<br />
• Advisor Targeting System (ATS)<br />
• Highly recognized brands - Transamerica<br />
and Morningstar<br />
• Customer service focus - 10 consecutive<br />
DALBAR awards and 13 overall<br />
• Asset allocation capabilities<br />
22
Exposure to equity market performance in US business<br />
• On an economic basis, we have exposure to equity markets<br />
► Unhedged future fee income, primarily within <strong>our</strong> retirement and retail mutual fund businesses<br />
► Unhedged equity exposure from employee pension plans and alternative assets<br />
► However, equity exposure related variable annuity guarantees has been fully hedged<br />
– Pre-2003 GMIB products: macro equity hedge program<br />
– Post-2003 GMWB products: fully delta hedged at point of sale<br />
• Statutory capital is also exposed to equity markets, although less than on an economic basis<br />
► Statutory capital-at-risk is concentrated in variable annuity portfolios but also includes VULs and<br />
IULs<br />
► Present value of future fee income from VA’s is a component of statutory capital<br />
► Macro equity collar hedge in place to protect capital in extreme down equity market scenarios<br />
• Mismatch on an IFRS basis creates non-underlying earnings volatility<br />
► Hedge accounting not applicable for macro hedges<br />
► Equity hedging in place on an economic basis, which results in overhedging on an IFRS basis<br />
► Accounting and cash results converge over the life of the existing business<br />
23
Macro equity hedge program covering US GMIB equity exposure<br />
• GMIB equity guarantees have been hedged with a macro hedge program to protect capital<br />
►<br />
►<br />
Hedge program in place since 2009; hedging against multiple equity indices<br />
Equity return swapped into Libor rate<br />
• Underlying earnings assume 9% equity market return; hedges carried at Fair Value with results<br />
reflected in Fair Value Items (outside of underlying earnings)<br />
►<br />
Current low Libor rates result in expected quarterly loss of ~USD 70 million per quarter<br />
• Volatility around expected quarterly loss is the result of accounting mismatch as hedge accounting<br />
is not applicable<br />
►<br />
►<br />
►<br />
►<br />
GMIB liability carried at amortized cost (SOP 03-1); whereas, hedges are carried at fair value<br />
Higher equity markets leads to accelerated losses on hedges exceeding partial offset in liabilities, and vice versa<br />
Equity indices rose on average 10% during 1Q 2013 resulting in USD (147) million in fair value items<br />
Macro hedge results in line with expectations based on cumulative average since inception<br />
IFRS equity macro hedge results<br />
(USD million)<br />
40<br />
0<br />
(40)<br />
(80)<br />
(120)<br />
(160)<br />
1Q 10 2Q 10 3Q 10 4Q 10 1Q 11 2Q 11 3Q 11 4Q 11 1Q 12 2Q 12 3Q 12 4Q 12 1Q 13<br />
24<br />
Quarterly results macro hedge<br />
Cumulative average macro hedge results
S&P 500 Index<br />
One-year protection from equity collar macro hedge<br />
Strike zones for collar protection<br />
1900<br />
1800<br />
1700<br />
1600<br />
1500<br />
1400<br />
1300<br />
1200<br />
1100<br />
1000<br />
900<br />
— Collar protection sold —<br />
05/31/2013<br />
= 1631<br />
— Collar protection bought —<br />
4Q 2012 1Q 2013 2Q 2013 3Q 2013 4Q 2013<br />
— S&P 500 performance<br />
1810<br />
1520<br />
1270<br />
1090<br />
• Equity collar macro hedge added<br />
in 4Q 2012 to protect US statutory capital<br />
►<br />
►<br />
Present value of future fee income from<br />
VAs is a component of statutory capital<br />
Sold upside to pay for downside protection<br />
• The options are marked-to-market with quarterly<br />
changes reflected in fair value items<br />
• Additional estimated impact to fair value<br />
items through year-end when options<br />
mature under multiple scenarios:<br />
S&P 500<br />
movement*<br />
+20% USD (272)<br />
+10% USD (112)<br />
0% USD 18<br />
(10)% USD 128<br />
(20)% USD 143<br />
* From S&P level of 1569 at April 1, 2013<br />
Estimated impact to<br />
Fair Value Items (in millions)<br />
25
<strong>Aegon</strong> <strong>Americas</strong> – Investments general account<br />
(USD million)<br />
March 31,<br />
2013<br />
December 31,<br />
2012<br />
September 30,<br />
2012<br />
June 30,<br />
2012<br />
March 31,<br />
2012<br />
Cash / Treasuries / Agencies 19,965 22,503 22,610 22,153 20,115<br />
Investment grade corporates 50,435 50,019 50,711 49,865 49,937<br />
High yield (and other) corporates 3,152 3,276 3,319 3,140 2,995<br />
Emerging markets debt 2,094 2,089 2,054 1,986 1,992<br />
Commercial MBS 6,848 6,891 6,963 7,134 7,574<br />
Residential MBS 6,519 6,703 6,941 6,771 7,019<br />
Non-housing related ABS 4,064 3,932 4,090 4,568 4,757<br />
Subtotal 93,077 95,413 96,688 95,617 94,389<br />
Residential mortgage loans 41 44 46 47 48<br />
Commercial mortgage loans 8,778 8,970 9,412 9,678 10,324<br />
Total mortgages 8,819 9,014 9,458 9,725 10,372<br />
Convertibles & preferred stock 437 430 449 436 390<br />
Common equity & bond funds 1,627 1,542 1,495 1,409 1,488<br />
Private equity & hedge funds 1,786 1,847 1,853 1,878 1,893<br />
Total equity like 3,850 3,819 3,797 3,723 3,771<br />
Real estate 2,010 1,956 2,031 2,007 1,899<br />
Other 1,008 1,053 1,030 1,012 917<br />
Investments general account (excluding policy loans) 108,764 111,255 113,004 112,084 111,348<br />
Policyholder loans 2,714 2,733 2,755 2,755 2,769<br />
Investments general account 111,478 113,988 115,759 114,839 114,117<br />
26
Credit losses in the US trending down<br />
US credit losses in bps of fixed income assets<br />
120<br />
82<br />
91<br />
64<br />
44 44<br />
37<br />
27<br />
9<br />
25<br />
average of 32 bps<br />
since 1990<br />
8 17<br />
48<br />
17<br />
52<br />
33<br />
17<br />
1 2 4<br />
2<br />
1<br />
-6<br />
-2<br />
1990 1991 1992 1993 1994 1995 1996 1997 1998 1999 2000 2001 2002 2003 2004 2005 2006 2007 2008 2009 2010 2011 2012 1Q<br />
2013<br />
27<br />
Periods prior to 2005 are based on Dutch Accounting Principles (DAP)<br />
Periods 2005 and later are based on International Financial Reporting Standards (IFRS)
Thank you<br />
For questions please contact Investor Relations<br />
+31 70 344 8305<br />
ir@aegon.com<br />
P.O. Box 85<br />
2501 CB The Hague<br />
The Netherlands
Disclaimer<br />
Cautionary note regarding non-IFRS measures<br />
This document includes the non-IFRS financial measures: underlying earnings before tax, income tax, income before tax and market consistent value of new business. These non-IFRS measures are calculated by consolidating on a proportionate basis <strong>Aegon</strong>’s joint<br />
ventures and associated companies. The reconciliation of these measures, except for market consistent value of new business, to the most comparable IFRS measure is provided in note 3 "Segment information" of <strong>Aegon</strong>’s condensed consolidated interim financial<br />
statements. Market consistent value of new business is not based on IFRS, which are used to report <strong>Aegon</strong>’s primary financial statements and should not be viewed as a substitute for IFRS financial measures. <strong>Aegon</strong> may define and calculate market consistent<br />
value of new business differently than other companies. <strong>Aegon</strong> believes that its non-IFRS measures, together with the IFRS information, provide meaningful information about the underlying operating results of <strong>Aegon</strong>’s business including insight into the financial<br />
measures that senior management uses in managing the business.<br />
Local currencies and constant currency exchange rates<br />
This document contains certain information about <strong>Aegon</strong>’s results, financial condition and revenue generating investments presented in USD for the <strong>Americas</strong> and GBP for the United Kingdom, because those businesses operate and are managed primarily in those<br />
currencies. Certain comparative information presented on a constant currency basis eliminates the effects of changes in currency exchange rates. None of this information is a substitute for or superior to financial information about <strong>Aegon</strong> presented in EUR, which is<br />
the currency of <strong>Aegon</strong>’s primary financial statements.<br />
Forward-looking statements<br />
The statements contained in this document that are not historical facts are forward-looking statements as defined in the US Private Securities Litigation Reform Act of 1995. The following are words that identify such forward-looking statements: aim, believe, estimate,<br />
target, intend, may, expect, anticipate, predict, project, counting on, plan, continue, want, forecast, goal, should, would, is confident, will, and similar expressions as they relate to <strong>Aegon</strong>. These statements are not guarantees of future performance and involve risks,<br />
uncertainties and assumptions that are difficult to predict. <strong>Aegon</strong> undertakes no obligation to publicly update or revise any forward-looking statements. Readers are cautioned not to place undue reliance on these forward-looking statements, which merely reflect<br />
company expectations at the time of writing. Actual results may differ materially from expectations conveyed in forward-looking statements due to changes caused by various risks and uncertainties. Such risks and uncertainties include but are not limited to the<br />
following:<br />
• Changes in general economic conditions, particularly in the United States, the Netherlands and the United Kingdom;<br />
• Changes in the performance of financial markets, including emerging markets, such as with regard to:<br />
– The frequency and severity of defaults by issuers in <strong>Aegon</strong>’s fixed income investment portfolios;<br />
– The effects of corporate bankruptcies and/or accounting restatements on the financial markets and the resulting decline in the value of equity and debt securities <strong>Aegon</strong> holds; and<br />
– The effects of declining creditworthiness of certain private sector securities and the resulting decline in the value of sovereign exposure that <strong>Aegon</strong> holds;<br />
• Changes in the performance of <strong>Aegon</strong>’s investment portfolio and decline in ratings of <strong>Aegon</strong>’s counterparties;<br />
• Consequences of a potential (partial) break-up of the euro;<br />
• The frequency and severity of insured loss events;<br />
• Changes affecting mortality, morbidity, persistence and other factors that may impact the profitability of <strong>Aegon</strong>’s insurance products;<br />
• Reinsurers to whom <strong>Aegon</strong> has ceded significant underwriting risks may fail to meet their obligations;<br />
• Changes affecting interest rate levels and continuing low or rapidly changing interest rate levels;<br />
• Changes affecting currency exchange rates, in particular the EUR/USD and EUR/GBP exchange rates;<br />
• Changes in the availability of, and costs associated with, liquidity s<strong>our</strong>ces such as bank and capital markets funding, as well as conditions in the credit markets in general such as changes in borrower and counterparty creditworthiness;<br />
• Increasing levels of competition in the United States, the Netherlands, the United Kingdom and emerging markets;<br />
• Changes in laws and regulations, particularly those affecting <strong>Aegon</strong>’s operations, ability to hire and retain key personnel, the products <strong>Aegon</strong> sells, and the attractiveness of certain products to its consumers;<br />
• Regulatory changes relating to the insurance industry in the jurisdictions in which <strong>Aegon</strong> operates;<br />
• Changes in customer behavior and public opinion in general related to, among other things, the type of products also <strong>Aegon</strong> sells, including legal, regulatory or commercial necessity to meet changing customer expectations;<br />
• Acts of God, acts of terrorism, acts of war and pandemics;<br />
• Changes in the policies of central banks and/or governments;<br />
• Lowering of one or more of <strong>Aegon</strong>’s debt ratings issued by recognized rating organizations and the adverse impact such action may have on <strong>Aegon</strong>’s ability to raise capital and on its liquidity and financial condition;<br />
• Lowering of one or more of insurer financial strength ratings of <strong>Aegon</strong>’s insurance subsidiaries and the adverse impact such action may have on the premium writings, policy retention, profitability and liquidity of its insurance subsidiaries;<br />
• The effect of the European Union’s Solvency II requirements and other regulations in other jurisdictions affecting the capital <strong>Aegon</strong> is required to maintain;<br />
• Litigation or regulatory action that could require <strong>Aegon</strong> to pay significant damages or change the way <strong>Aegon</strong> does business;<br />
• As <strong>Aegon</strong>’s operations support complex transactions and are highly dependent on the proper functioning of information technology, a computer system failure or security breach may disrupt <strong>Aegon</strong>’s business, damage its reputation and adversely affect its<br />
results of operations, financial condition and cash flows;<br />
• Customer responsiveness to both new products and distribution channels;<br />
• Competitive, legal, regulatory, or tax changes that affect profitability, the distribution cost of or demand for <strong>Aegon</strong>’s products;<br />
• Changes in accounting regulations and policies may affect <strong>Aegon</strong>’s reported results and shareholders’ equity;<br />
• The impact of acquisitions and divestitures, restructurings, product withdrawals and other unusual items, including <strong>Aegon</strong>’s ability to integrate acquisitions and to obtain the anticipated results and synergies from acquisitions;<br />
• Catastrophic events, either manmade or by nature, could result in material losses and significantly interrupt <strong>Aegon</strong>’s business; and<br />
• <strong>Aegon</strong>’s failure to achieve anticipated levels of earnings or operational efficiencies as well as other cost saving initiatives.<br />
Further details of potential risks and uncertainties affecting <strong>Aegon</strong> are described in its filings with the Netherlands Authority for the Financial Markets and the US Securities and Exchange Commission, including the Annual Report. These forward-looking statements<br />
speak only as of the date of this document. Except as required by any applicable law or regulation, <strong>Aegon</strong> expressly disclaims any obligation or undertaking to release publicly any updates or revisions to any forward-looking statements contained herein to reflect any<br />
change in <strong>Aegon</strong>’s expectations with regard thereto or any change in events, conditions or circumstances on which any such statement is based.<br />
29