Annual Report 2008/2009 - Umalusi
Annual Report 2008/2009 - Umalusi
Annual Report 2008/2009 - Umalusi

Create successful ePaper yourself
Turn your PDF publications into a flip-book with our unique Google optimized e-Paper software.
Human Resources Management and Development<br />
Oversight <strong>Report</strong><br />
The statistics and information published in this part of the annual report are required in terms of Chapter 1, Part III<br />
J.3 of the Public Service Regulations, 2001 and have been prescribed by the Minister for the Public Services and<br />
Administration.<br />
Information on key human resources issues is provided in the statistical tables below. The information aims to<br />
empower legislators, the media, the public and other stakeholders to monitor whether public entities:<br />
• exercise the powers granted under Public Service and Public Finance legislation in a responsible manner, and<br />
• achieve national transformation priorities established by the Cabinet, (e.g. affirmative action).<br />
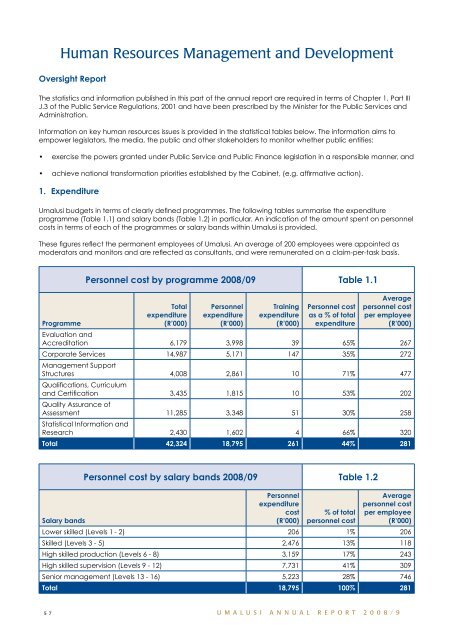
1. Expenditure<br />
<strong>Umalusi</strong> budgets in terms of clearly defined programmes. The following tables summarise the expenditure<br />
programme (Table 1.1) and salary bands (Table 1.2) in particular. An indication of the amount spent on personnel<br />
costs in terms of each of the programmes or salary bands within <strong>Umalusi</strong> is provided.<br />
These figures reflect the permanent employees of <strong>Umalusi</strong>. An average of 200 employees were appointed as<br />
moderators and monitors and are reflected as consultants, and were remunerated on a claim-per-task basis.<br />
Programme<br />
Personnel cost by programme <strong>2008</strong>/09 Table 1.1<br />
Total<br />
expenditure<br />
(R’000)<br />
Personnel<br />
expenditure<br />
(R’000)<br />
Training<br />
expenditure<br />
(R’000)<br />
Personnel cost<br />
as a % of total<br />
expenditure<br />
Average<br />
personnel cost<br />
per employee<br />
(R’000)<br />
Evaluation and<br />
Accreditation 6,179 3,998 39 65% 267<br />
Corporate Services 14,987 5,171 147 35% 272<br />
Management Support<br />
Structures 4,008 2,861 10 71% 477<br />
Qualifications, Curriculum<br />
and Certification 3,435 1,815 10 53% 202<br />
Quality Assurance of<br />
Assessment 11,285 3,348 51 30% 258<br />
Statistical Information and<br />
Research 2,430 1,602 4 66% 320<br />
Total 42,324 18,795 261 44% 281<br />
Personnel cost by salary bands <strong>2008</strong>/09 Table 1.2<br />
Salary bands<br />
Personnel<br />
expenditure<br />
cost<br />
(R’000)<br />
% of total<br />
personnel cost<br />
Average<br />
personnel cost<br />
per employee<br />
(R’000)<br />
Lower skilled (Levels 1 - 2) 206 1% 206<br />
Skilled (Levels 3 - 5) 2,476 13% 118<br />
High skilled production (Levels 6 - 8) 3,159 17% 243<br />
High skilled supervision (Levels 9 - 12) 7,731 41% 309<br />
Senior management (Levels 13 - 16) 5,223 28% 746<br />
Total 18,795 100% 281<br />
5 7 U M A L U S I A N N U A L R E P O R T 2 0 0 8 / 9