sample research paper - Stony Brook Astronomy
sample research paper - Stony Brook Astronomy
sample research paper - Stony Brook Astronomy

You also want an ePaper? Increase the reach of your titles
YUMPU automatically turns print PDFs into web optimized ePapers that Google loves.
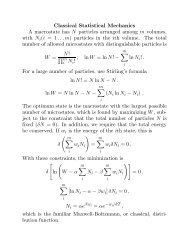
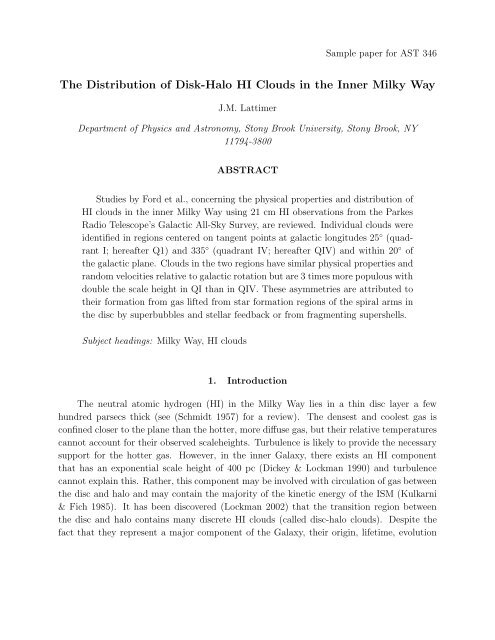
Sample <strong>paper</strong> for AST 346<br />
The Distribution of Disk-Halo HI Clouds in the Inner Milky Way<br />
J.M. Lattimer<br />
Department of Physics and <strong>Astronomy</strong>, <strong>Stony</strong> <strong>Brook</strong> University, <strong>Stony</strong> <strong>Brook</strong>, NY<br />
11794-3800<br />
ABSTRACT<br />
Studies by Ford et al., concerning the physical properties and distribution of<br />
HI clouds in the inner Milky Way using 21 cm HI observations from the Parkes<br />
Radio Telescope’s Galactic All-Sky Survey, are reviewed. Individual clouds were<br />
identified in regions centered on tangent points at galactic longitudes 25 ◦ (quadrant<br />
I; hereafter Q1) and 335 ◦ (quadrant IV; hereafter QIV) and within 20 ◦ of<br />
the galactic plane. Clouds in the two regions have similar physical properties and<br />
random velocities relative to galactic rotation but are 3 times more populous with<br />
double the scale height in QI than in QIV. These asymmetries are attributed to<br />
their formation from gas lifted from star formation regions of the spiral arms in<br />
the disc by superbubbles and stellar feedback or from fragmenting supershells.<br />
Subject headings: Milky Way, HI clouds<br />
1. Introduction<br />
The neutral atomic hydrogen (HI) in the Milky Way lies in a thin disc layer a few<br />
hundred parsecs thick (see (Schmidt 1957) for a review). The densest and coolest gas is<br />
confined closer to the plane than the hotter, more diffuse gas, but their relative temperatures<br />
cannot account for their observed scaleheights. Turbulence is likely to provide the necessary<br />
support for the hotter gas. However, in the inner Galaxy, there exists an HI component<br />
that has an exponential scale height of 400 pc (Dickey & Lockman 1990) and turbulence<br />
cannot explain this. Rather, this component may be involved with circulation of gas between<br />
the disc and halo and may contain the majority of the kinetic energy of the ISM (Kulkarni<br />
& Fich 1985). It has been discovered (Lockman 2002) that the transition region between<br />
the disc and halo contains many discrete HI clouds (called disc-halo clouds). Despite the<br />
fact that they represent a major component of the Galaxy, their origin, lifetime, evolution
– 2 –<br />
and connection with other interstellar components is unknown. A series of studies by Ford<br />
and collaborators (Ford et al. 2008, 2010) investigated the disc-halo cloud population. This<br />
review summarizes their findings and inferences.<br />
2. Identifying a Disc-Halo Cloud Population<br />
The data used by Ford et al. (2008, 2010) are from the Galactic All-Sky Survey (GASS),<br />
an H I survey of the entire southern sky with declination δ ≤ 1 ◦ made with the Parkes Radio<br />
Telescope (McClure-Griffiths et al. 2009). GASS is fully <strong>sample</strong>d at an angular resolution of<br />
16 ′ , and covers frequency channels corresponding to velocities relative to the local standard<br />
of rest (V LSR ) ranging from -400 km s −1 to +500 km s −1 at a channel spacing of 0.82 km s −1 .<br />
To define a <strong>sample</strong> of disc-halo clouds with well-determined properties, the study was limited<br />
to those clouds located near tangent points in the first (Galactic longitude l between 0 ◦ and<br />
90 ◦ ) and fourth (l between 270 ◦ and 0 ◦ ) Galactic quadrants. A tangent point is the location,<br />
for a given longitude −90 ◦ ≤ l ≤ 90 ◦ , where the largest velocity magnitude (the so-called<br />
terminal velocity V t (l)) occurs as the line of sight reaches the minimum distance from the<br />
Galactic center. For these Galactic longitudes, a right triangle exists with vertices at the<br />
Galactic center, the Sun and the tangent point, with a right angle at the tangent point. Ford<br />
et al. (2008) analyzed the HI disc-halo cloud population in the fourth Galactic quadrant of<br />
longitude (QIV) between 324.7 ◦ ≤ l ≤ 343.1 ◦ . Ford et al. (2010) analyzed the HI disc-halo<br />
cloud population in the first Galactic quadrant of longitude (QI) between 16.9 ◦ ≤ l ≤ 35.3 ◦ .<br />
These two regions are mirror-symmetric about the Sun-Galactic center line. Both <strong>sample</strong>s<br />
were restricted to Galactic latitude |b| ≤ 20 ◦ .<br />
In the absence of random motions, an object in pure Galactic rotation with V (R) at any<br />
tangent point has the maximum radial velocity magnitude V t (l) = V (R 0 sin l), and objects<br />
with lower radial velocity magnitudes lie either closer or farther from the Sun. But there<br />
are random motions, and it will be seen that the velocity dispersion is of order σ cc = 18 km<br />
s −1 . If this dispersion was instead interpreted solely as a distance effect, to 1σ this would<br />
be equivalent to choosing a cutoff velocity V c = 18 km s −1 smaller than V t (l). The velocity<br />
V t (l) − V c denotes two specific distances along a longitude line for objects in pure Galactic<br />
rotation, which gives a sense of how large a region is actually <strong>sample</strong>d. Note that the distance<br />
to the tangent point is d t (l, b) = R 0 cosl/ cosb, where R 0 = 8.5 kpc is the Galactrocentric<br />
distance. The approximate inner and outer sampling distances are found by assuming pure<br />
Galactic rotation and are given (in the Galactic plane) by<br />
√<br />
d ± (l) = d t (l) + R √<br />
0 2V (R)Vc<br />
V (R) − V c<br />
1 − V c<br />
2V (R) sin l ± . (1)
– 3 –<br />
Fig. 1.— A schematic view of the QI and QIV tangent point regions. The longitude boundaries<br />
are indicated by the dotted arrows. The locus of tangent points is represented by the<br />
dashed circle that connects the Sun and the Galactic center. The solid lines enclose the area<br />
around the tangent points bound by the longitude limits and a kinematic distance ±18 km<br />
s −1 away from V t assuming a flat rotation curve. It will be shown that most of the selected<br />
clouds lie within these regions. Figure is taken from Ford et al. (2008).<br />
If one uses the fact that V c /V (R)
– 4 –<br />
Fig. 2.— Left: Crosses indicate selected clouds in the QIV region, which satisfy V LSR ≤<br />
−V t (l) km s −1 . Open circles show other clouds. The solid line is the adopted terminal<br />
velocity V t (l) from H I and CO observations near the Galactic plane. Taken from Ford et<br />
al. (2008). Right: The selected clouds in the QI region, which satisfy V LSR ≥ V t (l) − 0.8 km<br />
s −1 . Taken from Ford et al. (2010).<br />
the maximum expected from Galactic rotation in that direction. Clouds with significantly<br />
negative V dev are likely located far from the tangen point, i.e., very close to or very far from<br />
the Sun, but those with positive V dev are likely located very close to the tangent points. The<br />
actual volume <strong>sample</strong>d will depend on σ cc , but as long as the longitude, latitude and velocity<br />
limits are reasonably small, V dev is a reasonable measure of the cloud velocity relative to pure<br />
Galactic rotation close to the tangent points. In practice, since the channel spacing is 0.8<br />
km s −1 , the tangent point <strong>sample</strong> was taken in QI to consist of those clouds along a line of<br />
sight with velocities V LSR ≥ V t − 0.8 km s −1 . In the QIV region, the selected clouds have<br />
velocities V LSR ≤ −V t . The clouds selected in QI and QIV are shown in Fig. 2.<br />
Terminal velocities V t (l, b = 0) were taken, for QIV, from McClure-Griffiths & Dickey<br />
(2007) and Luna et al. (2006), and, for QI, from McClure-Griffiths & Dickey (2011) and<br />
Clemens (1985), and are shown in Fig. 3. The fact that the number of clouds declines steeply<br />
for |V LSR | >> V t is consistent with the cloud populations being dominated by Galactic<br />
rotation.<br />
The procedures used to detect and measure clouds are summarized in Ford et al. (2008,<br />
2010). The individual cloud properties, such as velocities, radii, and masses, can first be<br />
determined assuming they all are located at tangent points, meaning V dev can be determined<br />
for each. Errors are assigned based on estimated errors in V t . A simulated cloud population
– 5 –<br />
Fig. 3.— Adopted terminal velocity curves. For QIV, V t is from HI data of McClure-Griffiths<br />
& Dickey (2007) and, for l ≥ 339 ◦ .7, from Luna et al. (2006). For QI, V t is from HI data of<br />
McClure-Griffiths & Dickey (2011) and, for l < 19 ◦ , from CO observations (Clemens 1985).<br />
was derived from the assumptions of a flat rotation curve and co-rotation (i.e., there is no z<br />
dependence), and a random line of sight component drawn from a Gaussian with a disperson<br />
σ cc . Due to the non-zero velocity dispersion of the clouds, other fundamental characteristics<br />
such as their distances and scale heights can only be estimated by also assuming a random<br />
population of clouds as a function of R (Galactic radial distance) and z (Galactic azimuthal<br />
distance) to represent the observed populations. Quite a large volume of the Galxy has<br />
to be simulated to include all clouds likely to end up with observed velocities. Consider<br />
the clouds within a small volume at a tangent point. This ensemble has a mean velocity<br />
< V LSR >= V t , but half of them have V LSR > V t . Moving closer than the tangent point, one<br />
finds < V LSR >< V t but a considerable fraction still have V LSR > V t . The assumed cloud<br />
distribution in cylindrical coordinates (R, z) was taken to be<br />
n(R, z) = Σ(R) exp(−|z|/h), (3)<br />
where Σ(R) is the surface density and h is the exponential scale height. The surface density<br />
was taken to be binned in zones of spacing 0.25 kpc from 2.5 to 6.5 kpc. K-S tests were used<br />
to maximize the quality of fits to determine the parameters h, σ cc and Σ(R). Details and<br />
the determination of errors are discussed in Ford et al. (2008, 2010).
– 6 –<br />
3. Comparison of the Properties of the Disc-Halo Clouds<br />
81 clouds were detected at the tangent points for QIV and 255 for QI. The best-fit<br />
velocity dispersions were σ cc = 14.5 ± 2 km s −1 for QI and σ cc = 18 ± 2 km s −1 . The surface<br />
density Σ(R) was consistent with a uniform distribution for the QI <strong>sample</strong>, but was more<br />
consistent with a somewhat concentrated distribution around Galactic radii of R ∼ 3−4 kpc<br />
in the QIV <strong>sample</strong>. The vertical distributions were best fit by a scale height h = 800 ± 100<br />
pc for the QI <strong>sample</strong> and h = 400 ± 100 pc for the QIV <strong>sample</strong>. The internal velocity<br />
dispersions within clouds was about ∆v = 10.5 km s −1 for QI and ∆v = 12.8 km s −1 for<br />
QIV. The distributions of cloud radii and masses were roughly the same for the two <strong>sample</strong>s.<br />
The median radius is about 28 pc (with a nominal spread of ±10 pc) and mass in H I is 700<br />
M ⊙ (with a nominal spread of .5 in log M).<br />
Using the value V c ≃ σ cc ≃ 18 km s −1 , the tangent point regions are shown overlaid<br />
on an artist’s conception of the Milky Way (NASA/JPL-Caltech/R. Hurt (SSC-Caltech), as<br />
reproduced in Ford et al. (2010)), as derived from the Galactic Legacy Infrared Mid-Plane<br />
Survey Extraordinare (GLIMPSE) using the Spitzer Space Telescope (Benjamin et al. 2003).<br />
The two regions studied, though selected to be symmetric with respect to the Sun-Galactic<br />
center line, <strong>sample</strong> two very different parts of the Galaxy. The QI area covers the near tip<br />
of the Galactic bar where a major spiral arm originates, while the QIV area contains only a<br />
minor arm.<br />
4. Origin of the Observed Asymmetries<br />
The individual clouds have very similar physical properties, but the cloud populations<br />
have three major asymmetries. There are 3 times as many clouds in the QI <strong>sample</strong> as in<br />
the QIV <strong>sample</strong>, the QI <strong>sample</strong> has twice the scale height of the QIV <strong>sample</strong>, and the radial<br />
velocity dispersions are dissimilar. The fact that the QI <strong>sample</strong> is located in a region near the<br />
tip of the Galactic bar where a major spiral arm is located, while the QIV <strong>sample</strong> contains<br />
only a minor arm, probably accounts for these asymmetries. The sparseness of the QIV<br />
region compared to the QI region accounts for the relative numbers of clouds as the clouds<br />
mirror the spiral structure. The concentration of clouds near 4 kpc in QIV seems to be<br />
connected to a weak spiral feature, the Norma spiral arm. On the other hand, the more<br />
nearly uniform radial distribution of clouds in QI is accounted for by the richer portion of<br />
the Galaxy where the near end of the Galactic bar merges with the beginning of the major<br />
Scutum-Centaurus arm. This suggests an intimate relation between the clouds and the spiral<br />
features, including star formation. The origin of the scale height differences, however, are<br />
not as clear, but could be connected to the relative star formation rates. Ford et al. (2010)
– 7 –<br />
Fig. 4.— Artist’s conception of the Milky Way as derived from GLIMPSE survey infrared<br />
data, taken from Ford et al. (2010). The longitude boundaries of the QI and QIV regions<br />
are the dotted arrows while the locus of tangent points is represented by the dashed circle.<br />
The solid lines enclose the area around the tangent points bound by the longitude limits and<br />
a kinematic distance ±18 km s −1 away from V t assuming a flat rotation curve. The artist’s<br />
conception image is from NASA/JPL-Caltech/R. Hurt (SSC-Caltech).<br />
argues that the observed differences in numbers of clouds or scale heights are not due to<br />
kinematic selection effects.<br />
5. Inferences and Conclusions<br />
The physical properties of the clouds in the two <strong>sample</strong>s are similar, suggesting they<br />
belong to the same population with similar origins and evolutionary histories. If the clouds<br />
evolved in the Galactic potential without disruption, the random motions implied by σ cc =<br />
16 − 18 km s −1 would suggest a scale height of only 90 pc (Ford et al. 2008), which is<br />
inconsistent with the observations. If these clouds were self-gravitationg, they would have
– 8 –<br />
to have a mass of order r∆v 2 /G where r is their radii, but this mass is several orders of<br />
magnitude larger than observed. These results indicate the clouds are not an equilibrium<br />
population. The clouds must be either pressure-confined or transitory. In the absence of<br />
pressure information, it is unknown if they are pressure-confined. Unless there is some<br />
sort of confinement, however, their lifetimes must be significantly less than their thermal<br />
evaporation timescale, about 100 Myr (Stanimirović et al. 2006), or their internal dynamical<br />
timescale, r/∆v ∼ 3 Myr.<br />
The standard explanation for the existence of disc-halo clouds is that they are formed<br />
by the cooling and condensing of hot gas that has been expelled from the disc which then<br />
falls back to the plane (Shapiro & Field 1976; Bregman 1980). However, the hot gas is<br />
expected to be fairly uniform in the halo so this model cannot account for the observed<br />
QI-QIV asymmetries.<br />
Ford et al. (2010) instead proposes that the disc-halo clouds are related to areas of<br />
star formation and result from stellar feedback and superbubbles that have swept gas into<br />
the halo. The clouds are formed in the lower halo. The scale height differences could<br />
be accounted for by the greater star formation rate and number of superbubbles in QI as<br />
compared with QIV. But the time delay between the specific events producting superbubbles<br />
and cloud formation means that there should be no direct correlation with other detailes of<br />
star formation in the disc, as observed.<br />
The sheer number of clouds detected means that these clouds are a major component<br />
of the Galaxy. Their concentration toward the Galactic plane and tight coupling to Galactic<br />
rotation and spiral structure preclude the possibility that they are created through tidal<br />
stripping of satellite dwarf galaxies or infalling primordial gas. These clouds play an important<br />
role in Galaxy evolution and the exchange of gas between the disc and halo. They are<br />
likely common in external galaxies but will be extremely difficult to detect there for many<br />
years.<br />
REFERENCES<br />
Benjamin, R. A. et al. 2003, PASP 115, 953.<br />
Bregman, J. N. 1980, ApJ 236, 577.<br />
Clemens, D. P. 1985, ApJ 295, 422.<br />
Dickey, J. M. & Lockman, F. J. 1990, ARA& A 28, 215.
– 9 –<br />
Ford, H. A., McClure-Griffiths, N. M., Lockman, F. J., Bailin, J., Calabretta, M. R.,<br />
Kalberla, P. M. W., Murphy, T. Pisano, D. J. 2008, ApJ 688, 290.<br />
Ford, H. A., Lockman, F. J. & McClure-Griffiths, N. M. 2010, ApJ 722, 367.<br />
Kulkarni, S. R. & Fich, M. 1985, ApJ 289, 792.<br />
Lockman, F. J. 2002, ApJ 580, L47.<br />
Luna, A., Bronfman, L., Carrasco, L. & May, J. 2006, ApJ 641, 938.<br />
McClure-Griffiths, N. M. & Dickey, J. M. 2007, ApJ 627, 471.<br />
McClure-Griffiths, N. M. et al. 2009, ApJS 181, 398.<br />
McClure-Griffiths, N. M. & Dickey, J. M. 2011, in preparation.<br />
Schmidt, M. 1957, Bull. Astron. inst. Netherlands 13, 247.<br />
Shapiro, P. R. & Field, G. B. 1976, ApJ 205, 762.<br />
Stanimirović, S. et al. 2006, ApJ 653, 1210.<br />
This preprint was prepared with the AAS L A TEX macros v5.2.