AUTOMATED BEARING WEAR DETECTION Alan Friedman DLI ...
AUTOMATED BEARING WEAR DETECTION Alan Friedman DLI ...
AUTOMATED BEARING WEAR DETECTION Alan Friedman DLI ...

You also want an ePaper? Increase the reach of your titles
YUMPU automatically turns print PDFs into web optimized ePapers that Google loves.
motor, the recommendation might say “Overhaul Motor” instead of directing the user to balance, align,<br />
replace bearings and check windings.<br />
There are 4 levels of recommendation priorities each relating to different suggested actions. These are “No<br />
Recommendation”, “Desirable”, “Important” and “Mandatory”. These coincide loosely with four levels of<br />
fault severities (H): “Slight”, Moderate”, “Serious”, and “Extreme”. Thus, a “slight motor bearing wear”<br />
fault might result in “No Recommendation” and a “Moderate Motor Bearing Wear” fault might result in<br />
“Desirable: Monitor Motor Bearings for Increased Vibration”. More information on how the severity levels<br />
relate to recommended repair actions can be obtained from <strong>DLI</strong>.<br />
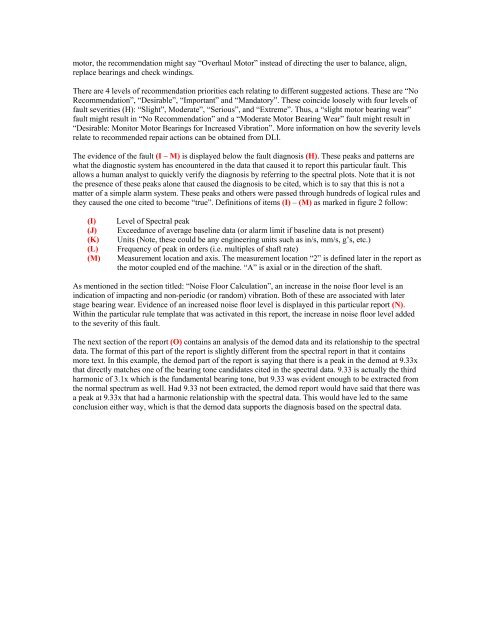
The evidence of the fault (I – M) is displayed below the fault diagnosis (H). These peaks and patterns are<br />
what the diagnostic system has encountered in the data that caused it to report this particular fault. This<br />
allows a human analyst to quickly verify the diagnosis by referring to the spectral plots. Note that it is not<br />
the presence of these peaks alone that caused the diagnosis to be cited, which is to say that this is not a<br />
matter of a simple alarm system. These peaks and others were passed through hundreds of logical rules and<br />
they caused the one cited to become “true”. Definitions of items (I) – (M) as marked in figure 2 follow:<br />
(I)<br />
(J)<br />
(K)<br />
(L)<br />
(M)<br />
Level of Spectral peak<br />
Exceedance of average baseline data (or alarm limit if baseline data is not present)<br />
Units (Note, these could be any engineering units such as in/s, mm/s, g’s, etc.)<br />
Frequency of peak in orders (i.e. multiples of shaft rate)<br />
Measurement location and axis. The measurement location “2” is defined later in the report as<br />
the motor coupled end of the machine. “A” is axial or in the direction of the shaft.<br />
As mentioned in the section titled: “Noise Floor Calculation”, an increase in the noise floor level is an<br />
indication of impacting and non-periodic (or random) vibration. Both of these are associated with later<br />
stage bearing wear. Evidence of an increased noise floor level is displayed in this particular report (N).<br />
Within the particular rule template that was activated in this report, the increase in noise floor level added<br />
to the severity of this fault.<br />
The next section of the report (O) contains an analysis of the demod data and its relationship to the spectral<br />
data. The format of this part of the report is slightly different from the spectral report in that it contains<br />
more text. In this example, the demod part of the report is saying that there is a peak in the demod at 9.33x<br />
that directly matches one of the bearing tone candidates cited in the spectral data. 9.33 is actually the third<br />
harmonic of 3.1x which is the fundamental bearing tone, but 9.33 was evident enough to be extracted from<br />
the normal spectrum as well. Had 9.33 not been extracted, the demod report would have said that there was<br />
a peak at 9.33x that had a harmonic relationship with the spectral data. This would have led to the same<br />
conclusion either way, which is that the demod data supports the diagnosis based on the spectral data.