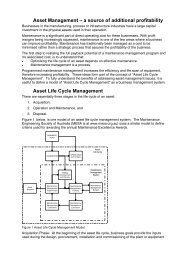
KPI Familiarisation - Plant Maintenance Resource Center
KPI Familiarisation - Plant Maintenance Resource Center
KPI Familiarisation - Plant Maintenance Resource Center
- No tags were found...

Create successful ePaper yourself
Turn your PDF publications into a flip-book with our unique Google optimized e-Paper software.
<strong>KPI</strong> <strong>Familiarisation</strong>
<strong>KPI</strong> = Key Performance Indicator
Objectives• Improve personnel’s understanding of <strong>KPI</strong>s and whatthey indicate.+ =• Improve personnel’s awareness of maintenanceperformance.
What is a <strong>KPI</strong>?<strong>KPI</strong>s track performance against established key success factors.• <strong>KPI</strong>s are directly linked to the overall goals of the company.• Business Objectives are defined at corporate, regional and site level. These goalsdetermine critical activities (Key Success Factors) that must be done well fora particular operation to succeed.• <strong>KPI</strong>s are utilised to track or measure actual performance against key successfactors.– Key Success Factors (KSFs) only change if there is a fundamental shift in business objectives.– Key Performance Indicators (<strong>KPI</strong>s) change as objectives are met, or management focus shifts.BusinessObjectivesDetermine.Key SuccessFactors (KSFs)Tracked by.Key PerformanceIndicators (<strong>KPI</strong>s)No InjuriesSafetyLTI, LTIFR, LTISR.
How do I interpret a <strong>KPI</strong>?Interpretation of <strong>KPI</strong>s is <strong>KPI</strong> dependent.<strong>KPI</strong>s do NOT give answers, rather they raise questions and direct attention.BusinessObjectivesDetermine.Key SuccessFactors (KSFs)Tracked by.Key PerformanceIndicators (<strong>KPI</strong>s)No InjuriesSafetyLTI, LTIFR, LTISR.• If LTI, LTIFR or LTISR increase, this indicates that the business objective,“No Injuries”, is NOT being fulfilled.– This should direct attention to the SAFETY key success factor.– Problems / Issues should be identified and resolved with a view to decreasing safety <strong>KPI</strong>s andtherefore achieving the business objective.• If LTI, LTIFR or LTISR decrease, this indicates that the business objective,“No Injuries”, is being fulfilled.– This indicates safety practices / mechanisms are proving successful.
What influence do I have on <strong>KPI</strong>s?Every person on-site has an influence on certain <strong>KPI</strong>s and business objectives.Senior Foremen• LTIFR• Incidents• Property damage ($)• Cost / unit• Cost / hour• Cost of quality• <strong>Maintenance</strong> effectiveness• <strong>Maintenance</strong> efficiency• Mean time between failure• Mean time to repairCrew• LTIFR• Incidents• Property damage ($)• Mean time to repair
<strong>Maintenance</strong> <strong>KPI</strong>sSeventeen (17) primary maintenance <strong>KPI</strong>s to be utilised.– These <strong>KPI</strong>s will be utilised across the site’s <strong>Maintenance</strong> Departments.<strong>KPI</strong>s• LTIFR (both production and maintenance) • Backlog• <strong>Maintenance</strong> Cost per Unit vs. Budget • % Scheduled Man Hours Planned• <strong>Maintenance</strong> Cost per Hour vs. Budget • % Schedule Compliance• Cost of Quality• % Planning Effectiveness• <strong>Maintenance</strong> Effectiveness• % Man Hours Available• <strong>Maintenance</strong> Efficiency•% Rework• Mean Time Between Failure (MTBF) • % Failures Investigated• Mean Time to Repair (MTTR)• MIP Process Effectiveness• Preventive Inspection Effectiveness• Ratio of Preventive to Breakdown <strong>Maintenance</strong>
LTIFRLost Time Injury Frequency Rate• LTIFR is a measure of overall safety performance, and indicates the frequencyof Lost Time Injuries (LTIs).FormulaLTIFR =⎛ Number of Lost Time Injuries⎜⎞⎟⎝ Total Man Hours ⎠x 1,000,000– Total man hours includes wages, staff and contractor hours associated with both production andmaintenance operations.• Personnel are getting injured.• Safety practices / mechanisms are ineffective.• Incident reporting is increasing.InterpretationLTIFR LTIFR < 5• Personnel are NOT getting injured.• Safety practices / mechanisms are effective.• Incident reporting is reducing.
<strong>Maintenance</strong> Cost per Unit vs. Budget• A measure of the maintenance effort required for a piece of equipment (orplant) to generate a unit of production.Formula<strong>Maintenance</strong> Cost per Unit =Total <strong>Maintenance</strong> CostUnit of Production– Total maintenance cost includes total costed maintenance man hours, parts and any other costsassociated with the maintenance effort (preventive and corrective).– Unit of production will match the associated departments current unit.Interpretation• <strong>Maintenance</strong> effort required is increasing.• <strong>Maintenance</strong> practices / mechanisms are ineffective.• Operating conditions are deteriorating.• Equipment is being over maintained.• <strong>Maintenance</strong> cost budgeting was inaccurate.• <strong>Maintenance</strong> requirements changed during the fiscal year.<strong>Maintenance</strong> Cost Cost per per Unit Unit vs. vs. Budget Budget• <strong>Maintenance</strong> effort required is decreasing.• <strong>Maintenance</strong> practices / mechanisms are effective.• Operating conditions are improving.• <strong>Maintenance</strong> cost budgeting was inaccurate.• <strong>Maintenance</strong> requirements changed during the fiscal year.
<strong>Maintenance</strong> Cost per Hour vs. Budget• A measure of the maintenance effort required to generate production time froma piece of equipment (or plant).Formula<strong>Maintenance</strong> Cost per Hour =Total <strong>Maintenance</strong> CostOperating Time– Total maintenance cost includes total costed maintenance man hours, parts and any other costsassociated with the maintenance effort (preventive and corrective).– Operating time is productive time plus production delays.Interpretation• <strong>Maintenance</strong> effort required is increasing.• <strong>Maintenance</strong> practices / mechanisms are ineffective.• Operating conditions are deteriorating.• Equipment is being over maintained.• <strong>Maintenance</strong> cost budgeting was inaccurate.• <strong>Maintenance</strong> requirements changed during the fiscal year.• Budgeted operating time reduced.<strong>Maintenance</strong> Cost Cost per per Hour Hour vs. vs. Budget Budget• <strong>Maintenance</strong> effort required is decreasing.• <strong>Maintenance</strong> practices / mechanisms are effective.• Operating conditions are improving.• <strong>Maintenance</strong> cost budgeting was inaccurate.• <strong>Maintenance</strong> requirements changed during the fiscal year.• Budgeted operating time increased.
Cost of Quality• A measure of preventive maintenance effect on corrective and totalmaintenance costs.Concept
Cost of Quality (cont.)– Total maintenance cost, or cost of quality, is the sum of preventive and corrective maintenancecosts.– Preventive maintenance cost is the cost associated with maintenance carried out at predeterminedintervals or other prescribed criteria intended to reduce the probability of failure or degradation ofperformance of equipment (or plant).– Corrective maintenance cost is the cost associated with maintenance carried out on a defect whichhas caused equipment (or plant) to be taken out of service during scheduled operating time.Corrective maintenance can be either planned or unplanned.• Preventive maintenance effort decreasing.• Corrective maintenance effort increasing.• Preventive maintenance effort excessive (beyond optimum).• <strong>Maintenance</strong> practices / mechanisms are ineffective.InterpretationCost Cost of of Quality Quality• Preventive maintenance effort is increasing.• Corrective maintenance effort in decreasing.• Preventive to corrective maintenance ratio optimised.• <strong>Maintenance</strong> practices / mechanisms are effective.
<strong>Maintenance</strong> Effectiveness• A measure of the amount of maintenance downtime required to keepequipment (or plant) operating.Formula<strong>Maintenance</strong> Effectiveness =– Operating time is productive time plus production delays.⎛ Operating Time ⎞⎜⎟⎝ Operating Time + Down Time⎠x 100%– Down time is the total time equipment (or plant) is down for maintenance work (preventive andcorrective).• <strong>Maintenance</strong> effort required is decreasing.• <strong>Maintenance</strong> practices / mechanisms are effective.• Operating conditions are improving.Interpretation<strong>Maintenance</strong> Effectiveness > 95% 95%• <strong>Maintenance</strong> effort required is increasing.• <strong>Maintenance</strong> practices / mechanisms are ineffective.• Operating conditions are deteriorating.• Equipment is being over maintained.
<strong>Maintenance</strong> Efficiency• A measure of the maintenance effort required to deliver required performancelevels from equipment (or plant).Formula<strong>Maintenance</strong> Efficiency =– <strong>Maintenance</strong> man hours is the actual maintenance man hours spent maintaining an item ofequipment (or plant). <strong>Maintenance</strong> man hours includes maintenance wages, staff and contractorhours (preventive and corrective).– Operating time is productive time plus production delays.⎛ <strong>Maintenance</strong> Man Hours⎞⎜⎟⎝ Operating Time ⎠x 100%• <strong>Maintenance</strong> effort required is increasing.• <strong>Maintenance</strong> practices / mechanisms are ineffective.• Operating conditions are deteriorating.• Equipment is being over maintained.Interpretation<strong>Maintenance</strong> Efficiency• <strong>Maintenance</strong> effort required is decreasing.• <strong>Maintenance</strong> practices / mechanisms are effective.• Operating conditions are improving.
MTBFMean Time Between Failure• The average amount of operating time between consecutive breakdowns for anitem of equipment (or plant).FormulaMTBF =Operating TimeNumber of Failures or Breakdown Events– Operating time is productive time plus production delays.– Number of failures or breakdown events is the number of failures on an item of equipment (orplant).• <strong>Maintenance</strong> effort required is decreasing.• <strong>Maintenance</strong> practices / mechanisms are effective.• Failure frequency is decreasing.• Operating conditions are improving.InterpretationMTBF MTBF• <strong>Maintenance</strong> effort required is increasing.• <strong>Maintenance</strong> practices / mechanisms are ineffective.• Failure frequency is increasing.• Operating conditions are deteriorating.
MTTRMean Time To Repair• The average maintenance time required to keep an item of equipment (or plant)operational.FormulaMTTR =Down TimeNumber of Failures or Breakdown Events– Down time is the total time equipment (or plant) is down for maintenance work (preventive andcorrective).– Number of failures or breakdown events is the number of failures on an item of equipment (orplant).Interpretation• <strong>Maintenance</strong> practices / mechanisms are ineffective.• Poor clean-up (work preparation) practices.• Ineffective work practices.MTTR MTTR• <strong>Maintenance</strong> practices / mechanisms are effective.• Clean-up (work preparation) practices effective.• Effective work practices.
Preventive Inspection EffectivenessRatio of Preventive Repair Man Hours to Preventive Inspection Man Hours.• A measure of preventive inspection effectiveness.FormulaPreventive Inspection Effectiveness =Preventive Repair M an HoursPreventive Inspection Man Hours– Preventive repair man hours is maintenance that is performed as a result of a preventive inspection.– Preventive inspection man hours is work performed that originates from equipment maintenancestrategies; ie. planned services and inspections.• Preventive inspections are effective.• Inspection frequency to low.• Preventive inspection conducted effectively.InterpretationPreventive Inspection Effectiveness• Preventive inspections are ineffective.• Preventive inspections are conducted ineffectively.• Inspection frequency to high.
Ratio of Preventive to Breakdown <strong>Maintenance</strong>Ratio of Preventive Man Hours to Breakdown Man Hours.• A measure of planning / scheduling process effectiveness and its influence onbreakdown maintenance.FormulaR atio of Preventiveto Breakdown M aintenance =Preventive Repair M an Hours + Preventive Inspection M an HoursBreakdown M an Hours– Preventive repair man hours is maintenance that is performed as a result of a preventive inspection.– Preventive inspection man hours is work performed that originates from equipment maintenancestrategies; ie. planned services and inspections.– Breakdown man hours is unplanned corrective maintenance that must occur due to a defect causingequipment (or plant) to be taken out of service during scheduled operating time (NOT correctivemaintenance man hours).Interpretation• Over maintaining equipment.• Preventive maintenance practices / strategies are tooeffective and should be optimised (optimise costs).Ratio Ratio of of Preventive to to Breakdown <strong>Maintenance</strong> = 16 16• Preventive inspections are ineffective.• Faults not being reported.• Preventive maintenance practices / strategies are ineffective.
Backlog• All maintenance work identified to be done, but as yet incomplete. Indicateshow much outstanding maintenance work exists compared to the resourcesavailable to complete the work.• FormulaBacklog = Total M aintenance M an Hours on Outstanding W ork Orders– Total maintenance man hours on outstanding work orders currently includes both backlog andforward log.Interpretation• Build up of jobs.• Insufficient labour.• <strong>Maintenance</strong> practices / mechanisms are ineffective.• Preventive inspections are effective (Work identified).Backlog < 1,800 1,800 man man hours hours• Preventive inspections are ineffective (No work identified).• Too much labour.• <strong>Maintenance</strong> practices / mechanisms are effective.
% Scheduled Man Hours Planned• The percentage of scheduled man hours that appear on the weekly schedulethat have been planned. A measure of planning process effectiveness.• Formula% Scheduled Man Hours Planned =Planned Man Hours on Weekly ScheduleTotal Weekly Scheduled Man Hoursx 100%– Planned man hours on weekly schedule is the total planned maintenance hours on the weeklymaintenance schedule.⎛⎜⎝– Total weekly scheduled man hours is the total maintenance man hours scheduled for the week(NOT total maintenance man hours available).⎞⎟⎠Interpretation• High level of planned work in backlog.• Minimal job delays.• <strong>Maintenance</strong> practices / mechanisms are effective.• Too much labour.% Scheduled Man Man Hours Hours Planned > 80% 80%• Priority work not being planned.• Lack of planned work in backlog.• <strong>Maintenance</strong> practices / mechanisms are ineffective.• Insufficient labour.
% Scheduled Compliance• A measure of scheduling process compliance.Formula% Scheduled Compliance =⎛⎜⎝Scheduled Man Hours Completed ⎞⎟Total Weekly Scheduled Man Hours⎠x 100%– Scheduled man hours completed is the actual man hours spent performing scheduledmaintenance.– Total weekly scheduled man hours is the total maintenance man hours scheduled for the week(NOT total maintenance man hours available).• Priority jobs being completed.• Planned repairs, PM’s being executed.• <strong>Maintenance</strong> practices / mechanisms are effective.• Too much labour.• Effective work practices.• <strong>Maintenance</strong> / Production Department communication /cooperation effective (Access to equipment).• Insufficient scheduled man hours to conduct maintenance.Interpretation% Scheduled Compliance > 80% 80%• High level of breakdowns / interruptions.• <strong>Maintenance</strong> practices / mechanisms are ineffective.• Insufficient labour.• <strong>Maintenance</strong> / Production Department communication /cooperation ineffective (Access to equipment).• Ineffective work practices.• To many scheduled man hours to conduct maintenance.
% Planning Effectiveness• A measure of planning process compliance.Formula% Planning Effectiveness =⎛⎜⎝Number of Scheduled Jobs Completed with CommentsTotal Number of Scheduled Jobs Completed⎞⎟⎠x 100%– Number of scheduled jobs completed with comments is the number of scheduled jobs completedwith comments on the job ticket identifying issues / problems with the planning process.• Minimum requirements for a planned job not understood.• Schedule compliance low.• High level of job delays.• <strong>Maintenance</strong> practices / mechanisms are ineffective.• <strong>Maintenance</strong> / Production Department communication /cooperation ineffective (Access to equipment).Interpretation% Planning Effectiveness < 20% 20%• Planned requirements well understood.• Schedule compliance high.• <strong>Maintenance</strong> practices / mechanisms are effective.• <strong>Maintenance</strong> / Production Department communication /cooperation effective (Access to equipment).• Job ticket comments not being completed.
% Man Hours Available• Primarily a measure of attendance, but also a useful tool to track training andfuture manpower requirements. Indicates effective utilisation of man power.• Formula% Man Hours Available =⎛ Total Man Hours Paid - Absence from Work⎜⎞⎟⎝Total Man Hours Paid⎠– Absence from work is man hours associated with absenteeism, training and any other diversionfrom an employees primary function.x 100%Interpretation• Lack of employee development.• Lack of training.• Reduction in absenteeism.• Core function (maintenance) being fulfilled.% Man Man Hours Hours Available• Absenteeism.• Excessive training.• Core function (maintenance) not being fulfilled.
% Rework• <strong>Maintenance</strong> action that is a repeat of a previous, ineffective effort. The workcould have been ineffective due to poor workmanship, poor design, orimproper procedures.• Formula% Rework =⎛ Rework Man Hours⎜⎞⎟⎝ <strong>Maintenance</strong> Work Hours⎠x 100%– Rework man hours is man hours associated with a maintenance action that is a repeat of aprevious, ineffective effort.– <strong>Maintenance</strong> man hours is the actual maintenance man hours spent maintaining an item ofequipment (or plant). <strong>Maintenance</strong> man hours includes maintenance wages, staff and contractorhours (preventive and corrective).Interpretation• <strong>Maintenance</strong> practices / mechanisms are ineffective.• Poor design.• Poor operating practices.• Ineffective work practices.% Rework Rework < 20% 20%• <strong>Maintenance</strong> practices / mechanisms are effective.• Effective work practices.• Good design.
% Failures Investigated• Measure of the <strong>Maintenance</strong> Department’s effort to continuously improve.Formula% Failures Investigated =⎛⎜⎝Number of Corrective Job Tickets InvestigatedTotal Number of Corrective Job Tickets⎞⎟⎠x 100%– Number of corrective job tickets investigated is the number of job tickets investigated, root causefound, and solutions investigated to prevent future occurrences. Job tickets that are associated withmaintenance work performed on defects which caused equipment (or plant) to be taken out ofservice during scheduled operating time.– Total number of corrective job tickets is the total number of job tickets associated withmaintenance work performed on defects which caused equipment (or plant) to be taken out ofservice during scheduled operating time.Interpretation• Improved equipment reliability.• Continuously improving maintenancepractices / mechanisms.% Failures Investigated > 80% 80%• Repetitive equipment failures.• Repetitive job delays.• Continuous improvement of maintenance practices /mechanisms is not occurring.
MIP Process Effectiveness• Measure of the <strong>Maintenance</strong> Department’s effort to continuously improve.Concept– MIP process effectiveness is a combination of the maintenance <strong>KPI</strong>s, schedule compliance,planning effectiveness and backlog.• <strong>Maintenance</strong> effort is improving.• <strong>Maintenance</strong> mechanisms / practices are improving.• Improved equipment reliability.• Backlog is decreasing.Interpretation MIP MIP Process Process Effectiveness > 80% 80%• <strong>Maintenance</strong> effort is deteriorating.• <strong>Maintenance</strong> mechanisms / practices are not improving.• Equipment reliability is deteriorating.• Backlog is increasing.
Summary<strong>KPI</strong>s track performance against established key success factors.Interpretation of <strong>KPI</strong>s is <strong>KPI</strong> dependent.<strong>KPI</strong>s do NOT give answers, rather they raise questions and direct attention.Every person on-site has an influence on certain <strong>KPI</strong>s and business objectives.Seventeen (17) primary maintenance <strong>KPI</strong>s to be utilised.–These <strong>KPI</strong>s will be utilised across the site’s <strong>Maintenance</strong> Departments.• Systems and mechanism implemented to address business objectives (keysuccess factors) can always be improved.– A continuous improvement (CI) philosophy should be adopted.