AUTOMATED BEARING WEAR DETECTION Alan Friedman DLI ...
AUTOMATED BEARING WEAR DETECTION Alan Friedman DLI ...
AUTOMATED BEARING WEAR DETECTION Alan Friedman DLI ...

Create successful ePaper yourself
Turn your PDF publications into a flip-book with our unique Google optimized e-Paper software.
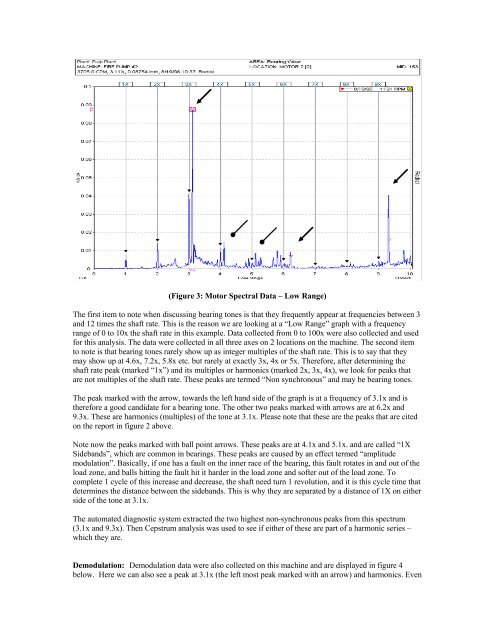
(Figure 3: Motor Spectral Data – Low Range)<br />
The first item to note when discussing bearing tones is that they frequently appear at frequencies between 3<br />
and 12 times the shaft rate. This is the reason we are looking at a “Low Range” graph with a frequency<br />
range of 0 to 10x the shaft rate in this example. Data collected from 0 to 100x were also collected and used<br />
for this analysis. The data were collected in all three axes on 2 locations on the machine. The second item<br />
to note is that bearing tones rarely show up as integer multiples of the shaft rate. This is to say that they<br />
may show up at 4.6x, 7.2x, 5.8x etc. but rarely at exactly 3x, 4x or 5x. Therefore, after determining the<br />
shaft rate peak (marked “1x”) and its multiples or harmonics (marked 2x, 3x, 4x), we look for peaks that<br />
are not multiples of the shaft rate. These peaks are termed “Non synchronous” and may be bearing tones.<br />
The peak marked with the arrow, towards the left hand side of the graph is at a frequency of 3.1x and is<br />
therefore a good candidate for a bearing tone. The other two peaks marked with arrows are at 6.2x and<br />
9.3x. These are harmonics (multiples) of the tone at 3.1x. Please note that these are the peaks that are cited<br />
on the report in figure 2 above.<br />
Note now the peaks marked with ball point arrows. These peaks are at 4.1x and 5.1x. and are called “1X<br />
Sidebands”, which are common in bearings. These peaks are caused by an effect termed “amplitude<br />
modulation”. Basically, if one has a fault on the inner race of the bearing, this fault rotates in and out of the<br />
load zone, and balls hitting the fault hit it harder in the load zone and softer out of the load zone. To<br />
complete 1 cycle of this increase and decrease, the shaft need turn 1 revolution, and it is this cycle time that<br />
determines the distance between the sidebands. This is why they are separated by a distance of 1X on either<br />
side of the tone at 3.1x.<br />
The automated diagnostic system extracted the two highest non-synchronous peaks from this spectrum<br />
(3.1x and 9.3x). Then Cepstrum analysis was used to see if either of these are part of a harmonic series –<br />
which they are.<br />
Demodulation: Demodulation data were also collected on this machine and are displayed in figure 4<br />
below. Here we can also see a peak at 3.1x (the left most peak marked with an arrow) and harmonics. Even