Notes 7-1E Stem and Leaf Plots Name - Deerlake Middle School
Notes 7-1E Stem and Leaf Plots Name - Deerlake Middle School
Notes 7-1E Stem and Leaf Plots Name - Deerlake Middle School

You also want an ePaper? Increase the reach of your titles
YUMPU automatically turns print PDFs into web optimized ePapers that Google loves.
<strong>Notes</strong> 7-<strong>1E</strong> <strong>Stem</strong> <strong>and</strong> <strong>Leaf</strong> <strong>Plots</strong><br />
<strong>Name</strong> _________________________ Pd. _____<br />
A stem <strong>and</strong> leaf plot is a display that, unlike histograms, shows all the individual data values. From the<br />
display, the greatest, least, <strong>and</strong> median values can be seen.<br />
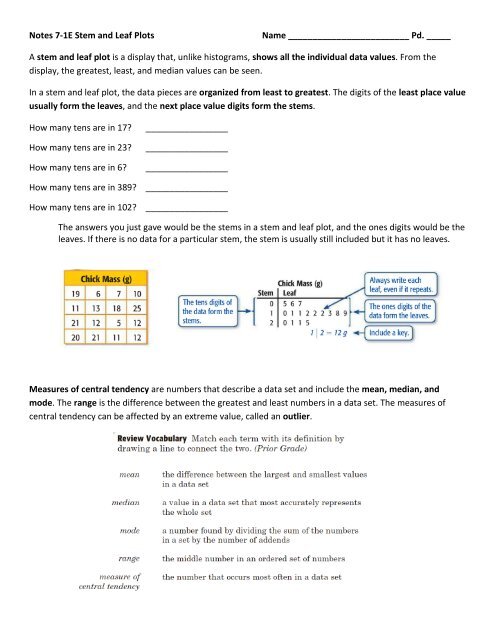
In a stem <strong>and</strong> leaf plot, the data pieces are organized from least to greatest. The digits of the least place value<br />
usually form the leaves, <strong>and</strong> the next place value digits form the stems.<br />
How many tens are in 17<br />
How many tens are in 23<br />
How many tens are in 6<br />
_________________<br />
_________________<br />
_________________<br />
How many tens are in 389 _________________<br />
How many tens are in 102 _________________<br />
The answers you just gave would be the stems in a stem <strong>and</strong> leaf plot, <strong>and</strong> the ones digits would be the<br />
leaves. If there is no data for a particular stem, the stem is usually still included but it has no leaves.<br />
Measures of central tendency are numbers that describe a data set <strong>and</strong> include the mean, median, <strong>and</strong><br />
mode. The range is the difference between the greatest <strong>and</strong> least numbers in a data set. The measures of<br />
central tendency can be affected by an extreme value, called an outlier.
The stem <strong>and</strong> leaf plot shows the number of points scored by a high school basketball player. Which<br />
measure of central tendency is most affected by the outlier
With all the types of data displays we have discussed, a survey must be taken in order to have data. In a<br />
survey, data is collected about a specific group of people, called a population. . A smaller group is chosen from<br />
the population, <strong>and</strong> this group is called a sample. . A sample is chosen to represent the population as a whole,<br />
<strong>and</strong> the sample should be chosen without bias.<br />
Bias: favoring one group over another; leaning one way based on prejudice. Conducting a survey with bias<br />
can encourage the outcome to go a certain way. For a sample to accurately reflect an entire population, the<br />
sample should be unbiased.<br />
Determine whether each of the following conclusions is valid <strong>and</strong> explain your answer.<br />
Every tenth student who walked into the cafeteria was surveyed to determine his or her favorite lunch. Out of 40<br />
students, 19 students stated that they liked the burgers best. The cafeteria staff concluded that about 50% of the<br />
students like burgers best.<br />
____________________________________________________________________________<br />
Janet surveyed the student athletes of the girls’ field hockey team to determine which sports teenagers like best.<br />
Of these, 65% said that they like field hockey best. Janet concluded that over half of all teenagers like field hockey best.<br />
____________________________________________________________________________