
You also want an ePaper? Increase the reach of your titles
YUMPU automatically turns print PDFs into web optimized ePapers that Google loves.
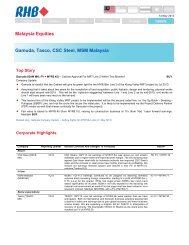
<strong>Malaysia</strong><br />
PP 7767/09/2012(030475)<br />
MARKET DATELINE •<br />
Corporate Highlights<br />
Results / Briefing Note<br />
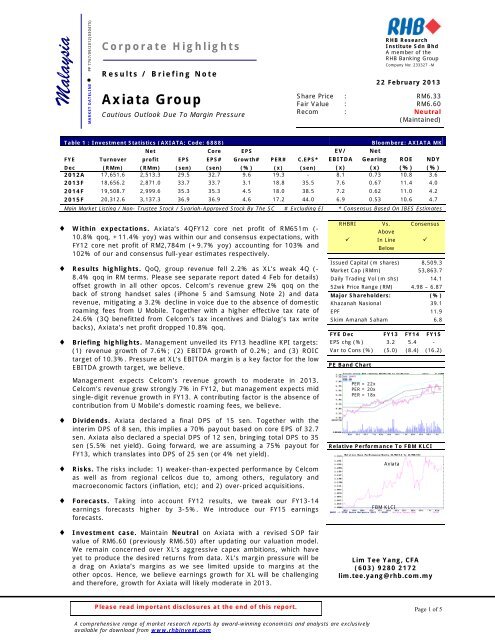
Axiata Group<br />
Cautious Outlook Due To Margin Pressure<br />
RHB Research<br />
Institute Sdn Bhd<br />
A member of the<br />
RHB Banking Group<br />
Company No: 233327 -M<br />
22 February 2013<br />
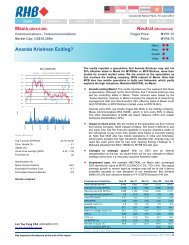
Share Price : RM6.33<br />
Fair Value : RM6.60<br />
Recom : Neutral<br />
(Maintained)<br />
Table 1 : Investment Statistics (AXIATA; Code: 6888)<br />
Bloomberg: AXIATA MK<br />
Net Core EPS EV/ Net<br />
FYE Turnover profit EPS EPS# Growth# PER# C.EPS* EBITDA Gearing ROE NDY<br />
Dec (RMm) (RMm) (sen) (sen) (%) (x) (sen) (x) (x) (%) (%)<br />
2012A 17,651.6 2,513.3 29.5 32.7 9.6 19.3 - 8.1 0.73 10.8 3.6<br />
2013F 18,656.2 2,871.0 33.7 33.7 3.1 18.8 35.5 7.6 0.67 11.4 4.0<br />
2014F 19,508.7 2,999.6 35.3 35.3 4.5 18.0 38.5 7.2 0.62 11.0 4.2<br />
2015F 20,312.6 3,137.3 36.9 36.9 4.6 17.2 44.0 6.9 0.53 10.6 4.7<br />
Main Market Listing / Non- Trustee Stock / Syariah-Approved Stock By The SC # Excluding EI * Consensus Based On IBES Estimates<br />
♦ Within expectations. Axiata’s 4QFY12 core net profit of RM651m (-<br />
10.8% qoq, +11.4% yoy) was within our and consensus expectations, with<br />
FY12 core net profit of RM2,784m (+9.7% yoy) accounting for 103% and<br />
102% of our and consensus full-year estimates respectively.<br />
♦ Results highlights. QoQ, group revenue fell 2.2% as XL’s weak 4Q (-<br />
8.4% qoq in RM terms. Please see separate report dated 4 Feb for details)<br />
offset growth in all other opcos. Celcom’s revenue grew 2% qoq on the<br />
back of strong handset sales (iPhone 5 and Samsung Note 2) and data<br />
revenue, mitigating a 3.2% decline in voice due to the absence of domestic<br />
roaming fees from U Mobile. Together with a higher effective tax rate of<br />
24.6% (3Q benefitted from Celcom’s tax incentives and Dialog’s tax write<br />
backs), Axiata’s net profit dropped 10.8% qoq.<br />
♦ Briefing highlights. Management unveiled its FY13 headline KPI targets:<br />
(1) revenue growth of 7.6%; (2) EBITDA growth of 0.2%; and (3) ROIC<br />
target of 10.3%. Pressure at XL’s EBITDA margin is a key factor for the low<br />
EBITDA growth target, we believe.<br />
Management expects Celcom’s revenue growth to moderate in 2013.<br />
Celcom’s revenue grew strongly 7% in FY12, but management expects mid<br />
single-digit revenue growth in FY13. A contributing factor is the absence of<br />
contribution from U Mobile’s domestic roaming fees, we believe.<br />
♦ Dividends. Axiata declared a final DPS of 15 sen. Together with the<br />
interim DPS of 8 sen, this implies a 70% payout based on core EPS of 32.7<br />
sen. Axiata also declared a special DPS of 12 sen, bringing total DPS to 35<br />
sen (5.5% net yield). Going forward, we are assuming a 75% payout for<br />
FY13, which translates into DPS of 25 sen (or 4% net yield).<br />
♦ Risks. The risks include: 1) weaker-than-expected performance by Celcom<br />
as well as from regional cellcos due to, among others, regulatory and<br />
macroeconomic factors (inflation, etc); and 2) over-priced acquisitions.<br />
♦ Forecasts. Taking into account FY12 results, we tweak our FY13-14<br />
earnings forecasts higher by 3-5%. We introduce our FY15 earnings<br />
forecasts.<br />
♦ Investment case. Maintain Neutral on Axiata with a revised SOP fair<br />
value of RM6.60 (previously RM6.50) after updating our valuation model.<br />
We remain concerned over XL’s aggressive capex ambitions, which have<br />
yet to produce the desired returns from data. XL’s margin pressure will be<br />
a drag on Axiata’s margins as we see limited upside to margins at the<br />
other opcos. Hence, we believe earnings growth for XL will be challenging<br />
and therefore, growth for Axiata will likely moderate in 2013.<br />
RHBRI Vs. Consensus<br />
Above<br />
In Line <br />
Below<br />
Issued Capital (m shares) 8,509.3<br />
Market Cap (RMm) 53,863.7<br />
Daily Trading Vol (m shs) 14.1<br />
52wk Price Range (RM) 4.98 – 6.87<br />
Major Shareholders: (%)<br />
Khazanah Nasional 39.1<br />
EPF 11.9<br />
Skim Amanah Saham 6.8<br />
FYE Dec FY13 FY14 FY15<br />
EPS chg (%) 3.2 5.4 -<br />
Var to Cons (%) (5.0) (8.4) (16.2)<br />
PE Band Chart<br />
PER = 22x<br />
PER = 20x<br />
PER = 18x<br />
Relative Performance To FBM KLCI<br />
Axiata<br />
FBM KLCI<br />
Lim Tee Yang, CFA<br />
(603) 9280 2172<br />
lim.tee.yang@rhb.com.my<br />
Please read important disclosures at the end of this report.<br />
Page 1 of 5<br />
A comprehensive range of market research reports by award-winning economists and analysts are exclusively<br />
available for download from www.rhbinvest.com
22 February 2013<br />
Briefing Highlights<br />
♦ FY13 KPI targets unveiled. Management unveiled its FY13 headline KPI targets: (1) revenue growth of 7.6%<br />
(actual FY12: +7.3%); (2) EBITDA growth of 0.2% (actual FY12: 4.2%); and (3) ROIC target of 10.3% (actual<br />
FY12: 11.9%). Similar to previous years, these figures should exclude forex impact.<br />
We believe management is being conservative it its FY13 EBITDA growth target, which is unsurprising as there is<br />
margin pressure across all the opcos, in particular XL. XL’s EBITDA margin is under pressure due to: 1) the recent<br />
introduction of SMS interconnect charges; 2) upfront infrastructure costs incurred from aggressive data network<br />
rollout; and 3) low margins in data. Meanwhile, we expect Celcom’s EBITDA margin to remain flattish at best as<br />
handset subsidies will put pressure on costs. XL and Celcom combined contribute almost 90% of Axiata’s EBITDA.<br />
♦ Celcom. Management expects Celcom’s revenue growth to moderate in 2013. Celcom’s revenue grew strongly 7%<br />
in FY12, but management expects mid single-digit revenue growth in FY13. A contributing factor is the absence of<br />
contribution from U Mobile’s domestic roaming fees, we believe. In addition, voice revenues surprisingly showed<br />
strong growth of 5% in FY12, but management is cautious whether such figures can be sustained.<br />
On margins, we believe continued aggressive handset subsidies and greater contribution from data to overall<br />
revenue will put a slight downward pressure on EBITDA margin.<br />
♦ Dividends. Management was guarded on the possibility of more special dividends going forward and reiterated its<br />
progressive dividend policy. We estimate Axiata’s cash balance will reduce to RM5.6bn from RM7.9bn after<br />
distributing RM1.3bn in final dividends (15 sen/share) and RM1bn in special dividends (12 sen/share). Going<br />
forward, we are assuming a 75% payout for FY13, which translates into DPS of 25 sen (or 4% net dividend yield).<br />
Axiata declared a final DPS of 15 sen along with a special DPS of 12 sen. Excluding the special dividend, Axiata’s<br />
normal FY12 DPS is 23 sen (Axiata had declared an interim DPS of 8 sen in 2Q). The normal FY12 DPS of 23 sen<br />
translates into a 77% payout based on core EPS of 29.9 sen. Based on total FY12 DPS of 35 sen, this implies a<br />
117% payout.<br />
We believe management prefers to retain flexibility in how it would like to use its cash, which may potentially be<br />
used for M&A, new ventures or debt repayment. Management has expressed its interest in bidding for a mobile<br />
licence in Myanmar, and we believe the cash will come in handy. However, management pointed out that there are<br />
12 to 15 serious players keen to bid for just the two mobile licences up for grab. We believe Axiata may prefer to<br />
focus on in-country consolidation, similar to that of the acquisition of Smart Mobile in Cambodia to scale up<br />
operations with Hello.<br />
♦ Higher capex. Management expects its group capex guidance to be marginally lower at RM4.5bn for FY13 (vs.<br />
RM4.6bn spent in FY12). Group capex remains somewhat elevated primarily due to XL. Amid strong data growth, as<br />
XL aims to continue expanding 3G coverage while also intent on providing the best data experience at existing 3G<br />
sites. Recall that XL expects capex to remain elevated at Rp8-9trn in FY13 (FY12: Rp10trn).<br />
Risks<br />
♦ Risks to our view. The risks include: 1) weaker-than-expected performance by Celcom as well as from regional<br />
cellcos due to, among others, regulatory and macroeconomic factors (inflation, etc); and 2) over-priced<br />
acquisitions.<br />
Forecasts<br />
♦ Forecasts. Taking into account FY12 results, we tweak our FY13-14 earnings forecasts higher by 3-5%. We<br />
introduce our FY15 earnings forecasts.<br />
Valuations And Recommendation<br />
♦ Maintain Neutral. Maintain Neutral on Axiata with a revised SOP fair value of RM6.60 (previously RM6.50) after<br />
updating our valuation model. We remain concerned over XL’s aggressive capex ambitions, which have yet to<br />
produce the desired returns from data. XL’s margin pressure will be a drag on Axiata’s margins as we see limited<br />
upside to margins at the other opcos. Hence, we believe earnings growth for XL will be challenging and therefore,<br />
growth for Axiata will likely moderate in 2013.<br />
A comprehensive range of market research reports by award-winning economists and analysts are exclusively<br />
available for download from www.rhbinvest.com<br />
Page 2 of 5
22 February 2013<br />
Table 2 : Earnings Review<br />
FYE Dec (RMm) 4Q11 3Q12 4Q12<br />
QoQ<br />
(%)<br />
YoY<br />
(%) FY11 FY12<br />
YoY<br />
(%) Comments<br />
Revenue 4,264.3 4,548.0 4,448.8 (2.2) 4.3 16,447.9 17,677.2 7.5 YoY improvement mainly driven by<br />
stronger contribution from Celcom<br />
(+7%), XL (+15%) and Dialog<br />
(+24%).<br />
EBITDA 1,787.7 1,848.3 1,880.4 1.7 5.2 7,147.1 7,412.5 3.7 Some margin pressure seen in XL<br />
Dep/Amort (898.5) (786.9) (971.4) 23.4 8.1 (3,147.1) (3,339.6) 6.1<br />
mainly due to SMS interconnect<br />
charges.<br />
EBIT 889.2 1,061.4 909.0 (14.4) 2.2 4,000.0 4,072.9 1.8<br />
Finance income 60.7 65.7 70.0 6.6 15.3 235.8 262.3 11.3<br />
Finance cost (160.4) (223.1) (168.2) (24.6) 4.9 (638.1) (717.8) 12.5 Total debt as at end-4Q12 was<br />
RM12.6bn (3Q12: RM13.4bn; 4Q11:<br />
RM11.4bn).<br />
Forex gain/(loss) (93.6) 4.0 16.1 >100 >100 (138.7) (66.2) (52.3) Forex impact from translation of<br />
Jointly controlled<br />
0.0 0.0 0.0 nm nm 0.0 0.0 nm<br />
entities<br />
Associates 4.4 68.2 61.8 (9.4) >100 117.6 210.5 79.0<br />
EI 0.0 (4.0) (16.1) >100 nm 0.0 0.0 nm<br />
Pre-tax profit 700.3 972.2 872.7 (10.2) 24.6 3,576.6 3,761.8 5.2<br />
foreign currency borrowings.<br />
Tax (73.4) (163.8) (215.1) 31.3 >100 (864.3) (882.2) 2.1 Higher qoq in 4Q12 due to RM10m tax<br />
Minority interest (82.3) (98.5) (86.5) (12.2) 5.1 (366.6) (366.3) (0.1)<br />
Net profit 544.6 709.9 571.1 (19.6) 4.9 2,345.6 2,513.3 7.1<br />
Core profit 584.6 729.9 651.1 (10.8) 11.4 2,538.6 2,784.3 9.7<br />
incentives recognised in Celcom<br />
compared to RM40m in 3Q12.<br />
Margins (%)<br />
EBITDA 41.9 40.6 42.3 43.5 41.9<br />
EBIT 20.9 23.3 20.4 24.3 23.0<br />
Normalised Pre-tax 16.4 21.4 19.6 21.7 21.3<br />
Effective tax rate 10.5 16.8 24.6 24.2 23.5<br />
Core PAT 13.7 16.0 14.6 15.4 15.8<br />
FY12 lower yoy due to increasing<br />
contributions from data which<br />
command lower margins and margin<br />
compression at XL.<br />
Source: Company, RHBRI<br />
Page 3 of 5<br />
A comprehensive range of market research reports by award-winning economists and analysts are exclusively<br />
available for download from www.rhbinvest.com
22 February 2013<br />
Table 3 : Celcom’s Key Operating Statistics<br />
FYE Dec 4Q11 3Q12 4Q12<br />
qoq<br />
(%)<br />
yoy<br />
(%) Comments<br />
Subscribers (‘000)<br />
- prepaid 9,247 9,540 9,802 2.7 6.0<br />
- postpaid 1,795 1,823 1,832 0.5 2.1<br />
- Total 11,042 11,363 11,634 2.4 5.4 Qoq growth driven by positive response to new prepaid plans.<br />
Net adds (‘000)<br />
- prepaid 498 345 262 (24.1) (47.4) Strong response to new packages (Celcom First and X2).<br />
- postpaid 30 (20) 9 >100 (70.0)<br />
- Blended 528 325 271 (16.6) (48.7)<br />
ARPU (RM)<br />
- prepaid 37 38 36 (5.3) (2.7)<br />
- postpaid 96 93 92 (1.1) (4.2) Lower qoq due to festivities.<br />
- Blended 51 51 49 (3.9) (3.9)<br />
AMPU<br />
- prepaid 194 238 200 (16.0) 3.1 Lower qoq due to absence of domestic roaming from U Mobile.<br />
- postpaid 366 371 310 (16.4) (15.3) Lower qoq due to absence of domestic roaming from U Mobile.<br />
Broadband<br />
Subs (‘000) 937 1,028 1,047 1.8 11.7<br />
Net adds (‘000) 13 34 19 (44.1) 46.2<br />
ARPU (RM) 65 60 60 0.0 (7.7)<br />
Source: Company, RHBRI<br />
Table 4 : Valuation<br />
Value<br />
RMm<br />
Value /<br />
share<br />
RM<br />
Comments<br />
Celcom 36,732.5 4.35 DCF based on WACC = 7.6%<br />
XL Axiata 11,139.6 1.32 67% stake @ fair value of Rp6,000<br />
Dialog 1,491.7 0.18 84.8% stake at market price<br />
SunShare (M1) 1,426.3 0.17 29.7% stake at market price less net debt of SunShare<br />
Robi 1,191.4 0.14 70% stake @ EV/EBITDA of 8x<br />
Idea 2,947.1 0.35 19% stake @ consensus median target price<br />
Others 346.3 0.04 Relates to Samart Corp, Samart I-Mobile and TMIC<br />
Firm value 55,274.8 6.55<br />
Add: Cash 2,600.0 0.31 Holding company level cash (less RM1bn special dividend)<br />
Less: Debt (2,170.0) (0.26) Holding company level debt<br />
Equity Value 55,704.8 6.60<br />
Source: RHBRI<br />
Page 4 of 5<br />
A comprehensive range of market research reports by award-winning economists and analysts are exclusively<br />
available for download from www.rhbinvest.com
22 February 2013<br />
Table 5 : Earnings Forecasts<br />
Table 6 : Forecast Assumptions<br />
FYE Dec (RMm) FY12A FY13F FY14F FY15F FYE Dec FY13F FY14F FY15F<br />
Turnover 17,651.6 18,656.2 19,508.7 20,312.6 Celcom rev gwth (%) 6.5 3.2 3.9<br />
Turnover growth (%) 8.4 5.7 4.6 4.1 Celcom EBITDA margin (%) 45.2 45.5 45.5<br />
XL rev gwth (%) 7.1 4.5 2.7<br />
EBITDA 7,412.5 7,834.2 8,288.5 8,692.0 XL EBITDA margin (%) 44.0 44.0 44.0<br />
EBITDA margin (%) 42.0 42.0 42.5 42.8 Dialog rev gwth (%) 7.1 5.9 5.0<br />
Dialog EBITDA margin (%) 35.9 35.6 35.3<br />
Dep. & amort. (3,339.6) (3,306.3) (3,540.2) (3,770.5)<br />
Capex (RMm) 4,400 4,200 4,000<br />
EBIT 4,072.9 4,527.9 4,748.3 4,921.4<br />
EBIT margin (%) 23.1 24.3 24.3 24.2<br />
Net interest expense (521.7) (433.9) (411.3) (370.8)<br />
Jointly controlled<br />
entities<br />
0.0 0.0 0.0 0.0<br />
Associates 210.5 252.5 265.9 279.3<br />
Pretax Profit 3,761.8 4,346.6 4,603.0 4,830.0<br />
Tax (882.2) (1,043.2) (1,150.7) (1,231.6)<br />
Minorities (366.3) (432.4) (452.7) (461.1)<br />
Net Profit 2,513.3 2,871.0 2,999.6 3,137.3<br />
Core Net Profit 2,784.0 2,871.0 2,999.6 3,137.3<br />
Source: Company data, RHBRI estimates<br />
IMPORTANT DISCLOSURES<br />
This report has been prepared by RHB Research Institute Sdn Bhd (RHBRI) and is for private circulation only to clients of RHBRI and RHB Investment Bank Berhad<br />
(previously known as RHB Sakura Merchant Bankers Berhad). It is for distribution only under such circumstances as may be permitted by applicable law. The opinions<br />
and information contained herein are based on generally available data believed to be reliable and are subject to change without notice, and may differ or be contrary to<br />
opinions expressed by other business units within the RHB Group as a result of using different assumptions and criteria. This report is not to be construed as an offer,<br />
invitation or solicitation to buy or sell the securities covered herein. RHBRI does not warrant the accuracy of anything stated herein in any manner whatsoever and no<br />
reliance upon such statement by anyone shall give rise to any claim whatsoever against RHBRI. RHBRI and/or its associated persons may from time to time have an<br />
interest in the securities mentioned by this report.<br />
This report does not provide individually tailored investment advice. It has been prepared without regard to the individual financial circumstances and objectives of<br />
persons who receive it. The securities discussed in this report may not be suitable for all investors. RHBRI recommends that investors independently evaluate particular<br />
investments and strategies, and encourages investors to seek the advice of a financial adviser. The appropriateness of a particular investment or strategy will depend<br />
on an investor’s individual circumstances and objectives. Neither RHBRI, RHB Group nor any of its affiliates, employees or agents accepts any liability for any loss or<br />
damage arising out of the use of all or any part of this report.<br />
RHBRI and the Connected Persons (the “RHB Group”) are engaged in securities trading, securities brokerage, banking and financing activities as well as providing<br />
investment banking and financial advisory services. In the ordinary course of its trading, brokerage, banking and financing activities, any member of the RHB Group<br />
may at any time hold positions, and may trade or otherwise effect transactions, for its own account or the accounts of customers, in debt or equity securities or loans of<br />
any company that may be involved in this transaction.<br />
“Connected Persons” means any holding company of RHBRI, the subsidiaries and subsidiary undertaking of such a holding company and the respective directors,<br />
officers, employees and agents of each of them. Investors should assume that the “Connected Persons” are seeking or will seek investment banking or other services<br />
from the companies in which the securities have been discussed/covered by RHBRI in this report or in RHBRI’s previous reports.<br />
This report has been prepared by the research personnel of RHBRI. Facts and views presented in this report have not been reviewed by, and may not reflect<br />
information known to, professionals in other business areas of the “Connected Persons,” including investment banking personnel.<br />
The research analysts, economists or research associates principally responsible for the preparation of this research report have received compensation based upon<br />
various factors, including quality of research, investor client feedback, stock picking, competitive factors and firm revenues.<br />
The recommendation framework for stocks and sectors are as follows : -<br />
Stock Ratings<br />
Buy: Share price may exceed 10% over the next 12 months<br />
Trading Buy: Share price may exceed 15% over the next 3 months, however longer-term outlook remains uncertain<br />
Neutral: Share price may fall within the range of +/- 10% over the next 12 months<br />
Take Profit: Target price has been attained. Look to accumulate at lower levels<br />
Sell: Share price may fall by more than 10% over the next 12 months<br />
Not Rated: Stock is not within regular research coverage<br />
Industry/Sector Ratings<br />
Overweight = Industry expected to outperform the FBM KLCI benchmark, weighted by market capitalisation, over the next 6-12 months.<br />
Neutral = Industry expected to perform in line with the FBM KLCI benchmark, weighted by market capitalisation, over the next 6-12 months.<br />
Underweight = Industry expected to underperform the FBM KLCI benchmark, weighted by market capitalisation, over the next 6-12 months.<br />
This report may not be reproduced or redistributed, in whole or in part, without the written permission of RHBRI and RHBRI accepts no liability whatsoever for the<br />
actions of third parties in this respect.<br />
A comprehensive range of market research reports by award-winning economists and analysts are exclusively<br />
available for download from www.rhbinvest.com<br />
Page 5 of 5