GEO Energy - Charts
GEO Energy - Charts
GEO Energy - Charts

Create successful ePaper yourself
Turn your PDF publications into a flip-book with our unique Google optimized e-Paper software.
18-Oct-12<br />
30-Oct-12<br />
09-Nov-12<br />
21-Nov-12<br />
03-Dec-12<br />
13-Dec-12<br />
OSK Research 19 Dec 2012<br />
SINGAPORE EQUITY<br />
Investment Research<br />
Shekhar Jaiswal<br />
65 6232 3894<br />
shekhar.jaiswal@sg.oskgroup.com<br />
Sell <br />
Target<br />
Previous<br />
Price<br />
Coal<br />
SGD<br />
SGD0.34<br />
SGD0.34<br />
SGD0.50<br />
Geo <strong>Energy</strong> Resources is an Indonesia-based<br />
coal-mining group, which has been operating<br />
mines for third party mine owners under coal<br />
cooperation contracts since 2008. Since 2011,<br />
GER changed its business model to become<br />
mine operator for self-owned coalmine.<br />
Stock Statistics<br />
Bloomberg Ticker GERL SP<br />
Market Cap<br />
SGD579m<br />
52 wk H/L price (SGD) 0.50 0.35<br />
3m ADT<br />
SGD16.2m<br />
YTD Returns %<br />
Beta (x) -0.71<br />
Major Shareholders (%)<br />
Master Resources 47.7<br />
Surya Dhamma 4.9<br />
Melati Charles Antony 4.0<br />
Share Performance (%)<br />
Month Absolute Relative<br />
1m 33.3 26.1<br />
3m<br />
6m<br />
12m<br />
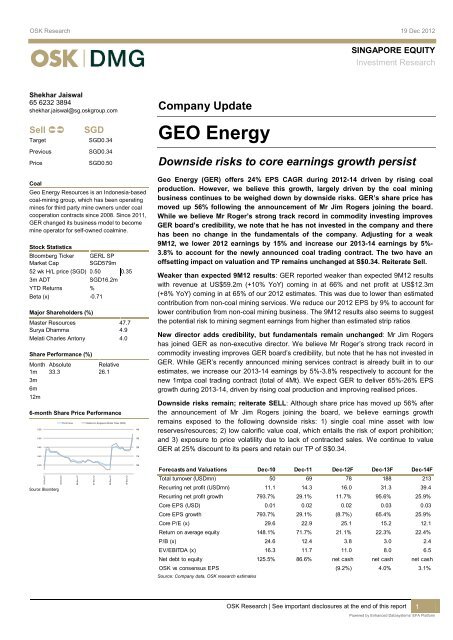
6-month Share Price Performance<br />
0.55<br />
0.50<br />
0.45<br />
0.40<br />
Price Close<br />
Relative to Singapore Straits Times (RHS)<br />
145<br />
135<br />
125<br />
115<br />
Company Update<br />
<strong>GEO</strong> <strong>Energy</strong><br />
Downside risks to core earnings growth persist<br />
Geo <strong>Energy</strong> (GER) offers 24% EPS CAGR during 2012-14 driven by rising coal<br />
production. However, we believe this growth, largely driven by the coal mining<br />
business continues to be weighed down by downside risks. GER’s share price has<br />
moved up 56% following the announcement of Mr Jim Rogers joining the board.<br />
While we believe Mr Roger’s strong track record in commodity investing improves<br />
GER board’s credibility, we note that he has not invested in the company and there<br />
has been no change in the fundamentals of the company. Adjusting for a weak<br />
9M12, we lower 2012 earnings by 15% and increase our 2013-14 earnings by 5%-<br />
3.8% to account for the newly announced coal trading contract. The two have an<br />
offsetting impact on valuation and TP remains unchanged at S$0.34. Reiterate Sell.<br />
Weaker than expected 9M12 results: GER reported weaker than expected 9M12 results<br />
with revenue at US$59.2m (+10% YoY) coming in at 66% and net profit at US$12.3m<br />
(+8% YoY) coming in at 65% of our 2012 estimates. This was due to lower than estimated<br />
contribution from non-coal mining services. We reduce our 2012 EPS by 9% to account for<br />
lower contribution from non-coal mining business. The 9M12 results also seems to suggest<br />
the potential risk to mining segment earnings from higher than estimated strip ratios<br />
New director adds credibility, but fundamentals remain unchanged: Mr Jim Rogers<br />
has joined GER as non-executive director. We believe Mr Roger’s strong track record in<br />
commodity investing improves GER board’s credibility, but note that he has not invested in<br />
GER. While GER’s recently announced mining services contract is already built in to our<br />
estimates, we increase our 2013-14 earnings by 5%-3.8% respectively to account for the<br />
new 1mtpa coal trading contract (total of 4Mt). We expect GER to deliver 65%-26% EPS<br />
growth during 2013-14, driven by rising coal production and improving realised prices.<br />
Downside risks remain; reiterate SELL: Although share price has moved up 56% after<br />
the announcement of Mr Jim Rogers joining the board, we believe earnings growth<br />
remains exposed to the following downside risks: 1) single coal mine asset with low<br />
reserves/resources; 2) low calorific value coal, which entails the risk of export prohibition;<br />
and 3) exposure to price volatility due to lack of contracted sales. We continue to value<br />
GER at 25% discount to its peers and retain our TP of S$0.34.<br />
0.35<br />
0.30<br />
Source: Bloomberg<br />
105<br />
95<br />
Forecasts and Valuations Dec-10 Dec-11 Dec-12F Dec-13F Dec-14F<br />
Total turnover (USDmn) 50 69 78 188 213<br />
Recurring net profit (USDmn) 11.1 14.3 16.0 31.3 39.4<br />
Recurring net profit growth 793.7% 29.1% 11.7% 95.6% 25.9%<br />
Core EPS (USD) 0.01 0.02 0.02 0.03 0.03<br />
Core EPS growth 793.7% 29.1% (8.7%) 65.4% 25.9%<br />
Core P/E (x) 29.6 22.9 25.1 15.2 12.1<br />
Return on average equity 148.1% 71.7% 21.1% 22.3% 22.4%<br />
P/B (x) 24.6 12.4 3.8 3.0 2.4<br />
EV/EBITDA (x) 16.3 11.7 11.0 8.0 6.5<br />
Net debt to equity 125.5% 86.6% net cash net cash net cash<br />
OSK vs consensus EPS (9.2%) 4.0% 3.1%<br />
Source: Company data, OSK research estimates<br />
OSK Research | See important disclosures at the end of this report 1<br />
Powered by Enhanced Datasystems’ EFA Platform
OSK Research<br />
FINANCIAL<br />
Profit & Loss (USDmn) Dec-10 Dec-11 Dec-12F Dec-13F Dec-14F<br />
Total turnover 50 69 78 188 213<br />
Cost of sales (31) (43) (48) (138) (152)<br />
Gross profit 19 27 30 50 61<br />
Gen & admin expenses (2) (5) (6) (6) (7)<br />
Other operating costs 0 0 - - -<br />
Operating profit 17 21 24 44 54<br />
Operating EBITDA 20 28 37 59 73<br />
Depreciation of fixed assets (3) (7) (13) (16) (18)<br />
Operating EBIT 17 21 24 44 54<br />
Other recurring income (1) (0) (1) (1) (1)<br />
Interest income 0 0 0 1 1<br />
Interest expense (1) (2) (1) (1) (1)<br />
Exchange gains 0 0 - - -<br />
Pre-tax profit 15 19 22 43 54<br />
Taxation (4) (5) (6) (11) (14)<br />
Minority interests 0 (0) (0) (0) (0)<br />
Profit after tax & minorities 11 14 16 31 39<br />
Net income to ord equity 11 14 16 31 39<br />
Recurring net profit 11 14 16 31 39<br />
Balance Sheet (USDmn) Dec-10 Dec-11 Dec-12F Dec-13F Dec-14F<br />
Total cash and equivalents 2 4 65 55 97<br />
Inventories 3 2 3 12 11<br />
Accounts receivable 4 1 7 23 20<br />
Total current assets 12 8 77 92 130<br />
Other current assets 3 2 2 2 2<br />
Tangible fixed assets 38 80 84 96 92<br />
Intangible assets 0 1 1 1 1<br />
Total other assets 1 1 1 1 1<br />
Total non-current assets 40 83 86 98 94<br />
Total assets 51 91 163 190 224<br />
Short-term debt 11 9 8 6 3<br />
Accounts payable 6 9 6 9 11<br />
Other current liabilities 12 11 6 6 6<br />
Total current liabilities 29 28 20 20 19<br />
Total long-term debt 8 3 1 1 0<br />
Other liabilities 1 33 18 13 8<br />
Total non-current liabilities 9 36 18 13 8<br />
Total liabilities 38 64 38 33 27<br />
Share capital 0 0 82 82 82<br />
Retained earnings reserve 12 27 43 74 113<br />
Other reserves 1 (0) (0) (0) (0)<br />
Shareholders' equity 13 27 125 156 196<br />
Minority interests (0) 0 0 0 1<br />
Other equity 0 (0) (0) (0) 0<br />
Total equity 13 27 125 157 196<br />
Total liabilities & shareholders' equity 51 91 163 190 224<br />
OSK Research | See important disclosures at the end of this report 2
OSK Research<br />
Cashflow (USDmn) Dec-10 Dec-11 Dec-12F Dec-13F Dec-14F<br />
Operating profit 17 21 24 44 54<br />
Depreciation & amortisation 3 7 13 16 18<br />
Change in working capital (2) 8 (11) (22) 6<br />
Other operating cashflow 1 1 (1) (1) (1)<br />
Operating cashflow 19 38 25 36 78<br />
Tax paid (0) (3) (6) (11) (14)<br />
Cashflow from operations 19 34 20 25 64<br />
Capex (9) (27) (17) (27) (14)<br />
Other investing cashflow 2 2 0 1 1<br />
Cashflow from investing activities (7) (25) (17) (26) (13)<br />
Proceeds from issue of shares 1 - 67 - -<br />
Increase in debt (10) 3 (3) (3) (3)<br />
Other financing cashflow (2) (10) (6) (6) (6)<br />
Cashflow from financing activities (11) (7) 58 (9) (9)<br />
Cash at beginning of period 2 2 4 65 55<br />
Total cash generated 1 2 61 (10) 42<br />
Forex effects (0) (0) - - -<br />
Implied cash at end of period 2 4 65 55 97<br />
Source : OSK, Bloomberg<br />
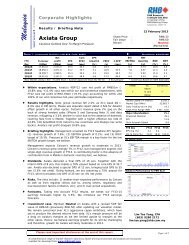
Figure 1 GERL: coal production outlook<br />
(Mt)<br />
3.0<br />
2.5<br />
2.3<br />
2.5<br />
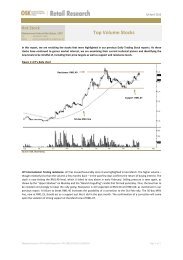
Figure 2 GERL: ASP and production cost outlook<br />
(US$/tonne)<br />
60.0<br />
50.0<br />
Title:<br />
Source:<br />
49.4<br />
46.8 Please fill in the 46.2 values above to have them entered in you<br />
2.0<br />
1.5<br />
40.0<br />
30.0<br />
30.1 30.8 31.9<br />
1.0<br />
0.7<br />
20.0<br />
0.5<br />
10.0<br />
-<br />
-<br />
2011 2012 2013 2014<br />
-<br />
-<br />
-<br />
2011 2012 2013 2014<br />
Production outlook<br />
ASP outlook<br />
Cost outlook<br />
Source: OSK, Company reports<br />
Source: OSK, Company reports<br />
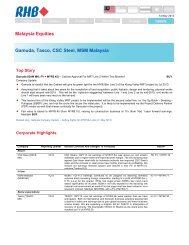
Figure 3 GERL: one year forward EV/EBITDA<br />
(x)<br />
9.0<br />
8.5<br />
8.0<br />
7.5<br />
7.0<br />
+1 STD<br />
7.7x<br />
Avg. 7.1x<br />
Current<br />
8.6x<br />
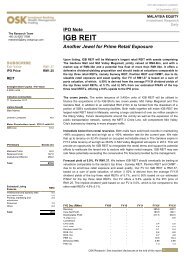
Figure 4 GERL: one year forward PE<br />
(x)<br />
16.0<br />
15.0<br />
14.0<br />
13.0<br />
12.0<br />
11.0<br />
Title:<br />
Source:<br />
+1 STD Please fill in the values above to have them entered in you<br />
13.8x<br />
-1 STD 11.6x<br />
Avg.<br />
12.7x<br />
Current<br />
15.4x<br />
6.5<br />
-1 STD<br />
6.5x<br />
6.0<br />
Oct-12 Oct-12 Nov-12 Nov-12 Nov-12 Dec-12 Dec-12<br />
10.0<br />
9.0<br />
Oct-12 Oct-12 Nov-12 Nov-12 Nov-12 Dec-12 Dec-12<br />
Source: OSK, Bloomberg<br />
GERL fwd. EV/EBITDA<br />
Source: OSK, Bloomberg<br />
GERL fwd. PE<br />
OSK Research | See important disclosures at the end of this report 3
na<br />
0.34<br />
0.33 0.34<br />
OSK Research<br />
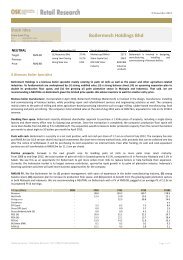
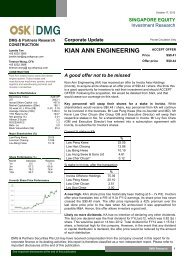
RECOMMENDATION CHART<br />
Price Close<br />
0.46<br />
Recommendations & Target Price<br />
0.44<br />
0.42<br />
0.40<br />
0.38<br />
0.36<br />
0.34<br />
0.32<br />
0.30<br />
Oct-12 Nov-12 Nov-12<br />
Source : OSK, Bloomberg<br />
Buy Neutral Sell Trading Buy Take Profit Unrated<br />
Date Recommendation Target Price Price<br />
2012-11-15 Sell 0.34 0.37<br />
2012-11-15 Sell 0.33 0.37<br />
2012-10-30 Sell 0.34 0.41<br />
OSK Research | See important disclosures at the end of this report 4
OSK Guide to Investment Ratings<br />
Buy: Share price may exceed 10% over the next 12 months<br />
Trading Buy: Share price may exceed 15% over the next 3 months, however longer-term outlook remains uncertain<br />
Neutral: Share price may fall within the range of +/- 10% over the next 12 months<br />
Take Profit: Target price has been attained. Look to accumulate at lower levels<br />
Sell: Share price may fall by more than 10% over the next 12 months<br />
Not Rated: Stock is not within regular research coverage<br />
Disclosure & Disclaimer<br />
All research is based on material compiled from data considered to be reliable at the time of writing, but OSK does not make any representation or<br />
warranty, express or implied, as to its accuracy, completeness or correctness. However, information and opinions expressed will be subject to change<br />
at short notice, and no part of this report is to be construed as an offer or solicitation of an offer to transact any securities or financial instruments<br />
whether referred to herein or otherwise. This report is general in nature and has been prepared for information purposes only. It is intended for<br />
circulation amongst OSK’s and its affiliates’ clients. Any recommendation contained in this report does not have regard to the specific investment<br />
objectives, financial situation and the particular needs of any specific addressee. This report is for the information of addressees only and is not to be<br />
taken in substitution for the exercise of judgment by addressees, who should obtain separate legal or financial advice.<br />
OSK, its affiliates and related companies, their directors, associates, connected parties and/or employees may own or have positions in securities of<br />
the company(ies) covered in this research report or any securities related thereto, and may from time to time add to, or dispose off, or may be<br />
materially interested in any such securities. Further, OSK, its affiliates and related companies do and seek to do business with the company(ies)<br />
covered in this research report and may from time to time act as market maker or have assumed an underwriting commitment in securities of such<br />
company(ies), may sell them or buy them from customers on a principal basis and may also perform or seek to perform significant investment banking,<br />
advisory or underwriting services for or relating to such company(ies), as well as solicit such investment, advisory or other services from any entity<br />
mentioned in this research report.<br />
OSK do not accept any liability, be it directly, indirectly or consequential losses, loss of profits or damages that may arise from any reliance based on<br />
this report or further communication given in relation to this report.<br />
The term “OSK” shall denote where applicable,the relevant entity distributing the report in the particular jurisdiction mentioned specifically herein below<br />
and shall refer to OSK Investment Bank Berhad, its affiliates, subsidiaries and related companies.<br />
All Rights Reserved. This report is for the use of intended recipients only and may not be reproduced, distributed or published for any purpose without<br />
prior consent of OSK.<br />
Malaysia<br />
This report is published and distributed in Malaysia by OSK Research Sdn Bhd (206591-V), 6th Floor, Plaza OSK, Jalan Ampang, 50450 Kuala<br />
Lumpur, a wholly owned subsidiary of OSK Investment Bank Berhad (OSKIB). This report is printed by Xpress Print (KL) Sdn. Bhd., No. 17, Jalan<br />
Lima, Off Jalan Chan Sow Lin, 55200 Kuala Lumpur.<br />
As of 19 Dec 2012, OSKIB does not have proprietary positions in the subject companies, except for:<br />
a) -<br />
As of 19 Dec 2012, none of the analysts who covered the stock in this report has an interest in the subject companies covered in this report, except<br />
for:<br />
a) -<br />
Singapore<br />
This report is published and distributed in Singapore by DMG & Partners Research Pte Ltd (Reg. No. 200808705N), a wholly owned subsidiary of<br />
DMG & Partners Securities Pte Ltd, a joint venture between OSK Investment Bank Berhad, Malaysia and Deutsche Asia Pacific Holdings Pte Ltd (a<br />
subsidiary of Deutsche Bank Group). DMG & Partners Securities Pte Ltd is a Member of the Singapore Exchange Securities Trading Limited.<br />
As of 19 Dec 2012, DMG & Partners Securities Pte Ltd and its subsidiaries, including DMG & Partners Research Pte Ltd, do not have proprietary<br />
positions in the subject companies, except for:<br />
a) -<br />
As of 19 Dec 2012, none of the analysts who covered the stock in this report has an interest in the subject companies covered in this report, except<br />
for:<br />
a) -<br />
Special Distribution by OSK<br />
Where the research report is produced by an OSK entity (excluding DMG & Partners Research Pte Ltd) and distributed in Singapore, it is only<br />
distributed to "Institutional Investors", "Expert Investors" or "Accredited Investors" as defined in the Securities and Futures Act, CAP. 289 of Singapore.<br />
If you are not an "Institutional Investor", "Expert Investor" or "Accredited Investor", this research report is not intended for you and you should<br />
disregard this research report in its entirety. In respect of any matters arising from, or in connection with this research report, you are to contact our<br />
Singapore Office, DMG & Partners Securities Pte Ltd.<br />
OSK Research | See important disclosures at the end of this report 5
Hong Kong<br />
This report is published and distributed in Hong Kong by OSK Securities Hong Kong Limited (“OSKSHK”), a subsidiary of OSK Investment Bank<br />
Berhad, Malaysia (“OSKIB”).<br />
OSKSHK, OSKIB and/or other affiliates may beneficially own a total of 1% or more of any class of common equity securities of the subject company.<br />
OSKSHK, OSKIB and/or other affiliates may, within the past 12 months, have received compensation and/or within the next 3 months seek to obtain<br />
compensation for investment banking services from the subject company.<br />
Risk Disclosure Statements<br />
The prices of securities fluctuate, sometimes dramatically. The price of a security may move up or down, and may become valueless. It is as likely that<br />
losses will be incurred rather than profit made as a result of buying and selling securities. Past performance is not a guide to future performance.<br />
OSKSHK does not maintain a predetermined schedule for publication of research and will not necessarily update this report<br />
Indonesia<br />
This report is published and distributed in Indonesia by PT OSK Nusadana Securities Indonesia, a subsidiary of OSK Investment Bank Berhad,<br />
Malaysia.<br />
Thailand<br />
This report is published and distributed in Thailand by OSK Securities (Thailand) PCL, 10th Floor, Sathorn Square Office Tower, 98, North Sathorn<br />
Road, Bangrak, Bangkok, a subsidiary of OSK Investment Bank Berhad, Malaysia.<br />
Other Jurisdictions<br />
In any other jurisdictions, this report is intended to be distributed to qualified, accredited and professional investors, in compliance with the law and<br />
regulations of the jurisdictions.<br />
Kuala Lumpur Hong Kong Singapore<br />
Malaysia Research Office<br />
OSK Research Sdn. Bhd.<br />
6 th Floor, Plaza OSK<br />
Jalan Ampang<br />
50450 Kuala Lumpur<br />
Malaysia<br />
Tel : +(60) 3 9207 7688<br />
Fax : +(60) 3 2175 3202<br />
OSK Securities<br />
Hong Kong Ltd.<br />
12 th Floor,<br />
World-Wide House<br />
19 Des Voeux Road<br />
Central, Hong Kong<br />
Tel : +(852) 2525 1118<br />
Fax : +(852) 2810 0908<br />
DMG & Partners<br />
Securities Pte. Ltd.<br />
10 Collyer Quay<br />
#09-08 Ocean Financial Centre<br />
Singapore 049315<br />
Tel : +(65) 6533 1818<br />
Fax : +(65) 6532 6211<br />
Jakarta Shanghai Phnom Penh<br />
PT OSK Nusadana<br />
Securities Indonesia<br />
Plaza CIMB Niaga,<br />
14th Floor,<br />
Jl. Jend. Sudirman Kav.25,<br />
Jakarta Selatan 12920, Indonesia.<br />
Tel : (6221) 2598 6888<br />
Fax : (6221) 2598 6777<br />
OSK (China) Investment<br />
Advisory Co. Ltd.<br />
Suite 4005, CITIC Square<br />
1168 Nanjing West Road<br />
Shanghai 20041<br />
China<br />
Tel : +(8621) 6288 9611<br />
Fax : +(8621) 6288 9633<br />
Bangkok<br />
OSK Securities (Thailand) PCL<br />
10th Floor ,Sathorn Square Office Tower,<br />
98, North Sathorn Road,Silom,<br />
Bangrak, Bangkok 10500<br />
Thailand<br />
Tel: +(66) 862 9999<br />
Fax : +(66) 108 0999<br />
OSK Indochina Securities Limited<br />
No. 1-3, Street 271,<br />
Sangkat Toeuk Thla, Khan Sen Sok,<br />
Phnom Penh,<br />
Cambodia<br />
Tel: (855) 23 969 161<br />
Fax: (855) 23 969 171<br />
OSK Research | See important disclosures at the end of this report 6