Handbook of Magnetic Compass Adjustment - Maritime Safety ...
Handbook of Magnetic Compass Adjustment - Maritime Safety ...
Handbook of Magnetic Compass Adjustment - Maritime Safety ...

You also want an ePaper? Increase the reach of your titles
YUMPU automatically turns print PDFs into web optimized ePapers that Google loves.
CHAPTER V<br />
TYPICAL DEVIATION CURVE AND THE ESTIMATION OF APPROXIMATE<br />
COEFFICIENTS<br />
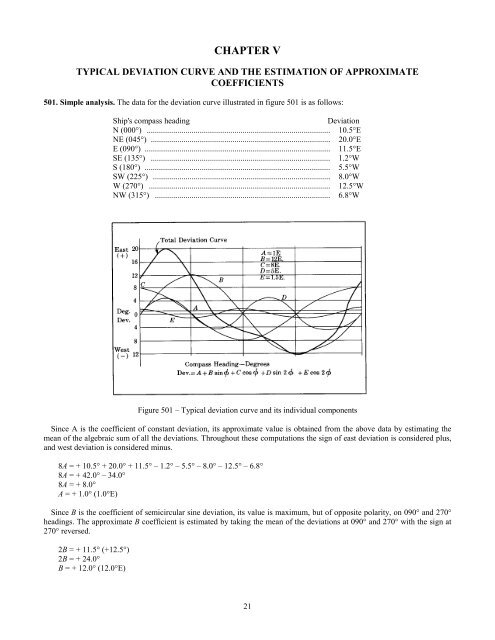
501. Simple analysis. The data for the deviation curve illustrated in figure 501 is as follows:<br />
Ship's compass heading<br />
Deviation<br />
N (000°) .......................................................................................... 10.5°E<br />
NE (045°) ........................................................................................ 20.0°E<br />
E (090°) ........................................................................................... 11.5°E<br />
SE (135°) ........................................................................................ 1.2°W<br />
S (180°) ........................................................................................... 5.5°W<br />
SW (225°) ....................................................................................... 8.0°W<br />
W (270°) ......................................................................................... 12.5°W<br />
NW (315°) ...................................................................................... 6.8°W<br />
Figure 501 – Typical deviation curve and its individual components<br />
Since A is the coefficient <strong>of</strong> constant deviation, its approximate value is obtained from the above data by estimating the<br />
mean <strong>of</strong> the algebraic sum <strong>of</strong> all the deviations. Throughout these computations the sign <strong>of</strong> east deviation is considered plus,<br />
and west deviation is considered minus.<br />
8A = + 10.5° + 20.0° + 11.5° – 1.2° – 5.5° – 8.0° – 12.5° – 6.8°<br />
8A = + 42.0° – 34.0°<br />
8A = + 8.0°<br />
A = + 1.0° (1.0°E)<br />
Since B is the coefficient <strong>of</strong> semicircular sine deviation, its value is maximum, but <strong>of</strong> opposite polarity, on 090° and 270°<br />
headings. The approximate B coefficient is estimated by taking the mean <strong>of</strong> the deviations at 090° and 270° with the sign at<br />
270° reversed.<br />
2B = + 11.5° (+12.5°)<br />
2B = + 24.0°<br />
B = + 12.0° (12.0°E)<br />
21