fnh journal vol 24 - Forth Naturalist and Historian - University of Stirling
fnh journal vol 24 - Forth Naturalist and Historian - University of Stirling
fnh journal vol 24 - Forth Naturalist and Historian - University of Stirling

You also want an ePaper? Increase the reach of your titles
YUMPU automatically turns print PDFs into web optimized ePapers that Google loves.
20 S.J. Harrison<br />
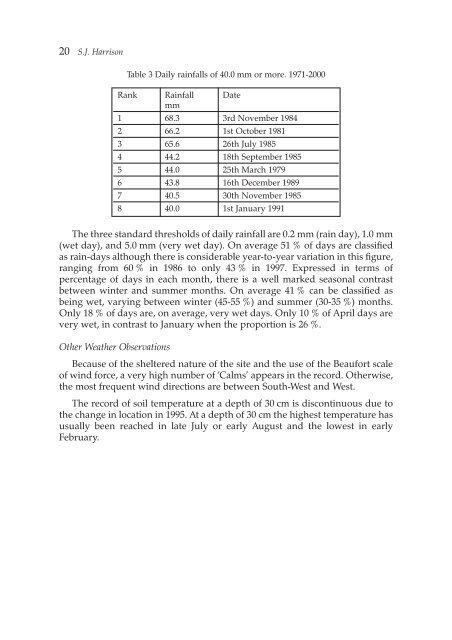
Table 3 Daily rainfalls <strong>of</strong> 40.0 mm or more. 1971-2000<br />
Rank Rainfall Date<br />
mm<br />
1 68.3 3rd November 1984<br />
2 66.2 1st October 1981<br />
3 65.6 26th July 1985<br />
4 44.2 18th September 1985<br />
5 44.0 25th March 1979<br />
6 43.8 16th December 1989<br />
7 40.5 30th November 1985<br />
8 40.0 1st January 1991<br />
The three st<strong>and</strong>ard thresholds <strong>of</strong> daily rainfall are 0.2 mm (rain day), 1.0 mm<br />
(wet day), <strong>and</strong> 5.0 mm (very wet day). On average 51 % <strong>of</strong> days are classified<br />
as rain-days although there is considerable year-to-year variation in this figure,<br />
ranging from 60 % in 1986 to only 43 % in 1997. Expressed in terms <strong>of</strong><br />
percentage <strong>of</strong> days in each month, there is a well marked seasonal contrast<br />
between winter <strong>and</strong> summer months. On average 41 % can be classified as<br />
being wet, varying between winter (45-55 %) <strong>and</strong> summer (30-35 %) months.<br />
Only 18 % <strong>of</strong> days are, on average, very wet days. Only 10 % <strong>of</strong> April days are<br />
very wet, in contrast to January when the proportion is 26 %.<br />
Other Weather Observations<br />
Because <strong>of</strong> the sheltered nature <strong>of</strong> the site <strong>and</strong> the use <strong>of</strong> the Beaufort scale<br />
<strong>of</strong> wind force, a very high number <strong>of</strong> ‘Calms’ appears in the record. Otherwise,<br />
the most frequent wind directions are between South-West <strong>and</strong> West.<br />
The record <strong>of</strong> soil temperature at a depth <strong>of</strong> 30 cm is discontinuous due to<br />
the change in location in 1995. At a depth <strong>of</strong> 30 cm the highest temperature has<br />
usually been reached in late July or early August <strong>and</strong> the lowest in early<br />
February.