2010 Component Unit Financial Statements - Regional ...
2010 Component Unit Financial Statements - Regional ...
2010 Component Unit Financial Statements - Regional ...

Create successful ePaper yourself
Turn your PDF publications into a flip-book with our unique Google optimized e-Paper software.
REGIONAL TRANSPORTATION COMMISSION OF SOUTHERN NEVADA<br />
NOTES TO FINANCIAL STATEMENTS<br />
FOR THE YEAR ENDED JUNE 30, <strong>2010</strong><br />
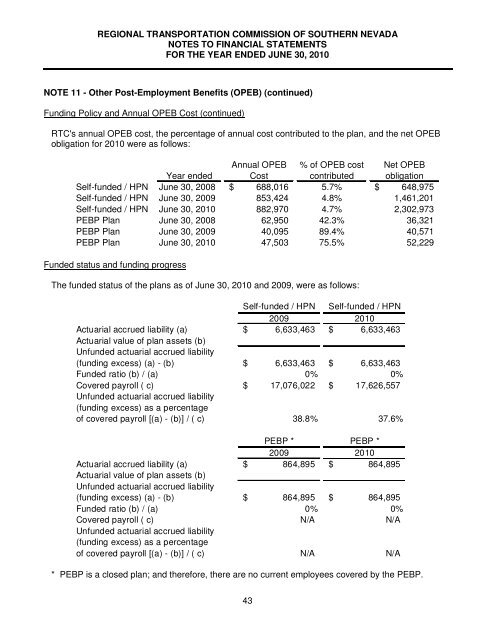
NOTE 11 - Other Post-Employment Benefits (OPEB) (continued)<br />
Funding Policy and Annual OPEB Cost (continued)<br />
RTC's annual OPEB cost, the percentage of annual cost contributed to the plan, and the net OPEB<br />
obligation for <strong>2010</strong> were as follows:<br />
Year ended<br />
Self-funded / HPN June 30, 2008<br />
Self-funded / HPN June 30, 2009<br />
Self-funded / HPN June 30, <strong>2010</strong><br />
PEBP Plan June 30, 2008<br />
PEBP Plan June 30, 2009<br />
PEBP Plan June 30, <strong>2010</strong><br />
Annual OPEB<br />
Cost<br />
% of OPEB cost<br />
contributed<br />
Net OPEB<br />
obligation<br />
$ 688,016 5.7% $ 648,975<br />
853,424 4.8% 1,461,201<br />
882,970 4.7% 2,302,973<br />
62,950 42.3% 36,321<br />
40,095 89.4% 40,571<br />
47,503 75.5% 52,229<br />
Funded status and funding progress<br />
The funded status of the plans as of June 30, <strong>2010</strong> and 2009, were as follows:<br />
Actuarial accrued liability (a)<br />
Actuarial value of plan assets (b)<br />
Unfunded actuarial accrued liability<br />
(funding excess) (a) - (b)<br />
Funded ratio (b) / (a)<br />
Covered payroll ( c)<br />
Unfunded actuarial accrued liability<br />
(funding excess) as a percentage<br />
of covered payroll [(a) - (b)] / ( c)<br />
Self-funded / HPN Self-funded / HPN<br />
2009 <strong>2010</strong><br />
$ 6,633,463 $ 6,633,463<br />
$<br />
$<br />
6,633,463<br />
0%<br />
17,076,022<br />
38.8%<br />
$<br />
$<br />
6,633,463<br />
0%<br />
17,626,557<br />
37.6%<br />
Actuarial accrued liability (a)<br />
Actuarial value of plan assets (b)<br />
Unfunded actuarial accrued liability<br />
(funding excess) (a) - (b)<br />
Funded ratio (b) / (a)<br />
Covered payroll ( c)<br />
Unfunded actuarial accrued liability<br />
(funding excess) as a percentage<br />
of covered payroll [(a) - (b)] / ( c)<br />
$<br />
$<br />
PEBP *<br />
PEBP *<br />
2009 <strong>2010</strong><br />
864,895 $ 864,895<br />
864,895 $ 864,895<br />
0%<br />
0%<br />
N/A<br />
N/A<br />
N/A<br />
N/A<br />
* PEBP is a closed plan; and therefore, there are no current employees covered by the PEBP.<br />
43