Reports AMRUTANJAN HEALTH CARE Ltd - Nayan M Vala ...
Reports AMRUTANJAN HEALTH CARE Ltd - Nayan M Vala ...
Reports AMRUTANJAN HEALTH CARE Ltd - Nayan M Vala ...

You also want an ePaper? Increase the reach of your titles
YUMPU automatically turns print PDFs into web optimized ePapers that Google loves.
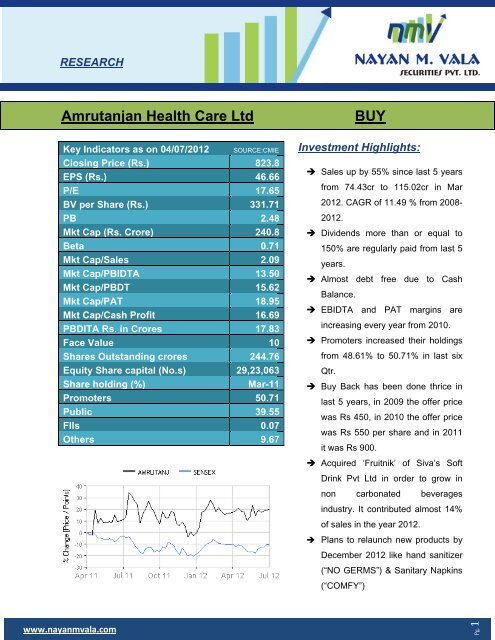
RESEARCH<br />
Amrutanjann Health<br />
Care<br />
<strong>Ltd</strong><br />
BUY<br />
Key Indicators as<br />
on 04/07/ /2012<br />
Closing Price (Rs.)<br />
EPS (Rs.)<br />
P/E<br />
BV per<br />
Share (Rs.)<br />
PB<br />
Mkt Cap (Rs. Crore)<br />
Beta<br />
Mkt Cap/Sales<br />
Mkt Cap/PBIDTA<br />
Mkt Cap/PBDT<br />
Mkt Cap/PAT<br />
Mkt Cap/Cash Profit<br />
PBDITA<br />
Rs. in Crores<br />
Face Value<br />
Shares<br />
Outstanding crores<br />
Equity<br />
Share capital (No.s)<br />
Share holding (%)<br />
Promoters<br />
Public<br />
FIIs<br />
Others<br />
SOURCE:CMIEE<br />
823.88<br />
46.666<br />
17.65<br />
331.711<br />
2.48<br />
240.8<br />
0.71<br />
2.09<br />
13.50<br />
15.62<br />
18.95<br />
16.69<br />
17.83<br />
10<br />
244.76<br />
29,23,0633<br />
Mar-111<br />
50.71<br />
39.555<br />
0.07<br />
9.67<br />
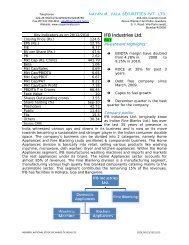
Investment Highlights:<br />
Sales up by 55% since last 5 years<br />
from 74.43cr to 115.02cr in Mar<br />
2012. CAGR<br />
of 11.49 % from 2008-<br />
2012.<br />
Dividends more than or equal to<br />
150% are regularly paid from last 5<br />
years.<br />
Almost debt free due<br />
to Cash<br />
Balance.<br />
EBIDTA and PAT margins are<br />
ncreasing every year from 2010.<br />
Promoters increased their holdings<br />
from 48.61%<br />
to 50.71%<br />
in last six<br />
Qtr.<br />
Buy Back has been done thrice in<br />
last 5 years, in 2009 the<br />
offer price<br />
was Rs 450,<br />
in 2010 the<br />
offer price<br />
was Rs 550 per share and in 2011<br />
it<br />
was Rs 900.<br />
Acquired ‘Fruitnik’ of<br />
Drink Pvt <strong>Ltd</strong> in order<br />
Siva’s Soft<br />
to grow in<br />
non<br />
carbonated<br />
beverages<br />
industry. It contributed almost 14%<br />
of sales in the year 2012.<br />
Plans to relaunch new products by<br />
December 2012 like hand sanitizer<br />
(“NO GERMS”) & Sanitary Napkins<br />
(“COMFY”)<br />
www.nayanmvala.com<br />
Pg. 1
Sales UP by 55%<br />
in last five years<br />
post change in<br />
leadership.<br />
Investment Rationale:<br />
Consistent increase in sales: Sales of the company have<br />
increased by 55% in last 5 years post change in leadership. The<br />
sales increased under the leadership of A Satish Kumar who came<br />
into effect from 25 th June 2009. Before Change in director the<br />
sales were growing at a very low rate.<br />
EARLIER LEADERSHIP<br />
(Rs. Cr) Mar ‘04 Mar ‘05 Mar‘06 Mar’07 Mar’08 CAGR (%)<br />
Net sales 68.04 66.85 70.15 72.39 74.43 2.26<br />
NEW LEADERSHIP<br />
(Rs .Cr) Mar’08 Mar’09 Mar’10 Mar’11 Ma’ 12 CAGR (%)<br />
Net sales 74.43 90.66 89.77 103.38 115.02 11.49<br />
Dividend yield is<br />
1.82%.<br />
Negligible Debt as<br />
Company has<br />
substantial Cash<br />
Balance<br />
EBIDTA Margins (<br />
excluding Other<br />
income) have<br />
increased from<br />
11.47 % to 15.5%<br />
More than 150% Dividend rate since 2008: The Company is<br />
giving un-interrupted dividend since past 5 years<br />
Percentage Mar 08 Mar 09 Mar 10 Mar 11 Mar 12<br />
Div Rate 470 170 150 150 150<br />
Borrowings: The Company increased their borrowings from<br />
1.26cr to 26.63cr from Mar 2010 to Mar 2011. The borrowings<br />
were made in order to acquire the ‘Fruitnik’ brand. Fruitnik had four<br />
percent market share in Tamil Nadu. However the company is<br />
effectively debt free due to its cash Balance of 14cr.<br />
(Rs. Cr) Mar 10 Mar 11 Mar 12<br />
Borrowings 1.26 26.63 18.91<br />
Cash bal 25.04 19.88 14.72<br />
EBIDTA and PAT Margins: Company’s EBITDA and PAT<br />
margins are growing and have shown a good increase in 2012.<br />
Particulars (Rs. Cr) Mar 09 Mar 10 Mar 11 Mar 12<br />
Total Income 178.37 97.76 108.21 115.02<br />
Net Sales 90.66 89.77 103.38 114.8<br />
Ebitda ex OI 10.4 12.22 13.1 17.84<br />
Ebidta margin ex OI (%) 11.47 13.61 12.67 15.50<br />
PAT ex OI 5.15 3.82 5.85 8.4<br />
PAT margin (%) 5.68 4.25 5.65 7.31<br />
www.nayanmvala.com<br />
Pg. 2
Promoters<br />
increased their<br />
holdings from<br />
48.61% to 50.71.<br />
Promoters increase their holdings: Promoters increased their<br />
shareholding from 48.61% to 50.71%.<br />
51<br />
50<br />
49<br />
48<br />
47<br />
48.31<br />
48.61<br />
% holding<br />
50.39<br />
50.71 50.71<br />
Mar‐11 Jun‐11 Sep‐11 Dec‐11 Mar‐12<br />
% holding<br />
Buy Back done<br />
thrice in last 5<br />
years.<br />
Acquiring Soft<br />
drink called<br />
Fruitnik which<br />
contributed to<br />
almost 14% of the<br />
total sales in<br />
2012.<br />
Buy back of shares: Buy Back has been done thrice in last 5<br />
years. In the year 2009 the offer price was Rs 450 and in year<br />
2010 the offer price was Rs 550 per share and in year 2011 it was<br />
Rs 900. Which is higher than C.M.P<br />
(Rs. Cr) Mar 08 Mar 09 Mar 10 Mar 11 Mar 12<br />
Paid up capital 3.2 3.1 3.03 3.03 2.92<br />
Acquired Fruitnik: Amrutanjan Health Care <strong>Ltd</strong> has informed<br />
BSE that the Company has entered into an agreement with M/s.<br />
Siva's Soft Drink Pvt <strong>Ltd</strong>., Chennai to acquire their soft drink and<br />
fruit based beverages business along with the brand, 'Fruitnik' for a<br />
total consideration of Rs 26.20 Crores. Fruitnik contribution to total<br />
sales was almost 14% in the year ended 2012.<br />
Areas of concern:<br />
The biggest risk facing the company today is price inflation of key raw materials. This is a<br />
broader trend that is affecting all FMCG companies resulting in margin pressure.<br />
The biggest threat going into FY 2011 is the intensive competition. Amrutanjan market share in<br />
India is about 10% which is behind Vicks 16% and Zandu Balm 12%.<br />
Upcoming products like Hand Sanitizer or Sanitary Napkins already have severe competition<br />
and penetrating the same may be difficult.<br />
Chemical business is a burden on the company as it continues to post losses since 5 years i.e.<br />
March 2008 – March 2012.<br />
Profit / Loss (Rs. Cr.) Mar-08 Mar-09 Mar-10 Mar-11 Mar-12<br />
Chemical Segment (1.65) (1.28) (3.45) (2.81) (3.43)<br />
www.nayanmvala.com<br />
Pg. 3
Company Profile:<br />
Amrutanjan Health Care <strong>Ltd</strong>, more than a century old legendary Indian brand since<br />
1893. The<br />
company is engaged in manufacturing and marketing of ayurvedic and allopathic products. The<br />
main product<br />
of the company is Amrutanjan pain balm which contributes to 80 % of sales. It<br />
has product offerings in the sectors of health care, food and medical care. The company has<br />
two health care products<br />
manufacturing units, one at Chennai and the<br />
other at Hyderabad. It<br />
also has a fine chemicals<br />
division in Tamil Nadu.<br />
Product Line<br />
of Amrutanjan healthh care <strong>Ltd</strong><br />
Product Line<br />
Pain<br />
Management<br />
Congestion<br />
management<br />
Products in<br />
purity<br />
Foods and<br />
beverages<br />
Comfy<br />
Balm<br />
Relief balm for<br />
cough<br />
No germs hand<br />
sanitizer<br />
(upcoming),<br />
Fruitnik<br />
Comfy sanitary<br />
napkins<br />
(upcoming)<br />
Aromatic Balm<br />
& Roll On<br />
Cold inhaler &<br />
mint<br />
Decorn corn<br />
caps<br />
Kitchen<br />
delights<br />
Revenue Mix: The revenue mix shows that beverages have started to sell and is almost 14% of<br />
total net saless in 2012.<br />
0%<br />
2012<br />
6%<br />
14%<br />
OTC<br />
Chemical<br />
Beverages<br />
80%<br />
Others<br />
www.nayanmvala.com<br />
Pg. 4
Quarterly Results – (Consolidated)<br />
(Rs. Crore) Source: CMIE Dec 10 Mar 11 Jun 11 Sep 11 Dec 11 Mar 12<br />
Total income 29.04 35.2 35.9 15.54 33.46 37.51<br />
Net sales 28.04 34.23 34.34 14.66 32.37 36.36<br />
Other income 1 0.97 1.56 0.88 1.09 1.15<br />
Extra-ordinary income<br />
Change in stock -1.06 1.9 0.07 -0.46 -0.01 1.5<br />
Total Expenses 24.84 33.9 30.38 14.88 29.92 34.69<br />
Cons. raw material 9.92 15.63 14.64 5.36 12.66 15.89<br />
Salaries & wages 4.01 4.49 4.52 3.5 4.41 4.31<br />
Other expenses 9.37 11.13 7.58 4.98 10.31 11.44<br />
Extra-ordinary expenses<br />
PBDIT 4.68 5.85 9.23 1.24 6.07 7.37<br />
Depreciation 0.42 0.64 0.52 0.51 0.69 0.59<br />
Interest 0.01 0.23 0.48 0.61 0.68<br />
PBT 4.26 5.2 8.48 0.25 4.77 6.1<br />
Tax 1.12 2 2.89 0.05 1.24 1.78<br />
PAT 3.14 3.2 5.59 0.2 3.53 4.32<br />
From NAYAN M. VALA SECURITIES PVT.LTD.RESEARCH<br />
By Dushant Y. Hedau & Mayur R. Nakhwa<br />
Disclaimer: The information contained herein is confidential and is intended solely for the addressee(s). Any unauthorized access; use,<br />
reproduction, disclosure or dissemination is prohibited. This information does not constitute or form part of and should not be construed as,<br />
any offer for sale or subscription of or any invitation to offer to buy or subscribe for any securities. The information and opinions on which this<br />
communication is based have been complied or arrived at from sources believed to be reliable and in good faith, but no representation or<br />
warranty, express or implied, is made as to their accuracy, correctness and are subject to change without notice. NAYAN M. VALA<br />
SECURITIES PVT.LTD. and/ or its clients may have positions in or options on the securities mentioned in this report or any related<br />
investments, may affect transactions or may buy, sell or offer to buy or sell such securities or any related investments. Recipient/s should not<br />
consider this report as only a single factor in making their investment decision. Neither NAYAN M. VALA SECURITIES PVT.LTD. nor any of<br />
its affiliates shall assume any legal liability or responsibility for any incorrect, misleading or altered information contained herein.<br />
MEMBER: NATIONAL STOCK EXCHANGE OF INDIA LTD CODE NO. 13511<br />
MEMBER: BOMBAY STOCK EXCHANGE LTD CODE NO. 6222<br />
MEMBER: THE CALCUTTA STOCK EXCHANGE ASSOCIATION LTD CODE NO. 506<br />
MEMBER: MCX-SX<br />
CODE NO.38300<br />
NAYAN M. VALA SECURITIES PVT.LTD. Tel: (+91-22) 2610 5973 / 2610 5974<br />
403-404, Cosmos Court, Fax. +91-22- 2612 4310<br />
Above Waman Hari Pethe Jewellers E-Mail: research@nayanmvala.com<br />
S. V. Road, Vile-Parle (West), Website: www.nayanmvala.com<br />
Mumbai – 400056. INDIA<br />
www.nayanmvala.com<br />
Pg. 5