Survey Design and Response Rates: - Cornell University Division of ...
Survey Design and Response Rates: - Cornell University Division of ...
Survey Design and Response Rates: - Cornell University Division of ...
Create successful ePaper yourself
Turn your PDF publications into a flip-book with our unique Google optimized e-Paper software.
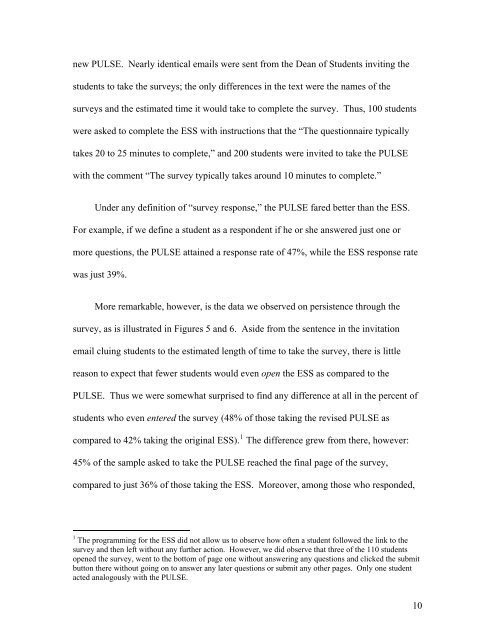
new PULSE. Nearly identical emails were sent from the Dean <strong>of</strong> Students inviting the<br />
students to take the surveys; the only differences in the text were the names <strong>of</strong> the<br />
surveys <strong>and</strong> the estimated time it would take to complete the survey. Thus, 100 students<br />
were asked to complete the ESS with instructions that the “The questionnaire typically<br />
takes 20 to 25 minutes to complete,” <strong>and</strong> 200 students were invited to take the PULSE<br />
with the comment “The survey typically takes around 10 minutes to complete.”<br />
Under any definition <strong>of</strong> “survey response,” the PULSE fared better than the ESS.<br />
For example, if we define a student as a respondent if he or she answered just one or<br />
more questions, the PULSE attained a response rate <strong>of</strong> 47%, while the ESS response rate<br />
was just 39%.<br />
More remarkable, however, is the data we observed on persistence through the<br />
survey, as is illustrated in Figures 5 <strong>and</strong> 6. Aside from the sentence in the invitation<br />
email cluing students to the estimated length <strong>of</strong> time to take the survey, there is little<br />
reason to expect that fewer students would even open the ESS as compared to the<br />
PULSE. Thus we were somewhat surprised to find any difference at all in the percent <strong>of</strong><br />
students who even entered the survey (48% <strong>of</strong> those taking the revised PULSE as<br />
compared to 42% taking the original ESS). 1 The difference grew from there, however:<br />
45% <strong>of</strong> the sample asked to take the PULSE reached the final page <strong>of</strong> the survey,<br />
compared to just 36% <strong>of</strong> those taking the ESS. Moreover, among those who responded,<br />
1 The programming for the ESS did not allow us to observe how <strong>of</strong>ten a student followed the link to the<br />
survey <strong>and</strong> then left without any further action. However, we did observe that three <strong>of</strong> the 110 students<br />
opened the survey, went to the bottom <strong>of</strong> page one without answering any questions <strong>and</strong> clicked the submit<br />
button there without going on to answer any later questions or submit any other pages. Only one student<br />
acted analogously with the PULSE.<br />
10


