Survey Design and Response Rates: - Cornell University Division of ...
Survey Design and Response Rates: - Cornell University Division of ...
Survey Design and Response Rates: - Cornell University Division of ...
Create successful ePaper yourself
Turn your PDF publications into a flip-book with our unique Google optimized e-Paper software.
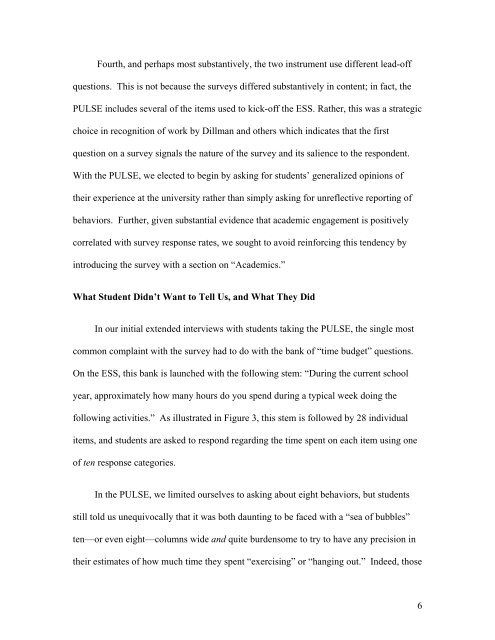
Fourth, <strong>and</strong> perhaps most substantively, the two instrument use different lead-<strong>of</strong>f<br />
questions. This is not because the surveys differed substantively in content; in fact, the<br />
PULSE includes several <strong>of</strong> the items used to kick-<strong>of</strong>f the ESS. Rather, this was a strategic<br />
choice in recognition <strong>of</strong> work by Dillman <strong>and</strong> others which indicates that the first<br />
question on a survey signals the nature <strong>of</strong> the survey <strong>and</strong> its salience to the respondent.<br />
With the PULSE, we elected to begin by asking for students’ generalized opinions <strong>of</strong><br />
their experience at the university rather than simply asking for unreflective reporting <strong>of</strong><br />
behaviors. Further, given substantial evidence that academic engagement is positively<br />
correlated with survey response rates, we sought to avoid reinforcing this tendency by<br />
introducing the survey with a section on “Academics.”<br />
What Student Didn’t Want to Tell Us, <strong>and</strong> What They Did<br />
In our initial extended interviews with students taking the PULSE, the single most<br />
common complaint with the survey had to do with the bank <strong>of</strong> “time budget” questions.<br />
On the ESS, this bank is launched with the following stem: “During the current school<br />
year, approximately how many hours do you spend during a typical week doing the<br />
following activities.” As illustrated in Figure 3, this stem is followed by 28 individual<br />
items, <strong>and</strong> students are asked to respond regarding the time spent on each item using one<br />
<strong>of</strong> ten response categories.<br />
In the PULSE, we limited ourselves to asking about eight behaviors, but students<br />
still told us unequivocally that it was both daunting to be faced with a “sea <strong>of</strong> bubbles”<br />
ten—or even eight—columns wide <strong>and</strong> quite burdensome to try to have any precision in<br />
their estimates <strong>of</strong> how much time they spent “exercising” or “hanging out.” Indeed, those<br />
6


