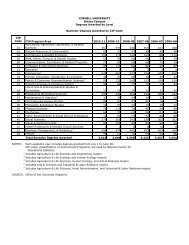
Survey Design and Response Rates: - Cornell University Division of ...
Survey Design and Response Rates: - Cornell University Division of ...
Survey Design and Response Rates: - Cornell University Division of ...

Create successful ePaper yourself
Turn your PDF publications into a flip-book with our unique Google optimized e-Paper software.
instrument may well affect the likelihood that students will choose to participate in the<br />
survey <strong>and</strong> the quality <strong>of</strong> the data we ultimately collect. Consistent with past research<br />
(e.g., Couper et al., 2001; Dillman, 2000), our study found that visual design elements –<br />
such as the borders <strong>and</strong> spacing used in questions, <strong>and</strong> the number <strong>of</strong> questions presented<br />
per page – elicited strong reactions from our pretesters. And ultimately, differences in<br />
survey length <strong>and</strong> visual design seem to have accounted for significant differences in the<br />
proportion <strong>of</strong> students responding to the original <strong>and</strong> revised versions <strong>of</strong> our survey, as<br />
well as differences in the proportion <strong>of</strong> survey questions completed. Visual design<br />
elements are most under our control when we are developing local survey instruments.<br />
Even when using externally-authored web-based instruments where the content has been<br />
predetermined, there may be opportunities for visually presenting this content in ways<br />
that can positively affect survey participation <strong>and</strong> for hosting the survey on a local<br />
domain. If so, the cost <strong>of</strong> programming such changes would seem to be well worth the<br />
potential benefits in survey response <strong>and</strong> completion rates.<br />
12