e - King Fahd University of Petroleum and Minerals
e - King Fahd University of Petroleum and Minerals
e - King Fahd University of Petroleum and Minerals

Create successful ePaper yourself
Turn your PDF publications into a flip-book with our unique Google optimized e-Paper software.
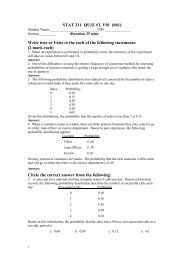
STAT 211 Business Statistics I 1<br />
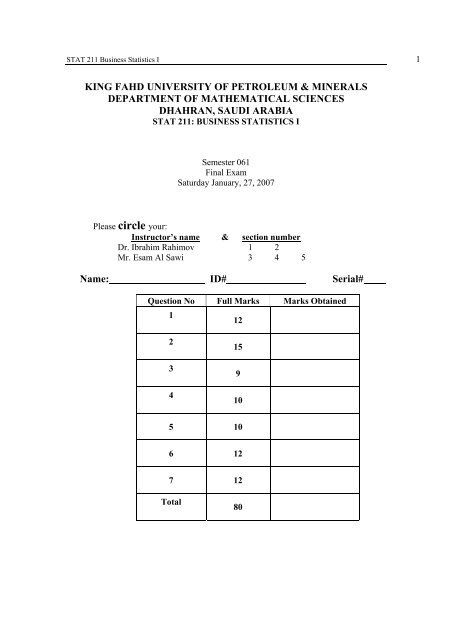
KING FAHD UNIVERSITY OF PETROLEUM & MINERALS<br />
DEPARTMENT OF MATHEMATICAL SCIENCES<br />
DHAHRAN, SAUDI ARABIA<br />
STAT 211: BUSINESS STATISTICS I<br />
Semester 061<br />
Final Exam<br />
Saturday January, 27, 2007<br />
Please circle your:<br />
Instructor’s name & section number<br />
Dr. Ibrahim Rahimov 1 2<br />
Mr. Esam Al Sawi 3 4 5<br />
Name: ID# Serial#<br />
Question No Full Marks Marks Obtained<br />
1<br />
12<br />
2<br />
3<br />
4<br />
15<br />
9<br />
10<br />
5 10<br />
6 12<br />
7 12<br />
Total<br />
80
STAT 211 Business Statistics I 2<br />
Q1. (12 pts.) True or False:<br />
STATEMENT<br />
T/F<br />
1. Statistics is the science <strong>of</strong> collecting, summarizing, analyzing, <strong>and</strong> drawing<br />
conclusions.<br />
2. The primary tools used to draw inferences in statistics are charts <strong>and</strong> graphs.<br />
3. Open-ended questions are typically included in a survey when the objective is to<br />
provide the maximum opportunity for the respondent to express his or her opinion.<br />
4. Selection bias occurs when the respondent decides which <strong>of</strong> the questions on the<br />
survey to answer.<br />
5. If stratified r<strong>and</strong>om sampling is performed correctly, one <strong>of</strong> the advantages is that<br />
the total required sample size to generate a specified level <strong>of</strong> information may be<br />
less than what would be required from a simple r<strong>and</strong>om sample.<br />
6. Cluster sampling <strong>and</strong> stratified r<strong>and</strong>om sampling are essentially the same type <strong>of</strong><br />
statistical sampling technique.<br />
7. Nominal data are typically considered to be qualitative.<br />
8. The data level that will provide the greatest flexibility when it comes to analyzing<br />
the data is nominal data.<br />
9. A variable which has all the properties <strong>of</strong> an interval variable, but also has a true<br />
zero, is a ratio level variable<br />
10. A qualitative variable can be either nominal or ordinal, but cannot be interval or<br />
ratio level.<br />
11. A small engine repair shop tracks the number <strong>of</strong> customers who call each day.<br />
This variable is a time series variable <strong>and</strong> also ratio level.<br />
12. Data collected on marital status (married, divorced, single, other) would be an<br />
ordinal level variable.
STAT 211 Business Statistics I 3<br />
For Q2, write all your choices in this table:<br />
Question<br />
Answer<br />
Q1 a b c d<br />
Q2 a b c d<br />
Q3 a b c d<br />
Q4 a b c d<br />
Q5 a b c d<br />
Q6 a b c d<br />
Q7 a b c d<br />
Q8 a b c d<br />
Q9 a b c d<br />
Q10 a b c d<br />
Q11 a b c d<br />
Q12 a b c d<br />
Q13 a b c d<br />
Q14 a b c d<br />
Q15 a b c d
STAT 211 Business Statistics I 4<br />
Q2. (15 pts.) Choose the correct answer for the flowing question:<br />
1. Consider the following chart. Which <strong>of</strong> the following statements is most correct<br />
140<br />
120<br />
100<br />
Y variable<br />
80<br />
60<br />
40<br />
20<br />
0<br />
0 5 10 15 20 25 30 35<br />
X variable<br />
a. There is a negative linear relationship between the two variables.<br />
b. There is a positive linear relationship between the two variables.<br />
c. There is a perfect linear relationship between the two variables.<br />
d. There is no apparent relationship between the two variables.<br />
2. A small company has 7 employees. The numbers <strong>of</strong> years these employees have worked for<br />
this company are shown as follows:<br />
4 14 3 16 9 8 16<br />
Based upon this information, the median number <strong>of</strong> years that employees have been with<br />
this company is:<br />
a. 9 years.<br />
b. 16 years.<br />
c. 10 years.<br />
d. None <strong>of</strong> the above.<br />
3. A sample <strong>of</strong> people who have attended a college football game at your university has a<br />
mean= 3.2 members in their family. The mode number <strong>of</strong> family members is 2 <strong>and</strong> the<br />
median number is 2.0. Based on this information:<br />
a. The population mean exceeds 3.2.<br />
b. The distribution is bell-shaped.<br />
c. The distribution is right-skewed.<br />
d. The distribution is left-skewed<br />
4. Which <strong>of</strong> the following measures is not affected by extreme values in the data<br />
a. The mean<br />
b. The median<br />
c. The range<br />
d. The st<strong>and</strong>ard deviation.
STAT 211 Business Statistics I 5<br />
5. If the age distribution <strong>of</strong> customers at a major retail chain is thought to be bell-shaped with<br />
a mean equal to 43 years <strong>and</strong> a st<strong>and</strong>ard deviation equal to 7 years, the percentage <strong>of</strong><br />
customers between the ages <strong>of</strong> 29 <strong>and</strong> 50 years is:<br />
a. Approximately 81.5.<br />
b. Approximately 68.<br />
c. At least 75.<br />
d. Approximately 95.<br />
6. A recent study in the restaurant business determined that the mean tips for male waiters per<br />
hour <strong>of</strong> work are $6.78 with a st<strong>and</strong>ard deviation <strong>of</strong> $2.11. The mean tips per hour for<br />
female waiters are $7.86 with a st<strong>and</strong>ard deviation <strong>of</strong> $2.20. Based on this information,<br />
which <strong>of</strong> the following statements do we know to be true<br />
a. The distribution <strong>of</strong> tips for both males <strong>and</strong> females is right-skewed.<br />
b. The variation in tips received by females is more variable than males.<br />
c. The median tip for females exceeds that <strong>of</strong> males.<br />
d. On a relative basis, males have more variation in tips per hour than do females.<br />
7. Which <strong>of</strong> the following statements is incorrect<br />
a. The expected value <strong>of</strong> a discrete probability distribution is the long-run average<br />
value assuming the experiment will be repeated many times.<br />
b. The st<strong>and</strong>ard deviation <strong>of</strong> a discrete probability distribution measures the average<br />
variation <strong>of</strong> the r<strong>and</strong>om variable from the mean.<br />
c. The distribution is considered uniform if all the probabilities are equal.<br />
d. The mean <strong>of</strong> the probability distribution is equal to the square root <strong>of</strong> the expected<br />
value.<br />
8. If events E <strong>and</strong> F are independent with P(E) = 0.3 <strong>and</strong> P(F) = 0.5, find P(E ∪ F).<br />
a. 0.35<br />
b. 0.65<br />
c. 0.80<br />
d. None <strong>of</strong> the above.
STAT 211 Business Statistics I 6<br />
9. The following probability distribution has been assessed for the number <strong>of</strong> accidents that<br />
occur in a mid-western city each day:<br />
Accidents Probability<br />
0 0.25<br />
1 0.20<br />
2 0.30<br />
3 0.15<br />
4 0.10<br />
Based on this probability distribution, the mean <strong>of</strong> the number <strong>of</strong> accidents per day is:<br />
a. 2.<br />
b. 0.12.<br />
c. 1.65.<br />
d. None <strong>of</strong> the above.<br />
10. A manufacturer produces thermostats, 10% <strong>of</strong> which are defective. From a production run,<br />
a sample <strong>of</strong> four thermostats is r<strong>and</strong>omly selected. Determine the probability that three <strong>of</strong><br />
the selected thermostats are defective. You may assume that the four trials are independent<br />
<strong>and</strong> that the number <strong>of</strong> defective items in the sample has a binomial distribution.<br />
a. 0.0035<br />
b. 0.0036<br />
c. 0.0037<br />
d. 0.0038<br />
11. If Z has a st<strong>and</strong>ard normal r<strong>and</strong>om variable <strong>and</strong> P(Z > a) = 0.9938, find P(a
STAT 211 Business Statistics I 7<br />
13. Which <strong>of</strong> the following statements is not consistent with the Central Limit Theorem<br />
a. The Central Limit Theorem applies without regard to the size <strong>of</strong> the sample.<br />
b. The Central Limit Theorem applies to non-normal distributions.<br />
c. The Central Limit Theorem indicates that the sampling distribution will be<br />
approximately normal.<br />
d. The Central Limit Theorem indicates that the mean <strong>of</strong> the sampling distribution will<br />
be equal to the population mean.<br />
14. A Company produces frozen French fries that are then sold to customers such as<br />
McDonald’s. The “prime” line <strong>of</strong> fries has an average length <strong>of</strong> 6.00 inches with a<br />
st<strong>and</strong>ard deviation <strong>of</strong> 0.50 inches. To make sure that company continues to meet the<br />
quality st<strong>and</strong>ard for “prime” fries, they plan to select a r<strong>and</strong>om sample <strong>of</strong> n = 100 fries<br />
each day. Yesterday, the sample mean was 6.05 inches. What is the probability that the<br />
mean would be 6.05 inches or more if they are meeting the quality st<strong>and</strong>ards<br />
a. Approximately 0.235<br />
b. Approximately 0.3413<br />
c. Approximately 0.9413<br />
d. None <strong>of</strong> the above.<br />
15. In a recent report, it was stated that the proportion <strong>of</strong> employees who carpool to their work<br />
is 0.14 <strong>and</strong> that the st<strong>and</strong>ard deviation <strong>of</strong> the sampling proportion is 0.0259. However, the<br />
report did not indicate what the sample size was. What was the sample size<br />
a. 100<br />
b. 180<br />
c. 460<br />
d. Can’t be determined without more information.
STAT 211 Business Statistics I 8<br />
Q3. (4+5=9pts.) The president <strong>of</strong> a company believes that 30% <strong>of</strong> the firm’s orders come from new<br />
customers. A sample r<strong>and</strong>om sample <strong>of</strong> 100 orders will be used to estimate the true proportion <strong>of</strong><br />
new customers. The results <strong>of</strong> the sample will be used to verify the president’s clime.<br />
a. Assume that the president is correct <strong>and</strong> P=0.30. What is the sampling distribution <strong>of</strong> p for<br />
this study<br />
b. What is the probability that the sample proportion p will be between 0.20 <strong>and</strong> 0.40<br />
----------------------------------------------------------------------------------<br />
Q4. (2+4+4=10 pts.) In an effort to estimate the mean amount spent per customer for dinner at a<br />
restaurant, data were collected for a sample <strong>of</strong> 49 customers over a three-week period. Assume that<br />
the population st<strong>and</strong>ard deviation is $2.50.<br />
a. What is the st<strong>and</strong>ard error <strong>of</strong> the mean<br />
b. At the 95% confidence, what is the margin <strong>of</strong> error<br />
c. If the sample mean is $22.6, what is the 95% confidence interval for the population mean
STAT 211 Business Statistics I 9<br />
Q5. (4+3+3=10 pts.) In the testing <strong>of</strong> a new production method 18 employees were selected<br />
r<strong>and</strong>omly <strong>and</strong> asked to try the new method. The sample mean production rate for the 18 employees<br />
was 80 parts per hour <strong>and</strong> the sample st<strong>and</strong>ard deviation was 10 parts per hour.<br />
a. Provide 95% confidence intervals for the population mean.<br />
b. Comment on your answer.<br />
c. What assumptions you made to solve the problem
STAT 211 Business Statistics I 10<br />
Q6. (2+6+4=12 pts.) CNN TV poll asked 814 adults to respond to a series <strong>of</strong> questions about their<br />
feelings toward the state <strong>of</strong> affairs within the USA. A total <strong>of</strong> 562 adults responded “Yes” to the<br />
question: “Do you feel things are going well in the United States these days”<br />
a. What is the point estimate <strong>of</strong> the proportion <strong>of</strong> the adult population who feel thing are going<br />
well in the USA<br />
b. What is the 90% confidence interval for the proportion <strong>of</strong> the adult population who feel thing<br />
are going well in the USA<br />
c. How large a sample would be necessary to estimate the true proportion <strong>of</strong> the adult who feel<br />
thing are going well in the USA within 3%, with 95% confidence Assume p =0.69.
STAT 211 Business Statistics I 11<br />
Q7. (2+6+4=12 pts.) An urban planning group is interested in estimating the difference between the<br />
mean household incomes for two neighborhoods in a large area. Independent r<strong>and</strong>om samples <strong>of</strong><br />
households in the neighborhoods provided the following results.<br />
Neighborhood 1 Neighborhood 2<br />
Sample size=8<br />
Sample size=12<br />
Sample mean=$15700 Sample mean $14500<br />
Sample St. Deviation=$700 Sample St. Deviation=850<br />
a. Find point estimate for the difference between the mean incomes in the two neighborhoods.<br />
b. Find a 95% confidence interval for the difference between the mean incomes.<br />
c. What assumptions were made to compute the interval estimate in part (b)
STAT 211 Business Statistics I 12<br />
Some Useful Formulas<br />
• Sample st<strong>and</strong>ard deviation:<br />
S<br />
⎛<br />
( x ) 2 ⎞<br />
⎜ 2 ∑<br />
2 ∑ x − ⎟<br />
∑( − )<br />
⎜ n ⎟<br />
⎝<br />
⎠ ∑<br />
x x x − nx ( )<br />
= = =<br />
n −1 n −1 n −1<br />
2 2<br />
• P( E or E ) = P( E ) + P( E ) − P( E <strong>and</strong> E )<br />
1 2 1 2 1 2<br />
• Conditional Probability: P ( E E )<br />
• Binomial: ( )<br />
• Poisson: ( )<br />
( E1<strong>and</strong><br />
E2)<br />
P ( E )<br />
P<br />
1 2 =<br />
2<br />
n!<br />
x n − x<br />
P x = pq , µ = E ( X ) = n p,<br />
σ = npq<br />
x! ( n−<br />
x!<br />
)<br />
x<br />
( λt<br />
)<br />
− t<br />
P x<br />
e λ<br />
= , µ = λt , σ = λt<br />
x !<br />
• Hyeprgeometric: P( x )<br />
• Uniform: f ( x )<br />
If a c d b<br />
=<br />
C<br />
C<br />
N − X X<br />
n−<br />
x x<br />
N<br />
n<br />
C<br />
⎧ 1<br />
⎪ if a ≤x ≤b<br />
= ⎨b<br />
− a<br />
,<br />
⎪⎩ 0 otherwise<br />
≤ < ≤ P( c≤ X ≤ d ) = ( d − c) f ( x)<br />
P 0≤ x ≤ a = 1−<br />
e − λ a<br />
• Exponential: ( )<br />
• Sampling Error = Statistics Value – Parameter Value.<br />
σ<br />
• µ x = µ , σx<br />
=<br />
n<br />
If the population is finite <strong>and</strong> sampling is without replacement σx<br />
• µ = p,<br />
σ<br />
p p<br />
p(1 − p)<br />
= ,<br />
n<br />
If the population is finite <strong>and</strong> sampling is without replacement σ =<br />
p<br />
σ N−<br />
n<br />
=<br />
n N−1<br />
p(1−<br />
p) N − n<br />
n N−1
STAT 211 Business Statistics I 13<br />
• Confidence interval estimate for µ ( σ known)<br />
x ± zα/2<br />
σ<br />
n<br />
• Confidence interval estimate for µ ( σ unknown ) x ± tα<br />
/2<br />
s<br />
n<br />
•<br />
2 2<br />
2<br />
zα/2 σ ⎛zα/2<br />
σ⎞<br />
Required sample size: n = =<br />
2 ⎜<br />
e e ⎟<br />
⎝ ⎠<br />
• Confidence interval for population proportion : p ± zα<br />
/2<br />
• Required sample size is: n =<br />
2<br />
α /2<br />
2<br />
z p(1 − p)<br />
e<br />
p(1 − p)<br />
n<br />
2 2<br />
σ1 σ2<br />
• The confidence interval for µ1 – µ2 ( ( σ1, σ<br />
2<br />
are known ) is:( x1 − x2 ) ± z α /2 +<br />
n1 n2<br />
• Ifσ1 <strong>and</strong> σ2 unknown, <strong>and</strong> we have large samples, then: The confidence interval for µ1 – µ2<br />
2 2<br />
s1 s2<br />
is:( x1 − x2 ) ± z α /2 +<br />
n1 n2<br />
• If σ1 <strong>and</strong> σ2 unknown, <strong>and</strong> small samples: ( )<br />
( − ) + ( − )<br />
1 1 2 2 2<br />
2<br />
1 1<br />
x1 − x2 ± t α /2 sp<br />
+ , where<br />
n n<br />
1 2<br />
n 1 s n 1 s<br />
sp<br />
=<br />
n1 + n2<br />
−2<br />
sd<br />
• Paired Samples: d ± t α /2<br />
n<br />
• The confidence interval for the difference between two population proportions<br />
p(1<br />
1<br />
p)<br />
1<br />
p<br />
2(1 p<br />
2)<br />
( p1 − p2) ± z − −<br />
α /2<br />
+<br />
n n<br />
1 2