True or False questions: - King Fahd University of Petroleum and ...
True or False questions: - King Fahd University of Petroleum and ...
True or False questions: - King Fahd University of Petroleum and ...

Create successful ePaper yourself
Turn your PDF publications into a flip-book with our unique Google optimized e-Paper software.
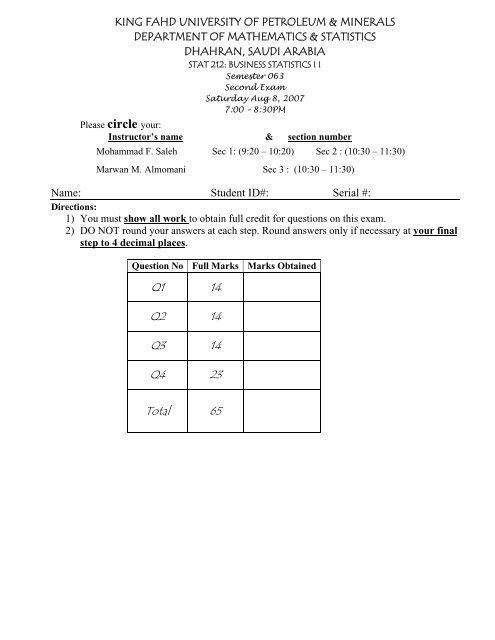
KING FAHD UNIVERSITY OF PETROLEUM & MINERALS<br />
DEPARTMENT OF MATHEMATICS & STATISTICS<br />
DHAHRAN, SAUDI ARABIA<br />
STAT 212: BUSINESS STATISTICS I I<br />
Semester 063<br />
Second Exam<br />
Saturday Aug 8, 2007<br />
7:00 – 8:30PM<br />
Please circle your:<br />
Instruct<strong>or</strong>’s name & section number<br />
Mohammad F. Saleh Sec 1: (9:20 – 10:20) Sec 2 : (10:30 – 11:30)<br />
Marwan M. Almomani Sec 3 : (10:30 – 11:30)<br />
Name: Student ID#: Serial #:<br />
Directions:<br />
1) You must show all w<strong>or</strong>k to obtain full credit f<strong>or</strong> <strong>questions</strong> on this exam.<br />
2) DO NOT round your answers at each step. Round answers only if necessary at your final<br />
step to 4 decimal places.<br />
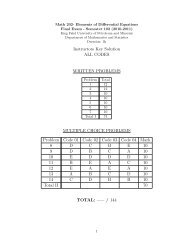
Question No Full Marks Marks Obtained<br />
Q1 14<br />
Q2 14<br />
Q3 14<br />
Q4 23<br />
Total 65
STAT 212 Business Statistics II – Term 063, Maj<strong>or</strong> 1I<br />
Question One (2+1+6+1+2+1+1 = 14 pts):<br />
Last rating period, the percentages <strong>of</strong> the viewers watching several channels between 11:00 P.M<br />
<strong>and</strong> 11:30 PM in a maj<strong>or</strong> TV market were as follows:<br />
WDUX<br />
(News)<br />
WWTY<br />
(News)<br />
WACO<br />
(Cheers Reruns)<br />
WTJW<br />
(News)<br />
Other<br />
8% 28% 20% 6% 38%<br />
And in the current rating period, a survey <strong>of</strong> 2,000 viewers gives the following:<br />
WDUX<br />
(News)<br />
WWTY<br />
(News)<br />
WACO<br />
(Cheers Reruns)<br />
WTJW<br />
(News)<br />
Other<br />
182 536 354 151 777<br />
Do you think that the viewing shares in the current rating period differ from those in the last<br />
rating period at 0.10 level <strong>of</strong> significance<br />
a. The test hypotheses are:<br />
H 0 :<br />
H A :<br />
b. The assumption is:<br />
c. The test statistic is:<br />
d. The critical value is:<br />
e. The decision rule <strong>and</strong> the decision are:<br />
f. Your conclusion is:<br />
g. Based on your decision, what type <strong>of</strong> err<strong>or</strong> you might have committed<br />
2
STAT 212 Business Statistics II – Term 063, Maj<strong>or</strong> 1I<br />
Question Two (2+7+1+2+1+1 = 14 pts):<br />
Marketers know that tastes differ in various regions <strong>of</strong> the country. In the rental car business, an<br />
industry expert has given the opinion that there are strong regional preferences <strong>of</strong> size <strong>of</strong> car <strong>and</strong><br />
quotes the following data in supp<strong>or</strong>t <strong>of</strong> the view:<br />
Region <strong>of</strong> Country<br />
N<strong>or</strong>theast Southeast N<strong>or</strong>thwest Southwest<br />
Full – size 105 120 105 70<br />
Preferred Car Type Intermediate 120 100 130 150<br />
All other 25 30 15 30<br />
Do the data supp<strong>or</strong>t the expert’s opinion at the 0.05 significance level<br />
a. The test hypotheses are:<br />
H 0 :<br />
H A :<br />
b. The test statistic is:<br />
c. The critical value is:<br />
d. The decision rule <strong>and</strong> the decision are:<br />
e. The conclusion is:<br />
f. What are other assumptions required to perf<strong>or</strong>m the test<br />
3
STAT 212 Business Statistics II – Term 063, Maj<strong>or</strong> 1I<br />
Question Three (3+3+8 = 14pts):<br />
The following table shows how many weeks a sample <strong>of</strong> 6 persons have w<strong>or</strong>ked at an<br />
automobile inspection station <strong>and</strong> the number <strong>of</strong> cars each one inspected between noon <strong>and</strong> 2<br />
P.M. on a given day:<br />
Number <strong>of</strong> cars inspected (y) 14 13 15 21 23 21<br />
Number <strong>of</strong> weeks employed (x) 1 2 5 7 9 12<br />
You have calculated some <strong>of</strong> the necessary summary inf<strong>or</strong>mation to carry out the analyses as<br />
follows:<br />
2<br />
2<br />
∑ x = 36 , ∑ x = 304 , ∑ y = 107 , ∑ y = 2001 <strong>and</strong> ∑ xy = 721<br />
a. Obtain the c<strong>or</strong>relation coefficient<br />
b. Interpret the value <strong>of</strong> the linear c<strong>or</strong>relation coefficient in terms <strong>of</strong> the linear<br />
relationship between the two variables.<br />
c. (2+2+1+2+1 = 8 pts) At 1% level <strong>of</strong> significance, do the data provide sufficient<br />
evidence to conclude that the number <strong>of</strong> weeks employed (x) <strong>and</strong> the number <strong>of</strong> cars<br />
inspected (y) are negatively linear c<strong>or</strong>related<br />
I. State the hypotheses:<br />
H 0 : vs. H A :<br />
II. The test statistic is:<br />
III. The critical value is:<br />
IV. The decision rule <strong>and</strong> the decision are:<br />
V. The conclusion is:<br />
4
STAT 212 Business Statistics II – Term 063, Maj<strong>or</strong> 1I<br />
Question Four (2+6+1+4+1+3+1+1+4 = 23 pts):<br />
A manufacturing company is interested in predicting the cost <strong>of</strong> certain product. The manager<br />
believes that there is a relationship between the cost (in Dollars) <strong>of</strong> the product <strong>and</strong> the size (in<br />
millimeter) <strong>of</strong> the product. The manager believes that he can use production size to predict the<br />
cost <strong>of</strong> the product. The following data were collected r<strong>and</strong>omly.<br />
Cost (Dollars) (y) 245 312 279 308 201 219 270 324 300 255<br />
Lot Size (x) 14 16 17 19 10 15 23 24 14 17<br />
Also, the following summary statistics is obtained by the manager to predict the cost <strong>of</strong> the<br />
product using production size.<br />
2<br />
2<br />
∑ x =169 , ∑ x = 3017 , ∑ y = 2713 , ∑ y = 751337 , ∑ xy = 46833, <strong>and</strong> SSE = 9291<br />
a. Draw a scatter diagram to verify the assumption that the relationship is linear.<br />
b. Fit a straight line to these data by the method <strong>of</strong> least squares, <strong>and</strong> draw its graph on<br />
the diagram obtained in part (a).<br />
<br />
Y = ________________ + ____________________ X<br />
5
STAT 212 Business Statistics II – Term 063, Maj<strong>or</strong> 1I<br />
c. Interpret the slope <strong>of</strong> the regression line.<br />
d. What is the percentage <strong>of</strong> the variation <strong>of</strong> the cost that explained by the variation <strong>of</strong><br />
the size<br />
e. The st<strong>and</strong>ard err<strong>or</strong> <strong>of</strong> the regression slope is:<br />
f. Construct a 95% confidence interval f<strong>or</strong> the true regression slope <strong>and</strong> interpret this<br />
interval estimate.<br />
g. Based on the C.I that you obtained in part (f), do you think that there is a significant<br />
relationship between the size <strong>and</strong> the cost <strong>of</strong> the product Explain.<br />
h. Use the regression equation that you obtained in part (b) to predict the cost <strong>of</strong> a<br />
product if the size <strong>of</strong> the lot is 19 millimeter.<br />
i. Find the 95% confidence interval f<strong>or</strong> the average <strong>of</strong> a lot <strong>of</strong> size <strong>of</strong> 19 millimeter.<br />
6