Comparison of Deconvolution Software - Biomedical Imaging Group ...
Comparison of Deconvolution Software - Biomedical Imaging Group ...
Comparison of Deconvolution Software - Biomedical Imaging Group ...

Create successful ePaper yourself
Turn your PDF publications into a flip-book with our unique Google optimized e-Paper software.
Image ProcessIng<br />
imaging-git.com/science<br />
image-processing<br />
Fig. 2: InSpeck green fluorescent<br />
bead, diameter 2.5 μm. Axial and<br />
transversal sections. Original image<br />
(a) and deconvolution results, 40<br />
iterations: HuygensPro (b), Autodeblur<br />
(c), deconvolutionLab (d).<br />
Fig. 3: Radial intensity pr<strong>of</strong>iles extracted from original and deconvolved<br />
images <strong>of</strong> an InSpeck green fluorescent bead, diameter 2.5 μm.<br />
HuygensPro and the <strong>Deconvolution</strong>Lab<br />
results, in the axial<br />
direction. To quantify the<br />
contrast enhancement, we<br />
computed the local relative<br />
contrast between the border<br />
and the center <strong>of</strong> the bead. In<br />
all the deconvolution results<br />
we pointed out contrast amelioration.<br />
This amelioration<br />
was particularly significant in<br />
AutoDeblur results.<br />
From the C. elegans images,<br />
FITC channel, we evaluated<br />
the contrast variation<br />
before and after deconvolution<br />
between adjacent microtubules<br />
(Figure 5). The contrast<br />
enhancement was<br />
particularly significant in AutoDeblur<br />
results.<br />
Quality <strong>of</strong> the Restoration,<br />
Qualitative considerations<br />
have been observed on HuygensPro<br />
results (see also fig.<br />
2). The outcomes from AutoDeblur<br />
and HuygensPro<br />
were nevertheless considered<br />
<strong>of</strong> high level and qualitatively<br />
equivalent. The results from<br />
<strong>Deconvolution</strong>Lab were generally<br />
judged fuzzier.<br />
Finally we compared the<br />
results <strong>of</strong> automatic and visual<br />
detection <strong>of</strong> spots on the C.<br />
elegans image, CY3 channel.<br />
On the non-deconvolved image<br />
the result <strong>of</strong> the automatic<br />
Fig. 4: detail from the result <strong>of</strong><br />
deconvolution (HuygensPro, 40<br />
iterations) <strong>of</strong> c. elegans image, cY3<br />
channel. The green spots illustrate<br />
the result <strong>of</strong> the automatic detection<br />
<strong>of</strong> the protein aggregates.<br />
Number <strong>of</strong> spots recognized by<br />
eyes: 64. Results <strong>of</strong> automatic<br />
detection: not-deconvolved image<br />
90, HuygensPro result 61, Autodeblur<br />
result 84, deconvolutionLab<br />
result 65.<br />
detection was not reliable, as<br />
too many local maxima were<br />
detected. The numbers <strong>of</strong><br />
spots detected on HuygensPro<br />
and <strong>Deconvolution</strong>Lab results<br />
were similar to the counting<br />
by a user (fig. 4).<br />
SNR decrease was much more<br />
significant for Parallel Iterative<br />
<strong>Deconvolution</strong> and Iterative<br />
Deconvolve 3D. Therefore<br />
these two tools appear less<br />
robust to noise.<br />
Concerning the bead acquisitions,<br />
we report the Full<br />
Width at Half Maximums<br />
(FWHMs) evaluated on intensity<br />
pr<strong>of</strong>iles extracted from<br />
the images before and after<br />
deconvolution. We always observed<br />
a reduction <strong>of</strong> the<br />
FWHMs in the results: after<br />
deconvolution the bead dimensions<br />
were closer to the<br />
original ones. This result<br />
shows how deconvolution improves<br />
resolution. The reduction<br />
<strong>of</strong> bead diameter in the<br />
deconvolved image was particularly<br />
consistent for the<br />
To evaluate the deconvolution<br />
results, we always started from<br />
a visual inspection <strong>of</strong> the data.<br />
Figure 1 depicts de-blurring<br />
and de-noise effects <strong>of</strong><br />
deconvolution. We can observe<br />
that Parallel Iterative<br />
<strong>Deconvolution</strong> and Iterative<br />
Deconvolve 3D give less good<br />
results compared to the other<br />
tools in case <strong>of</strong> highly noisy<br />
images.<br />
For a qualitative evaluation<br />
<strong>of</strong> the biological volumes<br />
restoration, six persons visually<br />
judged the deconvolution<br />
results. It emerged that the<br />
pushed contrast enhancement<br />
obtained with AutoDeblur<br />
can generate visually less<br />
realistic images, with more<br />
probable appearance <strong>of</strong> false<br />
structures. Strip-like artefacts<br />
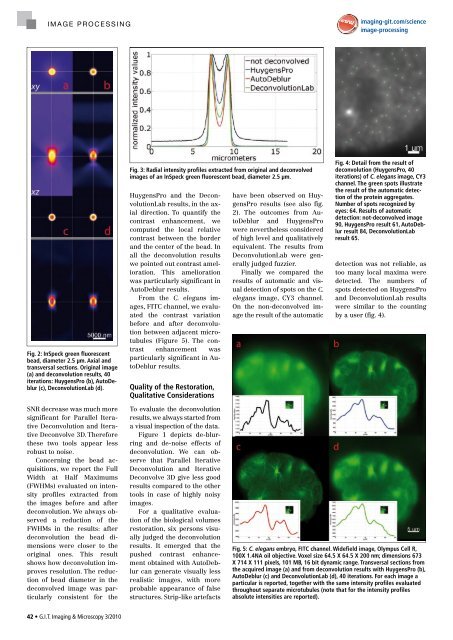
Fig. 5: c. elegans embryo, FITc channel. Widefield image, Olympus cell R,<br />
100X 1.4NA oil objective. Voxel size 64.5 X 64.5 X 200 nm; dimensions 673<br />
X 714 X 111 pixels, 101 MB, 16 bit dynamic range. Transversal sections from<br />
the acquired image (a) and from deconvolution results with HuygensPro (b),<br />
Autodeblur (c) and deconvolutionLab (d), 40 iterations. For each image a<br />
particular is reported, together with the same intensity pr<strong>of</strong>iles evaluated<br />
throughout separate microtubules (note that for the intensity pr<strong>of</strong>iles<br />
absolute intensities are reported).<br />
42 • G.I.T. <strong>Imaging</strong> & Microscopy 3/2010