PixFRET, an ImageJ plug-in for FRET calculation ... - ResearchGate
PixFRET, an ImageJ plug-in for FRET calculation ... - ResearchGate
PixFRET, an ImageJ plug-in for FRET calculation ... - ResearchGate
- No tags were found...

Create successful ePaper yourself
Turn your PDF publications into a flip-book with our unique Google optimized e-Paper software.
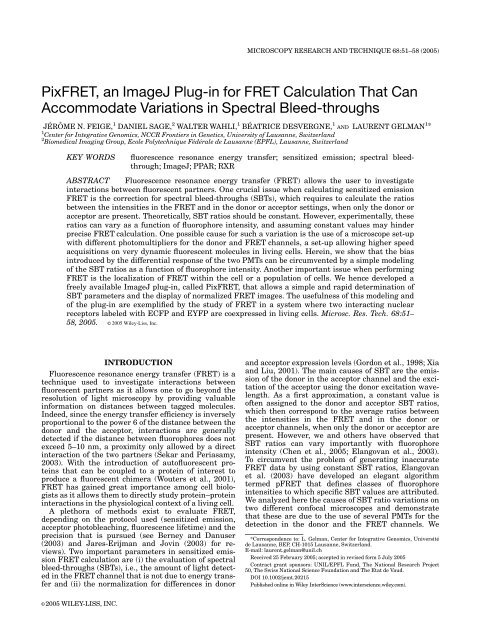
MICROSCOPY RESEARCH AND TECHNIQUE 68:51–58 (2005)<strong>Pix<strong>FRET</strong></strong>, <strong>an</strong> <strong>ImageJ</strong> Plug-<strong>in</strong> <strong>for</strong> <strong>FRET</strong> Calculation That C<strong>an</strong>Accommodate Variations <strong>in</strong> Spectral Bleed-throughsJÉRÔME N. FEIGE, 1 DANIEL SAGE, 2 WALTER WAHLI, 1 BÉATRICE DESVERGNE, 1 AND LAURENT GELMAN 1 *1 Center <strong>for</strong> Integrative Genomics, NCCR Frontiers <strong>in</strong> Genetics, University of Laus<strong>an</strong>ne, Switzerl<strong>an</strong>d2 Biomedical Imag<strong>in</strong>g Group, Ecole Polytechnique Fédérale de Laus<strong>an</strong>ne (EPFL), Laus<strong>an</strong>ne, Switzerl<strong>an</strong>dKEY WORDSfluorescence reson<strong>an</strong>ce energy tr<strong>an</strong>sfer; sensitized emission; spectral bleedthrough;<strong>ImageJ</strong>; PPAR; RXRABSTRACT Fluorescence reson<strong>an</strong>ce energy tr<strong>an</strong>sfer (<strong>FRET</strong>) allows the user to <strong>in</strong>vestigate<strong>in</strong>teractions between fluorescent partners. One crucial issue when calculat<strong>in</strong>g sensitized emission<strong>FRET</strong> is the correction <strong>for</strong> spectral bleed-throughs (SBTs), which requires to calculate the ratiosbetween the <strong>in</strong>tensities <strong>in</strong> the <strong>FRET</strong> <strong>an</strong>d <strong>in</strong> the donor or acceptor sett<strong>in</strong>gs, when only the donor oracceptor are present. Theoretically, SBT ratios should be const<strong>an</strong>t. However, experimentally, theseratios c<strong>an</strong> vary as a function of fluorophore <strong>in</strong>tensity, <strong>an</strong>d assum<strong>in</strong>g const<strong>an</strong>t values may h<strong>in</strong>derprecise <strong>FRET</strong> <strong>calculation</strong>. One possible cause <strong>for</strong> such a variation is the use of a microscope set-upwith different photomultipliers <strong>for</strong> the donor <strong>an</strong>d <strong>FRET</strong> ch<strong>an</strong>nels, a set-up allow<strong>in</strong>g higher speedacquisitions on very dynamic fluorescent molecules <strong>in</strong> liv<strong>in</strong>g cells. Here<strong>in</strong>, we show that the bias<strong>in</strong>troduced by the differential response of the two PMTs c<strong>an</strong> be circumvented by a simple model<strong>in</strong>gof the SBT ratios as a function of fluorophore <strong>in</strong>tensity. Another import<strong>an</strong>t issue when per<strong>for</strong>m<strong>in</strong>g<strong>FRET</strong> is the localization of <strong>FRET</strong> with<strong>in</strong> the cell or a population of cells. We hence developed afreely available <strong>ImageJ</strong> <strong>plug</strong>-<strong>in</strong>, called <strong>Pix<strong>FRET</strong></strong>, that allows a simple <strong>an</strong>d rapid determ<strong>in</strong>ation ofSBT parameters <strong>an</strong>d the display of normalized <strong>FRET</strong> images. The usefulness of this model<strong>in</strong>g <strong>an</strong>dof the <strong>plug</strong>-<strong>in</strong> are exemplified by the study of <strong>FRET</strong> <strong>in</strong> a system where two <strong>in</strong>teract<strong>in</strong>g nuclearreceptors labeled with ECFP <strong>an</strong>d EYFP are coexpressed <strong>in</strong> liv<strong>in</strong>g cells. Microsc. Res. Tech. 68:51–58, 2005. VC 2005 Wiley-Liss, Inc.INTRODUCTIONFluorescence reson<strong>an</strong>ce energy tr<strong>an</strong>sfer (<strong>FRET</strong>) is atechnique used to <strong>in</strong>vestigate <strong>in</strong>teractions betweenfluorescent partners as it allows one to go beyond theresolution of light microscopy by provid<strong>in</strong>g valuable<strong>in</strong><strong>for</strong>mation on dist<strong>an</strong>ces between tagged molecules.Indeed, s<strong>in</strong>ce the energy tr<strong>an</strong>sfer efficiency is <strong>in</strong>verselyproportional to the power 6 of the dist<strong>an</strong>ce between thedonor <strong>an</strong>d the acceptor, <strong>in</strong>teractions are generallydetected if the dist<strong>an</strong>ce between fluorophores does notexceed 5–10 nm, a proximity only allowed by a direct<strong>in</strong>teraction of the two partners (Sekar <strong>an</strong>d Periasamy,2003). With the <strong>in</strong>troduction of autofluorescent prote<strong>in</strong>sthat c<strong>an</strong> be coupled to a prote<strong>in</strong> of <strong>in</strong>terest toproduce a fluorescent chimera (Wouters et al., 2001),<strong>FRET</strong> has ga<strong>in</strong>ed great import<strong>an</strong>ce among cell biologistsas it allows them to directly study prote<strong>in</strong>–prote<strong>in</strong><strong>in</strong>teractions <strong>in</strong> the physiological context of a liv<strong>in</strong>g cell.A plethora of methods exist to evaluate <strong>FRET</strong>,depend<strong>in</strong>g on the protocol used (sensitized emission,acceptor photobleach<strong>in</strong>g, fluorescence lifetime) <strong>an</strong>d theprecision that is pursued (see Berney <strong>an</strong>d D<strong>an</strong>user(2003) <strong>an</strong>d Jares-Erijm<strong>an</strong> <strong>an</strong>d Jov<strong>in</strong> (2003) <strong>for</strong> reviews).Two import<strong>an</strong>t parameters <strong>in</strong> sensitized emission<strong>FRET</strong> <strong>calculation</strong> are (i) the evaluation of spectralbleed-throughs (SBTs), i.e., the amount of light detected<strong>in</strong> the <strong>FRET</strong> ch<strong>an</strong>nel that is not due to energy tr<strong>an</strong>sfer<strong>an</strong>d (ii) the normalization <strong>for</strong> differences <strong>in</strong> donor<strong>an</strong>d acceptor expression levels (Gordon et al., 1998; Xia<strong>an</strong>d Liu, 2001). The ma<strong>in</strong> causes of SBT are the emissionof the donor <strong>in</strong> the acceptor ch<strong>an</strong>nel <strong>an</strong>d the excitationof the acceptor us<strong>in</strong>g the donor excitation wavelength.As a first approximation, a const<strong>an</strong>t value isoften assigned to the donor <strong>an</strong>d acceptor SBT ratios,which then correspond to the average ratios betweenthe <strong>in</strong>tensities <strong>in</strong> the <strong>FRET</strong> <strong>an</strong>d <strong>in</strong> the donor oracceptor ch<strong>an</strong>nels, when only the donor or acceptor arepresent. However, we <strong>an</strong>d others have observed thatSBT ratios c<strong>an</strong> vary import<strong>an</strong>tly with fluorophore<strong>in</strong>tensity (Chen et al., 2005; El<strong>an</strong>gov<strong>an</strong> et al., 2003).To circumvent the problem of generat<strong>in</strong>g <strong>in</strong>accurate<strong>FRET</strong> data by us<strong>in</strong>g const<strong>an</strong>t SBT ratios, El<strong>an</strong>gov<strong>an</strong>et al. (2003) have developed <strong>an</strong> eleg<strong>an</strong>t algorithmtermed p<strong>FRET</strong> that def<strong>in</strong>es classes of fluorophore<strong>in</strong>tensities to which specific SBT values are attributed.We <strong>an</strong>alyzed here the causes of SBT ratio variations ontwo different confocal microscopes <strong>an</strong>d demonstratethat these are due to the use of several PMTs <strong>for</strong> thedetection <strong>in</strong> the donor <strong>an</strong>d the <strong>FRET</strong> ch<strong>an</strong>nels. We*Correspondence to: L. Gelm<strong>an</strong>, Center <strong>for</strong> Integrative Genomics, Universitéde Laus<strong>an</strong>ne, BEP, CH-1015 Laus<strong>an</strong>ne, Switzerl<strong>an</strong>d.E-mail: laurent.gelm<strong>an</strong>@unil.chReceived 25 February 2005; accepted <strong>in</strong> revised <strong>for</strong>m 5 July 2005Contract gr<strong>an</strong>t sponsors: UNIL/EPFL Fund, The National Research Project50, The Swiss National Science Foundation <strong>an</strong>d The Etat de Vaud.DOI 10.1002/jemt.20215Published onl<strong>in</strong>e <strong>in</strong> Wiley InterScience (www.<strong>in</strong>terscience.wiley.com).VC 2005 WILEY-LISS, INC.
52 J.N. FEIGE ET AL.thereafter show that a simple model<strong>in</strong>g to estimatethese SBT ratios as a function of <strong>in</strong>tensity greatlyimproves the accuracy of <strong>FRET</strong> <strong>calculation</strong>.Another import<strong>an</strong>t <strong>in</strong>terest <strong>for</strong> biologists when <strong>an</strong>alyz<strong>in</strong>g<strong>FRET</strong> <strong>in</strong> liv<strong>in</strong>g cells concerns the location of the<strong>in</strong>teraction studied with<strong>in</strong> the cell or the cell population.We report here the development of <strong>an</strong> <strong>ImageJ</strong><strong>plug</strong>-<strong>in</strong>, called ‘‘<strong>Pix<strong>FRET</strong></strong>,’’ which allows one to calculate<strong>an</strong>d display <strong>FRET</strong> directly on images by per<strong>for</strong>m<strong>in</strong>ga pixel-by-pixel <strong>an</strong>alysis of images <strong>an</strong>d assist<strong>in</strong>g <strong>in</strong>the determ<strong>in</strong>ation of SBTs.The usefulness of the model<strong>in</strong>g of SBT ratios <strong>an</strong>d ofthe pix<strong>FRET</strong> <strong>plug</strong>-<strong>in</strong> is exemplified us<strong>in</strong>g the enh<strong>an</strong>cedcy<strong>an</strong> <strong>an</strong>d yellow fluorescent prote<strong>in</strong>s (ECFP <strong>an</strong>dEYFP), the <strong>FRET</strong> pair which is today the most widelyused by biologists to study <strong>in</strong>teractions of prote<strong>in</strong>s <strong>in</strong>liv<strong>in</strong>g cells, fused to each partner of a well-establishedheterodimer: the peroxisome proliferator-activatedreceptor (PPAR) <strong>an</strong>d the ret<strong>in</strong>oid X receptor (RXR)(Feige et al., 2005).MATERIALS AND METHODSPlasmid Constructs <strong>an</strong>d ReagentscDNAs encod<strong>in</strong>g mouse PPARa as well as RXRa weresubcloned after PCR amplification <strong>in</strong>to the pEYFP-N1<strong>an</strong>d pECFP-N1 plasmids (BD Biosciences Clontech,Switzerl<strong>an</strong>d) as described previously (Feige et al., 2005).The ECFP–DEVD–EYFP construct <strong>an</strong>d GI262570-FITCwere k<strong>in</strong>d gifts of Dr. J.M. Tavaré (Rehm et al., 2002)<strong>an</strong>d Dr. Peterson (DeGrazia et al., 2003), respectively.Cell Culture <strong>an</strong>d Tr<strong>an</strong>sient Tr<strong>an</strong>sfection AssaysCos-7 cells were ma<strong>in</strong>ta<strong>in</strong>ed <strong>in</strong> Dulbecco’s modifiedEagle’s medium supplemented with 10% fetal calfserum (Gibco/Invitrogen, Switzerl<strong>an</strong>d). Penicill<strong>in</strong> <strong>an</strong>dstreptomyc<strong>in</strong> (Gibco) were added to the media at 100units/ml <strong>an</strong>d 100 lg/ml, respectively.Tr<strong>an</strong>sient tr<strong>an</strong>sfection assays were per<strong>for</strong>med us<strong>in</strong>gLipofectam<strong>in</strong>e 2000 (Invitrogen, Switzerl<strong>an</strong>d). Cellswere plated <strong>in</strong> 4-well LabTek chambered coverglasses(Nunc) <strong>for</strong> microscopy studies.Confocal Imag<strong>in</strong>gLive cells grown on LabTek chambered coverglasseswere washed once with phenol red free Optimemmedium (Gibco) <strong>an</strong>d observed <strong>in</strong> the same medium.Observations were per<strong>for</strong>med at 378C on a TCS SP2AOBS confocal microscope (Leica, Germ<strong>an</strong>y) equippedwith four photomultipliers (PMTs) <strong>an</strong>d with a wholemicroscope<strong>in</strong>cubator (Life Imag<strong>in</strong>g Service, Switzerl<strong>an</strong>d).Additional experiments were per<strong>for</strong>med on <strong>an</strong>LSM510 Meta confocal microscope, us<strong>in</strong>g the Metaarray of PMTs (Zeiss, Germ<strong>an</strong>y), <strong>an</strong>d on <strong>an</strong> OlympusIX70 wide-field microscope equipped with a PolychromeII monochromator (Photonics, USA) set at420 nm, a Zeiss 488027 filter set (Ex BP 410/16 þ 489/22 – Em BP 456/17 þ 535/44) or <strong>an</strong> Olympus YFP filterset (BP535/30) <strong>an</strong>d <strong>an</strong> Imago charge-coupled device(CCD) camera (Photonics, USA). Acquisitions were per<strong>for</strong>medwith a 63X/NA 1.2 water or a 63X/NA 1.4 oilimmersion objective. Qu<strong>an</strong>tification of images was per<strong>for</strong>medus<strong>in</strong>g either the Leica Confocal Software (LCS)version 2.4 or <strong>ImageJ</strong> version 1.33.For <strong>FRET</strong> experiments, tr<strong>an</strong>sfections were per<strong>for</strong>medas described above <strong>an</strong>d expression levels ofdonor <strong>an</strong>d acceptor prote<strong>in</strong>s were adjusted to similarlevels by Western blot. Unless otherwise stated, thethree different sett<strong>in</strong>gs used <strong>for</strong> the <strong>an</strong>alysis of <strong>FRET</strong>with the CFP/YFP pair were (i) <strong>FRET</strong>: Ex 405 nm/Em525–545 nm, (ii) CFP: Ex 405 nm/Em 465–485 nm, (iii)YFP: Ex 514 nm/Em 525–545 nm. Laser power <strong>an</strong>ddetector ga<strong>in</strong> were adjusted <strong>in</strong> the different ch<strong>an</strong>nels<strong>in</strong> order to observe equimolar concentrations of CFP<strong>an</strong>d YFP at equal <strong>in</strong>tensities (equimolar concentrationsof CFP <strong>an</strong>d YFP were obta<strong>in</strong>ed by express<strong>in</strong>g a referencefusion prote<strong>in</strong> of CFP <strong>an</strong>d YFP spaced by 475 residues).The <strong>an</strong>alysis of <strong>FRET</strong> with the FITC/Cy3 pairwas per<strong>for</strong>med with the follow<strong>in</strong>g sett<strong>in</strong>gs: (i) <strong>FRET</strong>:Ex 488 nm/Em 565–585 nm, (ii) FITC: Ex 488 nm/Em510–530 nm, (iii) Cy3: Ex 514 nm/Em 565–585 nm. Sett<strong>in</strong>gswere kept unch<strong>an</strong>ged <strong>for</strong> <strong>an</strong>alysis of all samples.Unless otherwise stated, donor emission was detectedon the photomultiplier 1 (PMT1) <strong>an</strong>d acceptor <strong>an</strong>d<strong>FRET</strong> emissions were recorded on PMT2. Donor <strong>an</strong>dacceptor SBTs <strong>in</strong> the <strong>FRET</strong> sett<strong>in</strong>g were determ<strong>in</strong>ed oncells express<strong>in</strong>g the donor or the acceptor alone bycalculat<strong>in</strong>g the <strong>in</strong>tensity (I) ratios <strong>in</strong> the appropriatesett<strong>in</strong>gs (I <strong>FRET</strong> /I Donor <strong>an</strong>d I <strong>FRET</strong> /I Acceptor , respectively).L<strong>in</strong>ear <strong>an</strong>d exponential fits were per<strong>for</strong>med us<strong>in</strong>gMicrosoft Excel <strong>an</strong>d F<strong>in</strong>dGraph, respectively. <strong>FRET</strong>measured <strong>in</strong> coexpress<strong>in</strong>g cells was then corrected <strong>for</strong>SBTs <strong>an</strong>d normalized (N<strong>FRET</strong>) <strong>for</strong> expression levelsaccord<strong>in</strong>g to the follow<strong>in</strong>g <strong>for</strong>mula (Xia <strong>an</strong>d Liu, 2001):N<strong>FRET</strong> ¼ I <strong>FRET</strong> I Donor 3 BT Donor I Acceptor 3 BT AcceptorpffiffiffiffiffiffiffiffiffiffiffiffiffiffiffiffiffiffiffiffiffiffiffiffiffiffiffiffiffiffiffiffiffiffiI Donor 3 I AcceptorProgram <strong>for</strong> the Plug-<strong>in</strong>The program <strong>Pix<strong>FRET</strong></strong> presented <strong>in</strong> this paper is a<strong>plug</strong>-<strong>in</strong> of the public-doma<strong>in</strong> software <strong>ImageJ</strong>. <strong>ImageJ</strong>is a general-purpose image-process<strong>in</strong>g program; it isthe Java offspr<strong>in</strong>g of the NIH Image software. As aresult, it c<strong>an</strong> run on <strong>an</strong>y plat<strong>for</strong>m with a Java VirtualMach<strong>in</strong>e (Mac<strong>in</strong>tosh, W<strong>in</strong>dows, Unix, etc.). The application<strong>an</strong>d its source are available at http://rsb.<strong>in</strong>fo.nih.gov/ij/. <strong>Pix<strong>FRET</strong></strong> is freely available at http://www.unil.ch/cig/page16989.html.RESULTSSBT Ratios C<strong>an</strong> Vary as a Functionof Fluorophore IntensityTo study <strong>FRET</strong> <strong>in</strong> liv<strong>in</strong>g cells, we chose two nuclearreceptors previously shown to <strong>for</strong>m heterodimers <strong>in</strong>vitro <strong>an</strong>d <strong>in</strong> vivo, PPAR <strong>an</strong>d RXR that were, respectively,fused to ECFP (donor) <strong>an</strong>d EYFP (acceptor)(Feige et al., 2005).An import<strong>an</strong>t parameter <strong>in</strong> <strong>FRET</strong> experiments is theamount of SBT between ch<strong>an</strong>nels. To estimate SBTs,average fluorescence <strong>in</strong>tensities <strong>in</strong> cells express<strong>in</strong>gonly the donor (or the acceptor) were qu<strong>an</strong>tified, both<strong>in</strong> the <strong>FRET</strong> <strong>an</strong>d <strong>in</strong> the donor (or acceptor) ch<strong>an</strong>nels.The ratios between the fluorescence <strong>in</strong>tensities <strong>in</strong> eachch<strong>an</strong>nel were calculated after background subtraction.In cells express<strong>in</strong>g PPAR-CFP alone, the donor SBTratio, def<strong>in</strong>ed as the ratio between the amount of light
<strong>Pix<strong>FRET</strong></strong>: AN IMAGEJ PLUG-IN FOR PIXEL-BY-PIXEL ANALYSIS OF <strong>FRET</strong>53Fig. 1. The donor bleed-through ratio <strong>in</strong>creases with donor <strong>in</strong>tensity.A: Cos-7 cells were tr<strong>an</strong>sfected with <strong>an</strong> expression vector <strong>for</strong>PPARa-ECFP. Fluorescence <strong>in</strong>tensity <strong>in</strong> the ECFP (Exc. 405 nm/Em.465–485 nm, PMT1) <strong>an</strong>d <strong>FRET</strong> (Exc. 405 nm/Em. 525–545 nm,PMT2) sett<strong>in</strong>gs was measured on at least 300 cells. The SBT ratio isthe ratio between the average <strong>FRET</strong> <strong>an</strong>d ECFP <strong>in</strong>tensities measured<strong>in</strong> <strong>in</strong>dividual cells. F CFP <strong>an</strong>d CFP CFP are the <strong>in</strong>tensities measured <strong>in</strong>the <strong>FRET</strong> <strong>an</strong>d CFP sett<strong>in</strong>gs, respectively, when only CFP is present.B: Liv<strong>in</strong>g Cos-7 cells were <strong>in</strong>cubated with GI262570-FITC. Fluorescence<strong>in</strong>tensity <strong>in</strong> the FITC (Exc. 488 nm/Em. 510–530 nm, PMT1)<strong>an</strong>d <strong>FRET</strong> (Exc. 488 nm/Em. 565–585 nm, PMT2) sett<strong>in</strong>gs was measuredon at least 100 cells. The SBT ratio is the ratio between the average<strong>FRET</strong> <strong>an</strong>d FITC <strong>in</strong>tensities measured <strong>in</strong> <strong>in</strong>dividual cells.emitted by the donor <strong>in</strong> the <strong>FRET</strong> ch<strong>an</strong>nel (F CFP ) <strong>an</strong>d<strong>in</strong> the donor ch<strong>an</strong>nel (CFP CFP ), was not const<strong>an</strong>t <strong>an</strong>d<strong>in</strong>creased with CFP <strong>in</strong>tensity (Fig. 1A). To underst<strong>an</strong>dthe causes of such <strong>an</strong> <strong>in</strong>crease, we tested several possiblefactors. Photobleach<strong>in</strong>g or photoconversion of thefluorophores was not <strong>in</strong>volved as no modification of therelationship between the CFP SBT ratio <strong>an</strong>d CFP<strong>in</strong>tensity was observed after 60 sc<strong>an</strong>s of the specimenor after sc<strong>an</strong>n<strong>in</strong>g with full laser power (data notshown). We then tested whether this phenomenon wasdependent on the type of fluorophore used by test<strong>in</strong>gthe SBT of FITC. Liv<strong>in</strong>g cells were <strong>in</strong>cubated with thePPAR lig<strong>an</strong>d GI262570 coupled to FITC, which accumulates<strong>in</strong> cellular membr<strong>an</strong>es <strong>an</strong>d <strong>in</strong> nuclei. Interest<strong>in</strong>gly,when GI262570-FITC was used as a <strong>FRET</strong> donorwith Cy3, the donor SBT ratio also varied with FITC<strong>in</strong>tensity (Fig. 1B).To determ<strong>in</strong>e if the fluctuations of SBTs were due toour <strong>in</strong>strumentation (Leica TCS SP2 AOBS), we per<strong>for</strong>medthe same experiment with different microscopes.When PPAR-CFP SBT was <strong>an</strong>alyzed on a ZeissLSM510 Meta confocal microscope, us<strong>in</strong>g the Metaarray of PMTs, a very similar <strong>in</strong>crease was observedwhen the SBT ratio was plotted as a function of fluorophore<strong>in</strong>tensity. However, this donor SBT ratio wasconst<strong>an</strong>t on a wide-field microscope us<strong>in</strong>g a CCD camera(data not shown). It there<strong>for</strong>e appeared that thedependency of the SBT ratio on fluorophore <strong>in</strong>tensitywas restricted to confocal microscopes. To further identifythe possible causes lead<strong>in</strong>g to this variation, wetested the impact of laser power <strong>an</strong>d PMT ga<strong>in</strong> on SBTratio variations. Variations of CFP SBT ratios were stillobserved when the laser was tuned from 15% to 75% ofits maximum power (data not shown). We then <strong>an</strong>alyzedSBT ratios with four different sett<strong>in</strong>gs where thega<strong>in</strong>s of the PMTs used <strong>for</strong> the detection <strong>in</strong> the donor<strong>an</strong>d <strong>FRET</strong> ch<strong>an</strong>nels were set to different voltages.Laser power was adjusted to allow the <strong>an</strong>alysis of thesame batch of cells with each sett<strong>in</strong>g (Fig. 2A). Interest<strong>in</strong>gly,although the CFP SBT ratio was <strong>in</strong>dependentFig. 2. Influence of PMT ga<strong>in</strong> on the relationship between ECFPSBT ratio <strong>an</strong>d ECFP <strong>in</strong>tensity. Cos-7 cells were tr<strong>an</strong>sfected with <strong>an</strong>expression vector <strong>for</strong> PPARa-ECFP. Fluorescence <strong>in</strong>tensity <strong>in</strong> theECFP <strong>an</strong>d <strong>FRET</strong> sett<strong>in</strong>gs was measured on at least 100 cells per condition.The percentage of SBT is the ratio between the average <strong>FRET</strong><strong>an</strong>d ECFP <strong>in</strong>tensities measured <strong>in</strong> <strong>in</strong>dividual cells. A: The ga<strong>in</strong> <strong>an</strong>dlaser power were set as <strong>in</strong>dicated us<strong>in</strong>g PMT1 <strong>an</strong>d PMT2 <strong>for</strong> ECFP(465–485 nm) <strong>an</strong>d <strong>FRET</strong> (525–545 nm) detection, respectively. B: Thega<strong>in</strong> <strong>an</strong>d laser power were set as <strong>in</strong>dicated us<strong>in</strong>g PMT2 both <strong>for</strong> ECFP<strong>an</strong>d <strong>FRET</strong> detection.of CFP <strong>in</strong>tensity at low PMT ga<strong>in</strong>s (500 V donor/530V<strong>FRET</strong>), this ratio <strong>in</strong>creased with CFP <strong>in</strong>tensity athigher ga<strong>in</strong>s. Similar results were obta<strong>in</strong>ed when onlythe donor or the <strong>FRET</strong> ga<strong>in</strong> were ch<strong>an</strong>ged, or whenboth ga<strong>in</strong>s were ch<strong>an</strong>ged <strong>an</strong>d laser power was kept const<strong>an</strong>t(data not shown).These results suggested that problems <strong>in</strong> PMT l<strong>in</strong>earitycould account <strong>for</strong> the observed dependency ofSBT ratios on fluorophore <strong>in</strong>tensity. While it is moreconvenient to use two different PMTs <strong>for</strong> the detection<strong>in</strong> the donor <strong>an</strong>d <strong>FRET</strong> ch<strong>an</strong>nels, we <strong>in</strong>vestigatedwhether the phenomenon could also be observed withone PMT only. When the same PMT was used <strong>for</strong> boththe donor <strong>an</strong>d <strong>FRET</strong> ch<strong>an</strong>nels, the SBT ratio was con-
54 J.N. FEIGE ET AL.Fig. 3. The ECFP SBT ratio c<strong>an</strong> be fitted as a function of ECFP<strong>in</strong>tensity. The data from Figure 1 were fitted with a l<strong>in</strong>ear (A) or <strong>an</strong>exponential (B) model.st<strong>an</strong>t, irrespective of the ga<strong>in</strong> applied to the PMT(Fig. 2B). This result suggests that the variations observedwith the set-up with two PMTs, or with the arrayof PMTs, reflect a differential response of the PMTs.Improv<strong>in</strong>g <strong>FRET</strong> Calculation by Model<strong>in</strong>g SBTRatios as a Function of Fluorophore IntensityTo circumvent the problem of SBT variation, us<strong>in</strong>g aunique PMT both <strong>for</strong> the detection of the donor <strong>an</strong>d ofthe acceptor seems there<strong>for</strong>e to be the best solution.However, this imposes to acquire the three ch<strong>an</strong>nelssequentially because of mech<strong>an</strong>ical movement of thePMT, a time-consum<strong>in</strong>g process that is not compatiblewith the <strong>FRET</strong> <strong>an</strong>alysis of rapidly diffus<strong>in</strong>g complexes.El<strong>an</strong>gov<strong>an</strong> et al. (2003) have already reported thevariation of SBT ratios as a function of fluorophore<strong>in</strong>tensity <strong>an</strong>d proposed <strong>an</strong> eleg<strong>an</strong>t but only commerciallyavailable algorithm to tackle this problem. Alternately,we propose <strong>an</strong> easily applicable method thatconsists <strong>in</strong> model<strong>in</strong>g SBT ratios as a function of fluorophore<strong>in</strong>tensity. For the problem reported here<strong>in</strong>, theCFP SBT ratio c<strong>an</strong> be fitted as a function of CFP <strong>in</strong>tensityeither with a l<strong>in</strong>ear or <strong>an</strong> exponential model(Fig. 3). These models are then used to estimate theSBT ratio correspond<strong>in</strong>g to each donor <strong>in</strong>tensity <strong>an</strong>dc<strong>an</strong> be implemented <strong>in</strong> the N<strong>FRET</strong> <strong>for</strong>mula describedby Xia <strong>an</strong>d Liu (2001) as follows:where F, CFP, <strong>an</strong>d YFP are the <strong>in</strong>tensities measuredwith the <strong>FRET</strong>, CFP, <strong>an</strong>d YFP sett<strong>in</strong>gs (correspond toF, D, <strong>an</strong>d A <strong>in</strong> the nomenclature proposed by Gordonet al. (1998)), a <strong>an</strong>d b are the average donor <strong>an</strong>dacceptor SBT ratios, <strong>an</strong>d c, d, e, f, <strong>an</strong>d g are the const<strong>an</strong>tsdeterm<strong>in</strong>ed by the fitt<strong>in</strong>g of the SBT ratio,accord<strong>in</strong>g to Figure 3.To validate this approach, the three <strong>FRET</strong> <strong>calculation</strong>methods have then been compared with the sameset of data (Fig. 4). Cells were tr<strong>an</strong>sfected with expressionvectors <strong>for</strong> ECFP <strong>an</strong>d EYFP (negative control),ECFP fused to EYFP (positive control), or PPAR-ECFP<strong>an</strong>d RXR-EYFP. The three <strong>for</strong>mulas give similar results<strong>for</strong> both the positive <strong>an</strong>d negative <strong>FRET</strong> controls as,under these experimental conditions, variations betweencells are small <strong>an</strong>d all fluorescence <strong>in</strong>tensities are close tothe average of the population used to calculate SBT ratios(Fig. 4A). The l<strong>in</strong>N<strong>FRET</strong> values are slightly higherbecause of the underestimation of the ECFP SBT <strong>for</strong> bothlow <strong>an</strong>d high ECFP <strong>in</strong>tensities (see Fig. 3A). The mostdramatic effect is seen when N<strong>FRET</strong> is calculated <strong>for</strong> the<strong>in</strong>teraction between the two nuclear receptors. Indeed,the more accurate l<strong>in</strong>N<strong>FRET</strong> <strong>an</strong>d expN<strong>FRET</strong> <strong>calculation</strong>ssignific<strong>an</strong>tly reduce st<strong>an</strong>dard deviation, with amore pronounced effect <strong>for</strong> expN<strong>FRET</strong>. To better characterizethe reduction of the variability of the measurementswhen model<strong>in</strong>g SBT ratios, we plotted the differencebetween expN<strong>FRET</strong> or l<strong>in</strong>N<strong>FRET</strong> <strong>an</strong>d N<strong>FRET</strong> as afunction of fluorophore <strong>in</strong>tensity (Fig. 4B). In both cases,the highest variation was observed <strong>for</strong> extreme ECFPvalues <strong>for</strong> which us<strong>in</strong>g <strong>an</strong> average SBT ratio leads to agreat under- or overestimation of the correction factor(Figs. 4B <strong>an</strong>d 4C). The results obta<strong>in</strong>ed with l<strong>in</strong>N<strong>FRET</strong><strong>an</strong>d expN<strong>FRET</strong> are hence not only more precise, but alsoimprove the statistical properties of the data, allow<strong>in</strong>gthe user to compare more accurately mild ch<strong>an</strong>ges. Wealso tried to fit the donor SBT with a second order polynomialmodel rather th<strong>an</strong> <strong>an</strong> exponential growth, but thismodel greatly overestimates SBT values when donor<strong>in</strong>tensities are very low or very high (data not shown).Pixel-by-Pixel <strong>FRET</strong> Analysis <strong>an</strong>d VisualizationCells are highly org<strong>an</strong>ized <strong>an</strong>d prote<strong>in</strong> distributionas well as <strong>in</strong>teractions are often limited to specific compartments.It is hence crucial <strong>for</strong> biologists to be able tomap <strong>in</strong>teractions with precision with<strong>in</strong> a cell or a populationof cells to better underst<strong>an</strong>d the spatial org<strong>an</strong>izationof cellular activities. We there<strong>for</strong>e developed <strong>an</strong><strong>ImageJ</strong> <strong>plug</strong>-<strong>in</strong> called ‘‘<strong>Pix<strong>FRET</strong></strong>’’ that allows one togenerate normalized <strong>FRET</strong> images, by comput<strong>in</strong>g pixelN<strong>FRET</strong> ¼ F CFPþYFP CFP CFPþYFP 3 a YFP CFPþYFP 3 bpffiffiffiffiffiffiffiffiffiffiffiffiffiffiffiffiffiffiffiffiffiffiffiffiffiffiffiffiffiffiffiffiffiffiffiffiffiffiffiffiffiffiffiffiffiffiffiffiffiffiffiffiffiffiffiffiffiffiffiffiCFP CFPþYFP 3 YFP CFPþYFPð1Þl<strong>in</strong>N<strong>FRET</strong> ¼ F CFPþYFP CFP CFPþYFP 3 ðc CFP 3 CFP CFPþYFP þ d CFP Þ YFP CFPþYFP 3 bpffiffiffiffiffiffiffiffiffiffiffiffiffiffiffiffiffiffiffiffiffiffiffiffiffiffiffiffiffiffiffiffiffiffiffiffiffiffiffiffiffiffiffiffiffiffiffiffiffiffiffiffiffiffiffiffiffiffiffiffiCFP CFPþYFP 3 YFP CFPþYFPð2ÞexpN<strong>FRET</strong> ¼ F CFPþYFP CFP CFPþYFP 3 ðe CFP 3 expðCFP CFPþYFP 3 f CFP Þ þ g CFP Þ YFP CFPþYFP 3 bpffiffiffiffiffiffiffiffiffiffiffiffiffiffiffiffiffiffiffiffiffiffiffiffiffiffiffiffiffiffiffiffiffiffiffiffiffiffiffiffiffiffiffiffiffiffiffiffiffiffiffiffiffiffiffiffiffiffiffiffiCFP CFPþYFP 3 YFP CFPþYFPð3Þ
<strong>Pix<strong>FRET</strong></strong>: AN IMAGEJ PLUG-IN FOR PIXEL-BY-PIXEL ANALYSIS OF <strong>FRET</strong>Fig. 4. l<strong>in</strong>N<strong>FRET</strong> <strong>an</strong>d expN<strong>FRET</strong> reduce N<strong>FRET</strong> variability. Cos-7 cells were tr<strong>an</strong>sfected with expression vectors <strong>for</strong> ECFP <strong>an</strong>d EYFP,ECFP fused to EYFP, or PPARa-ECFP <strong>an</strong>d RXRa-EYFP. Fluorescence<strong>in</strong>tensity <strong>in</strong> the ECFP, EYFP, <strong>an</strong>d <strong>FRET</strong> sett<strong>in</strong>gs was measured on atleast 50 cells. A: <strong>FRET</strong> was calculated accord<strong>in</strong>g to the three <strong>for</strong>mulasdescribed <strong>in</strong> the text. B: The difference between l<strong>in</strong>N<strong>FRET</strong> orexpN<strong>FRET</strong> <strong>an</strong>d N<strong>FRET</strong> calculated <strong>for</strong> the PPAR/RXR pair was plottedas a function of ECFP <strong>in</strong>tensity. C: The percentage error betweenN<strong>FRET</strong> <strong>an</strong>d l<strong>in</strong>N<strong>FRET</strong> or expN<strong>FRET</strong> calculated <strong>for</strong> the PPAR/RXRpair was plotted as a function of ECFP <strong>in</strong>tensity.by pixel the images of a sample acquired <strong>in</strong> a threech<strong>an</strong>nelsett<strong>in</strong>g. The <strong>plug</strong>-<strong>in</strong> allows one to either enterm<strong>an</strong>ually SBT parameters <strong>for</strong> the donor <strong>an</strong>d theacceptor, or determ<strong>in</strong>e these values onl<strong>in</strong>e us<strong>in</strong>g stacksof <strong>FRET</strong> <strong>an</strong>d donor or acceptor images. <strong>Pix<strong>FRET</strong></strong> isfreely available on our website (http://www.unil.ch/cig/page16989.html) together with a detailed user’s guide.The <strong>Pix<strong>FRET</strong></strong> <strong>plug</strong>-<strong>in</strong> requires different stacks ofimages: (i) <strong>for</strong> <strong>FRET</strong> <strong>an</strong>alysis, a stack of three imagestaken <strong>in</strong> the <strong>FRET</strong>, Donor, <strong>an</strong>d Acceptor sett<strong>in</strong>gs, (ii)<strong>for</strong> Donor SBT determ<strong>in</strong>ation, a stack of two images ofcells express<strong>in</strong>g the Donor only <strong>an</strong>d taken <strong>in</strong> the <strong>FRET</strong><strong>an</strong>d Donor sett<strong>in</strong>gs, (iii) <strong>for</strong> Acceptor SBT determ<strong>in</strong>ation,a stack of two images of cells express<strong>in</strong>gthe Acceptor only <strong>an</strong>d taken <strong>in</strong> the <strong>FRET</strong> <strong>an</strong>d Acceptorsett<strong>in</strong>gs.When launch<strong>in</strong>g <strong>Pix<strong>FRET</strong></strong>, <strong>an</strong> <strong>in</strong>terface appearswhere all parameters <strong>for</strong> <strong>FRET</strong> <strong>calculation</strong> <strong>an</strong>d displayc<strong>an</strong> be set (Fig. 5). The ‘‘Donor SBT’’ or‘‘Acceptor SBT’’ tabs allow one to evaluate SBTparameters (Fig. 5A). The user is first <strong>in</strong>vited todraw a region outside cells to determ<strong>in</strong>e the background<strong>in</strong> each image of the stack. Then, one or severalregions of <strong>in</strong>terest on the cells have to be drawnto allow <strong>Pix<strong>FRET</strong></strong> to plot SBT ratios as a function offluorophore <strong>in</strong>tensity. <strong>Pix<strong>FRET</strong></strong> then calculates theme<strong>an</strong> SBT, or the parameters correspond<strong>in</strong>g to thel<strong>in</strong>ear or exponential fit of the data. The user c<strong>an</strong>drag a slid<strong>in</strong>g w<strong>in</strong>dow on the plot to def<strong>in</strong>e on whichset of po<strong>in</strong>ts the <strong>calculation</strong> is to be per<strong>for</strong>med <strong>an</strong>dmay then rescale the graph to the selected area byclick<strong>in</strong>g the ‘‘Zoom’’ button. It is also noteworthy thatall parameters, <strong>in</strong>clud<strong>in</strong>g background (BG) values,c<strong>an</strong> be directly entered m<strong>an</strong>ually by the user. Next,the stack with cells express<strong>in</strong>g both the donor <strong>an</strong>dthe acceptor should be opened <strong>an</strong>d backgroundshould be determ<strong>in</strong>ed <strong>in</strong> the <strong>FRET</strong> tab (Fig. 5B) bydraw<strong>in</strong>g a region outside cells. Backgrounds may alsobe modified m<strong>an</strong>ually to adjust the threshold abovewhich N<strong>FRET</strong> is calculated. Indeed, the softwareoperates N<strong>FRET</strong> <strong>calculation</strong> only when (i) the localme<strong>an</strong> pixel value, which is calculated by averag<strong>in</strong>gthe values of the pixel of <strong>in</strong>terest <strong>an</strong>d that of its eightsurround<strong>in</strong>g neighbors, is above the me<strong>an</strong> backgroundof the image <strong>in</strong> all three images, <strong>an</strong>d (ii)when the product of the me<strong>an</strong> pixel values <strong>for</strong> donor<strong>an</strong>d acceptor is above the product of the backgrounds<strong>in</strong> the donor <strong>an</strong>d acceptor images. These conditionswere <strong>in</strong>troduced to discard po<strong>in</strong>ts <strong>in</strong> the backgroundthat preclude the visualization of <strong>FRET</strong> with<strong>in</strong> thecell by generat<strong>in</strong>g aberr<strong>an</strong>tly high <strong>FRET</strong> valuesbecause of normalization. All background values mayalso be ch<strong>an</strong>ged by a common multiplication factorwhich c<strong>an</strong> be specified <strong>in</strong> the ‘‘Threshold CorrectionFactor’’ field. The program also offers the option tofilter the images with a Gaussi<strong>an</strong> blur, the st<strong>an</strong>darddeviation of the blur allow<strong>in</strong>g the user to tune thesmooth<strong>in</strong>g effect. Blurr<strong>in</strong>g notably reduces the noise<strong>an</strong>d improves the result<strong>in</strong>g image by prevent<strong>in</strong>gaberr<strong>an</strong>t <strong>FRET</strong> values <strong>in</strong> the background. F<strong>in</strong>ally,the normalization method has to be selected. Indeed,the <strong>FRET</strong> values <strong>for</strong> each pixel c<strong>an</strong> be divided by thevalue <strong>in</strong> the same pixel of the donor <strong>in</strong>tensity, theacceptor <strong>in</strong>tensity, the product of donor <strong>an</strong>d acceptor<strong>in</strong>tensities, or the square root of the product of donor<strong>an</strong>d acceptor <strong>in</strong>tensities. Click<strong>in</strong>g on the ‘‘Compute<strong>FRET</strong>’’ button will generate the normalized <strong>FRET</strong>images, but also will log all parameters to a textfile which will be reloaded when the <strong>plug</strong>-<strong>in</strong> isrelaunched.<strong>FRET</strong> <strong>an</strong>d N<strong>FRET</strong> are calculated only if pixel values<strong>in</strong> each image are above a given threshold. Otherwisethe value is set to zero <strong>in</strong> the computed image<strong>an</strong>d the pixel is displayed <strong>in</strong> blue <strong>in</strong> order to bettervisualize all the <strong>FRET</strong> values of the image (Fig. 6B).Indeed, even if with<strong>in</strong> a cell the average <strong>FRET</strong> valueis positive, some pixels may have negative values,especially when the <strong>FRET</strong> efficiency is low. S<strong>in</strong>ce theoutput image is displayed with a 256 grayscale lookuptable, the background, which corresponds to avalue of zero, may appear <strong>in</strong> gray (<strong>an</strong>d not black as<strong>in</strong>tuitively expected) if negative pixels are present <strong>in</strong>the image, thereby preclud<strong>in</strong>g a good visual exam<strong>in</strong>a-55
56 J.N. FEIGE ET AL.Fig. 5. pix<strong>FRET</strong> <strong>plug</strong>-<strong>in</strong> <strong>in</strong>terfaces. A: SBT determ<strong>in</strong>ation <strong>in</strong>terface. B: <strong>FRET</strong> <strong>in</strong>terface. [Color figurec<strong>an</strong> be viewed <strong>in</strong> the onl<strong>in</strong>e issue, which is available at www.<strong>in</strong>terscience.wiley.com.]tion of the generated <strong>FRET</strong> image. The backgroundpixels are hence automatically colorized <strong>in</strong> blue us<strong>in</strong>ga look-up table designed <strong>for</strong> this purpose.Test of the <strong>Pix<strong>FRET</strong></strong> Plug-<strong>in</strong>To validate the tools described above, we per<strong>for</strong>med apixel-by-pixel <strong>an</strong>alysis of <strong>FRET</strong> by comput<strong>in</strong>g <strong>an</strong> imageof two cells express<strong>in</strong>g different amounts of PPAR-ECFP <strong>an</strong>d RXR-EYFP (Fig. 6) <strong>an</strong>d compared theimpact of us<strong>in</strong>g const<strong>an</strong>t or fitted SBT ratios on <strong>FRET</strong>display. S<strong>in</strong>ce these cells express the same ECFP <strong>an</strong>dEYFP fusion prote<strong>in</strong>s, both of them should exhibit similarnormalized <strong>FRET</strong> values. When const<strong>an</strong>t SBTratios are used, <strong>FRET</strong> efficiency appears higher <strong>in</strong> cell2 th<strong>an</strong> cell 1 (Figs. 6B <strong>an</strong>d 6C, left p<strong>an</strong>els), whereas theuse of the expN<strong>FRET</strong> <strong>for</strong>mula generated <strong>an</strong> imagewhere the two cells display similar <strong>in</strong>tensities (Figs. 6B<strong>an</strong>d 6C, right p<strong>an</strong>els). This visual appreciation of theadv<strong>an</strong>tage of us<strong>in</strong>g expN<strong>FRET</strong> was confirmed whenthe distributions of pixel <strong>in</strong>tensities with<strong>in</strong> each cellwere plotted as histograms <strong>an</strong>d average <strong>FRET</strong> valuescalculated (Fig. 6D). When const<strong>an</strong>t SBT ratios wereused, the average normalized <strong>FRET</strong> value <strong>in</strong> cell 1 was4.9, versus 13.8 <strong>in</strong> cell 2, whereas the use of expN<strong>FRET</strong>generated closer me<strong>an</strong> values (9.6 <strong>for</strong> cell 1 versus 7.4<strong>for</strong> cell 2). Indeed, when us<strong>in</strong>g <strong>an</strong> average SBT ratio <strong>for</strong>normalized <strong>FRET</strong> <strong>calculation</strong> (see <strong>for</strong>mula (1)), mostdonor SBT values are underestimated <strong>in</strong> cell 2, whereCFP levels are high, <strong>an</strong>d overestimated <strong>in</strong> cell 1 whereCFP levels are low. This is why overall <strong>an</strong>d consistentwith what was observed at the cell population level <strong>in</strong>Figure 4, the use of the exponential fit allows a betternormalization of the data by reduc<strong>in</strong>g the variability of<strong>FRET</strong> signals generated from different r<strong>an</strong>ges of fluorophore<strong>in</strong>tensity.DISCUSSION<strong>FRET</strong> is a technique whose use is rapidly exp<strong>an</strong>d<strong>in</strong>gamong cell biologists as it provides very valuable<strong>in</strong><strong>for</strong>mation about physical <strong>in</strong>teractions between moleculeswith<strong>in</strong> cells. Numerous procedures exist <strong>an</strong>dhave been used to determ<strong>in</strong>e <strong>FRET</strong> <strong>in</strong> liv<strong>in</strong>g cells,each of them hav<strong>in</strong>g adv<strong>an</strong>tages <strong>an</strong>d drawbacks (Berney<strong>an</strong>d D<strong>an</strong>user, 2003), <strong>an</strong>d we are still <strong>in</strong> a phasewhere the robustness of the methods has to beimproved (v<strong>an</strong> Rheenen et al., 2004). One import<strong>an</strong>tissue that has received only limited attention so faris the variation of SBT ratios as a function of fluorophore<strong>in</strong>tensity when per<strong>for</strong>m<strong>in</strong>g sensitized emission<strong>FRET</strong>. Us<strong>in</strong>g the most widely used fluorophore pair<strong>in</strong> cell biology, i.e. ECFP <strong>an</strong>d EYFP, we show thatunder some common technical circumst<strong>an</strong>ces, theseratios are not const<strong>an</strong>t <strong>an</strong>d c<strong>an</strong> vary with fluorophoreconcentration. In cases where the variations of fluorophoreconcentrations are small, assum<strong>in</strong>g const<strong>an</strong>tSBT ratios may be sufficient to get data of satisfactoryaccuracy. However, when these SBT ratios varyimport<strong>an</strong>tly <strong>an</strong>d thereby clearly bias <strong>FRET</strong> <strong>calculation</strong>,<strong>an</strong>d when only small variations <strong>in</strong> <strong>FRET</strong> efficiencyare expected between cells or samples, solutionsto tackle this problem are required.Variations <strong>in</strong> SBT ratios as a function of fluorophore<strong>in</strong>tensity could be assigned here to a differentialresponse of the PMTs used <strong>for</strong> detection <strong>in</strong> theDonor <strong>an</strong>d <strong>FRET</strong> ch<strong>an</strong>nels. Although us<strong>in</strong>g a uniquePMT both <strong>for</strong> the detection of the donor <strong>an</strong>d of the
<strong>Pix<strong>FRET</strong></strong>: AN IMAGEJ PLUG-IN FOR PIXEL-BY-PIXEL ANALYSIS OF <strong>FRET</strong>Fig. 6. expN<strong>FRET</strong> reduces <strong>in</strong>tercellular variability <strong>in</strong> pixel-bypixel<strong>an</strong>alyses. Cos-7 cells were tr<strong>an</strong>sfected with expression vectors<strong>for</strong> PPARa-ECFP <strong>an</strong>d RXRa-EYFP. A: Images of two cells express<strong>in</strong>gboth PPAR-ECFP <strong>an</strong>d RXR-EYFP <strong>in</strong> the CFP <strong>an</strong>d YFP sett<strong>in</strong>g. AGaussi<strong>an</strong> blur of 1 was applied to the orig<strong>in</strong>al image. B: N<strong>FRET</strong> <strong>an</strong>dexpN<strong>FRET</strong> images generated by the <strong>Pix<strong>FRET</strong></strong> <strong>plug</strong>-<strong>in</strong>. C: Same as (B)but the cells are pseudocolorized with a different look-up table to bettervisualize <strong>in</strong>tensity differences. D: Distribution of pixel <strong>in</strong>tensitieswith<strong>in</strong> the two cells when the N<strong>FRET</strong> or expN<strong>FRET</strong> methods areused. The red bar <strong>an</strong>d the number <strong>in</strong>dicate the me<strong>an</strong> <strong>in</strong>tensity overthe entire cell.acceptor could circumvent this problem, the requiredmech<strong>an</strong>ical movement of the PMT (or of the filtercube wheel <strong>in</strong> other set-ups) implies that the images<strong>in</strong> the <strong>FRET</strong>, the donor, <strong>an</strong>d the acceptor ch<strong>an</strong>nelsare acquired sequentially. While this approach iswell applicable to fixed samples or to slowly diffus<strong>in</strong>gor immobile prote<strong>in</strong>s, it is more problematic <strong>for</strong>the study of <strong>in</strong>teractions of highly mobile prote<strong>in</strong>ssuch as PPARs (Feige et al., 2005). Sc<strong>an</strong>n<strong>in</strong>g eachch<strong>an</strong>nel between l<strong>in</strong>es, which c<strong>an</strong> only be per<strong>for</strong>medwith two separate PMTs, there<strong>for</strong>e, limits the diffusionof the <strong>in</strong>teract<strong>in</strong>g complexes dur<strong>in</strong>g the time ofsc<strong>an</strong>n<strong>in</strong>g. It is noteworthy that on a different microscope,us<strong>in</strong>g <strong>an</strong> array of PMTs, the same problemwas encountered. Hence, our results are of general<strong>in</strong>terest to scientists per<strong>for</strong>m<strong>in</strong>g <strong>FRET</strong> on a confocalmicroscope. Interest<strong>in</strong>gly, Chen et al. (<strong>in</strong> press) havealso observed variations <strong>in</strong> SBT ratios when per<strong>for</strong>m<strong>in</strong>g<strong>FRET</strong> with a 2-photon excitation set-up, <strong>an</strong>dconsistent with our study, they did not observe <strong>an</strong>yvariation of the SBT ratios on a wide-field microscope,us<strong>in</strong>g a CCD camera detection.In cases where SBT ratios vary as a function of fluorescence<strong>in</strong>tensity, we showed that <strong>FRET</strong> <strong>calculation</strong>c<strong>an</strong> be improved by model<strong>in</strong>g these variations. This isparticularly import<strong>an</strong>t when fluorophore <strong>in</strong>tensitiesvary greatly between cells. We demonstrated here thatthe expN<strong>FRET</strong> method reduces the variability of the<strong>FRET</strong> values calculated <strong>for</strong> the PPAR/RXR <strong>in</strong>teraction.Although <strong>in</strong> our case, the exponential model<strong>in</strong>g generatedthe best results, other fits might be tested <strong>in</strong> situationswhere SBT ratios vary differently.Cells are highly org<strong>an</strong>ized <strong>an</strong>d prote<strong>in</strong> distributionas well as <strong>in</strong>teractions are often limited to specificcompartments. It is hence of import<strong>an</strong>ce to be able tomap <strong>FRET</strong> precisely with<strong>in</strong> cells to better characterizethe mode of action of <strong>in</strong>teract<strong>in</strong>g prote<strong>in</strong>s. Toachieve this goal, we developed a <strong>plug</strong>-<strong>in</strong> called Pix-<strong>FRET</strong> <strong>for</strong> the <strong>ImageJ</strong> software that generates <strong>an</strong>image where N<strong>FRET</strong> is calculated <strong>for</strong> each pixel. The<strong>plug</strong>-<strong>in</strong> allows one to directly determ<strong>in</strong>e the SBTparameters from images acquired when only thedonor or the acceptor are present. As various normalizationmethods have been proposed (Gordon et al.,1998; Xia <strong>an</strong>d Liu, 2001), <strong>Pix<strong>FRET</strong></strong> allows the user tochoose the type of normalization desired. To ourknowledge, this is the first freely available programthat offers such possibilities <strong>an</strong>d the source files willbe available upon request, allow<strong>in</strong>g users to programspecific SBT ratio model<strong>in</strong>g methods accord<strong>in</strong>g totheir needs.In conclusion, we uncovered the bias that the useof several PMTs may <strong>in</strong>troduce when per<strong>for</strong>m<strong>in</strong>g<strong>FRET</strong> experiments. We show that <strong>in</strong> cases where aset-up with two PMTs or <strong>an</strong> array of PMTs is preferredor required, this bias c<strong>an</strong> be circumvented by asimple model<strong>in</strong>g of SBT ratios. We also developed auser-friendly <strong>an</strong>d free <strong>in</strong>terface, called <strong>Pix<strong>FRET</strong></strong>, thatallows a simple <strong>an</strong>d rapid determ<strong>in</strong>ation of SBTparameters <strong>an</strong>d to display normalized <strong>FRET</strong> images.Altogether, these results <strong>an</strong>d the <strong>Pix<strong>FRET</strong></strong> <strong>plug</strong>-<strong>in</strong>will help cell biologists to <strong>in</strong>crease the precision of<strong>FRET</strong> <strong>an</strong>alyses conducted on confocal microscopes aswell as the visualization <strong>an</strong>d localization of <strong>in</strong>teractions<strong>in</strong> liv<strong>in</strong>g cells.ACKNOWLEDGMENTSWe th<strong>an</strong>k Dr. Claude Berney <strong>for</strong> valuable discussions<strong>an</strong>d <strong>for</strong> the read<strong>in</strong>g of the m<strong>an</strong>uscript, Dr. NathalieGar<strong>in</strong> <strong>for</strong> access to the ISREC imag<strong>in</strong>g plat<strong>for</strong>m, Drs.Peterson <strong>an</strong>d DeGrazia <strong>for</strong> the gift of the GI-FITClig<strong>an</strong>d, <strong>an</strong>d Dr. Tavaré <strong>for</strong> the gift of the EYFP–ECFPconstruct.REFERENCESBerney C, D<strong>an</strong>user G. 2003. <strong>FRET</strong> or no <strong>FRET</strong>: a qu<strong>an</strong>titative comparison.Biophys J 84:3992–4010.Chen Y, El<strong>an</strong>gov<strong>an</strong> M, Periasamy A. 2005. <strong>FRET</strong> data <strong>an</strong>alysis: thealgorithm. In: Periasamy A, Day RN, editors. Molecular imag<strong>in</strong>g:<strong>FRET</strong> microscopy <strong>an</strong>d spectroscopy. Ox<strong>for</strong>d: Ox<strong>for</strong>d UniversityPress (<strong>in</strong> press).DeGrazia MJ, Thompson J, Heuvel JP, Peterson BR. 2003. Synthesisof a high-aff<strong>in</strong>ity fluorescent PPARgamma lig<strong>an</strong>d <strong>for</strong> highthroughputfluorescence polarization assays. Bioorg Med Chem 11:4325–4332.El<strong>an</strong>gov<strong>an</strong> M, Wallrabe H, Chen Y, Day RN, Barroso M,Periasamy A. 2003. Characterization of one- <strong>an</strong>d two-photon excitationfluorescence reson<strong>an</strong>ce energy tr<strong>an</strong>sfer microscopy. Methods29: 58–73.57
58 J.N. FEIGE ET AL.Feige JN, Gelm<strong>an</strong> L, Tudor C, Engelborghs Y, Wahli W, DesvergneB. 2005. Fluorescence imag<strong>in</strong>g reveals the nuclear behavior ofPPAR/RXR heterodimers <strong>in</strong> the absence <strong>an</strong>d presence of lig<strong>an</strong>d. JBiol Chem 280:17880–17890.Gordon GW, Berry G, Li<strong>an</strong>g XH, Lev<strong>in</strong>e B, Herm<strong>an</strong> B. 1998. Qu<strong>an</strong>titativefluorescence reson<strong>an</strong>ce energy tr<strong>an</strong>sfer measurementsus<strong>in</strong>g fluorescence microscopy. Biophys J 74:2702–2713.Jares-Erijm<strong>an</strong> EA, Jov<strong>in</strong> TM. 2003. <strong>FRET</strong> imag<strong>in</strong>g. Nat Biotechnol21:1387–1395.Rehm M, Dussm<strong>an</strong>n H, J<strong>an</strong>icke RU, Tavare JM, Kogel D, PrehnJH. 2002. S<strong>in</strong>gle-cell fluorescence reson<strong>an</strong>ce energy tr<strong>an</strong>sfer <strong>an</strong>alysisdemonstrates that caspase activation dur<strong>in</strong>g apoptosis is a rapidprocess. Role of caspase-3. J Biol Chem 277:24506–24514.Sekar RB, Periasamy A. 2003. Fluorescence reson<strong>an</strong>ce energy tr<strong>an</strong>sfer(<strong>FRET</strong>) microscopy imag<strong>in</strong>g of live cell prote<strong>in</strong> localizations.J Cell Biol 160:629–633.v<strong>an</strong> Rheenen J, L<strong>an</strong>geslag M, Jal<strong>in</strong>k K. 2004. Correct<strong>in</strong>g confocalacquisition to optimize imag<strong>in</strong>g of fluorescence reson<strong>an</strong>ce energytr<strong>an</strong>sfer by sensitized emission. Biophys J 86:2517–2529.Wouters FS, Verveer PJ, Bastiaens PI. 2001. Imag<strong>in</strong>g biochemistry<strong>in</strong>side cells. Trends Cell Biol 11:203–211.Xia Z, Liu Y. 2001. Reliable <strong>an</strong>d global measurement of fluorescencereson<strong>an</strong>ce energy tr<strong>an</strong>sfer us<strong>in</strong>g fluorescence microscopes. BiophysJ 81:2395–2402.