PixFRET, an ImageJ plug-in for FRET calculation which can ...
PixFRET, an ImageJ plug-in for FRET calculation which can ...
PixFRET, an ImageJ plug-in for FRET calculation which can ...
- No tags were found...

You also want an ePaper? Increase the reach of your titles
YUMPU automatically turns print PDFs into web optimized ePapers that Google loves.
<strong>Pix<strong>FRET</strong></strong>, <strong>an</strong> <strong>ImageJ</strong> <strong>plug</strong>-<strong>in</strong> <strong>for</strong> <strong>FRET</strong> <strong>calculation</strong> <strong>which</strong> c<strong>an</strong>accommodate variations <strong>in</strong> spectral bleed-throughsJérôme N. Feige 1 , D<strong>an</strong>iel Sage 2 , Walter Wahli 1 , Béatrice Desvergne 1 ,<strong>an</strong>d Laurent Gelm<strong>an</strong> 1*1 - Center <strong>for</strong> Integrative Genomics, NCCR frontiers <strong>in</strong> Genetics, University of Laus<strong>an</strong>ne,Switzerl<strong>an</strong>d.2 - Biomedical Imag<strong>in</strong>g Group, Swiss Federal Institute of Technology Laus<strong>an</strong>ne (EPFL),Laus<strong>an</strong>ne, Switzerl<strong>an</strong>d.* Correspond<strong>in</strong>g author: Center <strong>for</strong> Integrative Genomics, Université de Laus<strong>an</strong>ne, BEP,CH-1015 Laus<strong>an</strong>ne, e-mail: laurent.gelm<strong>an</strong>@unil.ch, tel.: +41 (0)21 692 41 43, fax: +41(0)21 692 41 15.Keywords: fluorescence reson<strong>an</strong>ce energy tr<strong>an</strong>sfer / sensitized emission / spectral bleedthrough/ live cell microscopy / <strong>ImageJ</strong>
AbstractFluorescence Reson<strong>an</strong>ce Energy Tr<strong>an</strong>sfer (<strong>FRET</strong>) allows to <strong>in</strong>vestigate <strong>in</strong>teractions betweenfluorescent partners. One crucial issue when calculat<strong>in</strong>g sensitized emission <strong>FRET</strong> is thecorrection <strong>for</strong> spectral bleed-throughs (SBT), <strong>which</strong> requires to calculate the ratios betweenthe <strong>in</strong>tensities <strong>in</strong> the <strong>FRET</strong> <strong>an</strong>d <strong>in</strong> the donor or acceptor sett<strong>in</strong>gs, when only the donor oracceptor are present. Theoretically, SBT ratios should be const<strong>an</strong>t. However, experimentally,these ratios c<strong>an</strong> vary as a function of fluorophore <strong>in</strong>tensity, <strong>an</strong>d assum<strong>in</strong>g const<strong>an</strong>t values mayh<strong>in</strong>der precise <strong>FRET</strong> <strong>calculation</strong>. One possible cause <strong>for</strong> such a variation is the use of amicroscope set-up with different photomultipliers (PMTs) <strong>for</strong> the donor <strong>an</strong>d <strong>FRET</strong> ch<strong>an</strong>nels, aset-up allow<strong>in</strong>g higher speed acquisitions on very dynamic fluorescent molecules <strong>in</strong> liv<strong>in</strong>gcells. Here<strong>in</strong>, we show that the bias <strong>in</strong>troduced by the differential response of the two PMTsc<strong>an</strong> be circumvented by a simple model<strong>in</strong>g of the SBT ratios as a function of fluorophore<strong>in</strong>tensity. Another import<strong>an</strong>t issue when per<strong>for</strong>m<strong>in</strong>g <strong>FRET</strong> is the localization of <strong>FRET</strong> with<strong>in</strong>the cell or a population of cells. We hence developed a freely available <strong>ImageJ</strong> <strong>plug</strong>-<strong>in</strong>, called<strong>Pix<strong>FRET</strong></strong>, that allows a simple <strong>an</strong>d rapid determ<strong>in</strong>ation of SBT parameters <strong>an</strong>d the display ofnormalized <strong>FRET</strong> images. The usefulness of this model<strong>in</strong>g <strong>an</strong>d of the <strong>plug</strong>-<strong>in</strong> are exemplifiedby the study of <strong>FRET</strong> <strong>in</strong> a system where two <strong>in</strong>teract<strong>in</strong>g nuclear receptors labeled with ECFP<strong>an</strong>d EYFP are co-expressed <strong>in</strong> liv<strong>in</strong>g cells.2
IntroductionFluorescence Reson<strong>an</strong>ce Energy Tr<strong>an</strong>sfer (<strong>FRET</strong>) is a technique used to <strong>in</strong>vestigate<strong>in</strong>teractions between fluorescent partners as it allows to go beyond the resolution of lightmicroscopy by provid<strong>in</strong>g valuable <strong>in</strong><strong>for</strong>mation on dist<strong>an</strong>ces between tagged molecules.Indeed, s<strong>in</strong>ce the energy tr<strong>an</strong>sfer efficiency is <strong>in</strong>versely proportional to the power 6 of thedist<strong>an</strong>ce between the donor <strong>an</strong>d the acceptor, <strong>in</strong>teractions are generally detected if the dist<strong>an</strong>cebetween fluorophores does not exceed 5 to 10 nm, a proximity only allowed by a direct<strong>in</strong>teraction of the two partners (Sekar <strong>an</strong>d Periasamy, 2003). With the <strong>in</strong>troduction of autofluorescentprote<strong>in</strong>s <strong>which</strong> c<strong>an</strong> be coupled to a prote<strong>in</strong> of <strong>in</strong>terest to produce a fluorescentchimera (Wouters <strong>an</strong>d others, 2001), <strong>FRET</strong> has ga<strong>in</strong>ed great <strong>in</strong>terest <strong>for</strong> cell biologists as itallows to directly study prote<strong>in</strong>-prote<strong>in</strong> <strong>in</strong>teractions <strong>in</strong> the physiological context of a liv<strong>in</strong>gcell.A plethora of methods exist to evaluate <strong>FRET</strong>, depend<strong>in</strong>g on the protocol used (sensitizedemission, acceptor photobleach<strong>in</strong>g, fluorescence lifetime) <strong>an</strong>d the precision that is pursued(see (Berney <strong>an</strong>d D<strong>an</strong>user, 2003; Jares-Erijm<strong>an</strong> <strong>an</strong>d Jov<strong>in</strong>, 2003) <strong>for</strong> reviews). Two import<strong>an</strong>tparameters <strong>in</strong> sensitized emission <strong>FRET</strong> <strong>calculation</strong> are (i) the evaluation of spectral bleedthroughs(SBTs), i.e. the amount of light detected <strong>in</strong> the <strong>FRET</strong> ch<strong>an</strong>nel <strong>which</strong> is not due toenergy tr<strong>an</strong>sfer <strong>an</strong>d (ii) the normalization <strong>for</strong> differences <strong>in</strong> donor <strong>an</strong>d acceptor expressionlevels (Gordon <strong>an</strong>d others, 1998; Xia <strong>an</strong>d Liu, 2001). The ma<strong>in</strong> causes of SBT are theemission of the donor <strong>in</strong> the acceptor ch<strong>an</strong>nel <strong>an</strong>d the excitation of the acceptor us<strong>in</strong>g thedonor excitation wavelength. As a first approximation, a const<strong>an</strong>t value is often assigned tothe donor <strong>an</strong>d acceptor SBT ratios, <strong>which</strong> then correspond to the average ratios between the<strong>in</strong>tensities <strong>in</strong> the <strong>FRET</strong> <strong>an</strong>d <strong>in</strong> the donor or acceptor ch<strong>an</strong>nels, when only the donor oracceptor are present. However, we <strong>an</strong>d others have observed that SBT ratios c<strong>an</strong> vary3
import<strong>an</strong>tly with fluorophore <strong>in</strong>tensity (Chen <strong>an</strong>d others, 2005; El<strong>an</strong>gov<strong>an</strong> <strong>an</strong>d others, 2003).To circumvent the problem of generat<strong>in</strong>g <strong>in</strong>accurate <strong>FRET</strong> data by us<strong>in</strong>g const<strong>an</strong>t SBT ratios,El<strong>an</strong>gov<strong>an</strong> et al. have developed <strong>an</strong> eleg<strong>an</strong>t algorithm termed p<strong>FRET</strong> (El<strong>an</strong>gov<strong>an</strong> <strong>an</strong>d others,2003) that def<strong>in</strong>es classes of fluorophore <strong>in</strong>tensities to <strong>which</strong> specific SBT values areattributed. We <strong>an</strong>alyzed here the causes of SBT ratio variations on two different confocalmicroscopes <strong>an</strong>d demonstrate that these are due to the use of several PMTs <strong>for</strong> the detection<strong>in</strong> the donor <strong>an</strong>d the <strong>FRET</strong> ch<strong>an</strong>nels. We thereafter show that a simple model<strong>in</strong>g <strong>which</strong> c<strong>an</strong> beeasily applied by biologists to estimate these SBT ratios as a function of <strong>in</strong>tensity greatlyimproves the accuracy of <strong>FRET</strong> <strong>calculation</strong>.Another import<strong>an</strong>t <strong>in</strong>terest <strong>for</strong> biologists when <strong>an</strong>alyz<strong>in</strong>g <strong>FRET</strong> <strong>in</strong> liv<strong>in</strong>g cells concerns thelocation of the <strong>in</strong>teraction studied with<strong>in</strong> the cell or the cell population. We report here thedevelopment of <strong>an</strong> <strong>ImageJ</strong> <strong>plug</strong>-<strong>in</strong>, called "<strong>Pix<strong>FRET</strong></strong>", <strong>which</strong> allows to calculate <strong>an</strong>d display<strong>FRET</strong> directly on images by per<strong>for</strong>m<strong>in</strong>g a pixel-by-pixel <strong>an</strong>alysis of images <strong>an</strong>d assist<strong>in</strong>g <strong>in</strong>the determ<strong>in</strong>ation of SBTs.The usefulness of the model<strong>in</strong>g of SBT ratios <strong>an</strong>d of the pix<strong>FRET</strong> <strong>plug</strong>-<strong>in</strong> is exemplifiedus<strong>in</strong>g the Enh<strong>an</strong>ced Cy<strong>an</strong> <strong>an</strong>d Yellow Fluorescent Prote<strong>in</strong>s (ECFP <strong>an</strong>d EYFP), the <strong>FRET</strong> pair<strong>which</strong> is today the most widely used by biologists to study <strong>in</strong>teractions of prote<strong>in</strong>s <strong>in</strong> liv<strong>in</strong>gcells, fused to each partner of a well established heterodimer: the Peroxisome Proliferator-Activated Receptor (PPAR) <strong>an</strong>d the Ret<strong>in</strong>oid X Receptor (RXR) (Feige <strong>an</strong>d others, 2005).4
Material <strong>an</strong>d MethodsPlasmid constructs <strong>an</strong>d reagents - cDNAs encod<strong>in</strong>g mouse PPARα as well as RXRα weresubcloned after PCR amplification <strong>in</strong>to the pEYFP-N1 <strong>an</strong>d pECFP-N1 plasmids (BDBiosciences Clontech) as described previously (Feige <strong>an</strong>d others, 2005). The ECFP-DEVD-EYFP construct <strong>an</strong>d GI262570-FITC were k<strong>in</strong>d gifts of Dr J. M. Tavaré (Rehm <strong>an</strong>d others,2002) <strong>an</strong>d Dr Peterson (DeGrazia <strong>an</strong>d others, 2003), respectively.Cell culture <strong>an</strong>d tr<strong>an</strong>sient tr<strong>an</strong>sfection assays - Cos-7 cells were ma<strong>in</strong>ta<strong>in</strong>ed <strong>in</strong> Dulbecco'smodified Eagle's medium supplemented with 10% fetal calf serum (Gibco). Penicill<strong>in</strong> <strong>an</strong>dStreptomyc<strong>in</strong> (Gibco) were added to the media at 100 units/ml <strong>an</strong>d 100 µg/ml, respectively.Tr<strong>an</strong>sient tr<strong>an</strong>sfection assays were per<strong>for</strong>med us<strong>in</strong>g Lipofectam<strong>in</strong>e 2000 (Invitrogen). Cellswere plated <strong>in</strong> 4-well LabTek chambered coverglasses (Nunc) <strong>for</strong> microscopy studies.Confocal imag<strong>in</strong>g - Live cells grown on LabTek chambered coverglasses were washedonce with phenol red free Optimem medium (Gibco) <strong>an</strong>d observed <strong>in</strong> the same medium.Observations were per<strong>for</strong>med at 37°C on a TCS SP2 AOBS confocal microscope (Leica,Germ<strong>an</strong>y) equipped with 4 photomultipliers <strong>an</strong>d with a whole-microscope <strong>in</strong>cubator (LifeImag<strong>in</strong>g Service, Switzerl<strong>an</strong>d). Additional experiments were per<strong>for</strong>med on a LSM510 Metaconfocal microscope us<strong>in</strong>g the Meta array of photomultipliers (Zeiss, Germ<strong>an</strong>y), <strong>an</strong>d on <strong>an</strong>Olympus IX70 wide-field microscope equipped with a Polychrome II monochromator(Photonics, USA) set at 420nm, a Zeiss 488027 filter set (Ex BP 410/16 + 489/22 – EmBP 456/17 + 535/44) or <strong>an</strong> Olympus YFP filter set (BP535/30) <strong>an</strong>d <strong>an</strong> Imago CCD camera(Photonics, USA). Acquisitions were per<strong>for</strong>med with a 63X/NA 1.2 water or a 63X/NA 1.4oil immersion objective. Qu<strong>an</strong>tification of images was per<strong>for</strong>med us<strong>in</strong>g either the LeicaConfocal Software (LCS) version 2.4 or <strong>ImageJ</strong> version 1.33.5
For <strong>FRET</strong> experiments, tr<strong>an</strong>sfections were per<strong>for</strong>med as described above <strong>an</strong>d expressionlevels of donor <strong>an</strong>d acceptor prote<strong>in</strong>s were adjusted to similar levels by western blot. Unlessotherwise stated, the three different sett<strong>in</strong>gs used <strong>for</strong> the <strong>an</strong>alysis of <strong>FRET</strong> with the CFP/YFPpair were i) <strong>FRET</strong>: Ex 405nm / Em 525-545nm, ii) CFP: Ex 405nm / Em 465-485nm, iii)YFP: Ex 514nm / Em 525-545nm. Laser power <strong>an</strong>d detector ga<strong>in</strong> were adjusted <strong>in</strong> thedifferent ch<strong>an</strong>nels <strong>in</strong> order to observe equimolar concentrations of CFP <strong>an</strong>d YFP at equal<strong>in</strong>tensities (equimolar concentrations of CFP <strong>an</strong>d YFP were obta<strong>in</strong>ed by express<strong>in</strong>g areference fusion prote<strong>in</strong> of CFP <strong>an</strong>d YFP spaced by 475 residues). The <strong>an</strong>alysis of <strong>FRET</strong> withthe FITC/Cy3 pair was per<strong>for</strong>med with the follow<strong>in</strong>g sett<strong>in</strong>gs: <strong>FRET</strong>: Ex 488nm / Em 565-585nm, ii) FITC: Ex 488nm / Em 510-530nm, iii) Cy3: Ex 514nm / Em 565-585nm. Sett<strong>in</strong>gswere kept unch<strong>an</strong>ged <strong>for</strong> <strong>an</strong>alysis of all samples. Unless otherwise stated, donor emission wasdetected on the photomultiplier (PMT) #1 <strong>an</strong>d acceptor <strong>an</strong>d <strong>FRET</strong> emissions were recordedPMT #2. Donor <strong>an</strong>d acceptor SBTs <strong>in</strong> the <strong>FRET</strong> sett<strong>in</strong>g were determ<strong>in</strong>ed on cells express<strong>in</strong>gthe donor or the acceptor alone by calculat<strong>in</strong>g the <strong>in</strong>tensity (I) ratios <strong>in</strong> the appropriate sett<strong>in</strong>gs(I <strong>FRET</strong> /I Donor <strong>an</strong>d I <strong>FRET</strong> /I Acceptor , respectively). L<strong>in</strong>ear <strong>an</strong>d exponential fits were per<strong>for</strong>med us<strong>in</strong>gMicrosoft Excel <strong>an</strong>d F<strong>in</strong>dGraph, respectively. <strong>FRET</strong> measured <strong>in</strong> co-express<strong>in</strong>g cells was thencorrected <strong>for</strong> SBTs <strong>an</strong>d normalized (N<strong>FRET</strong>) <strong>for</strong> expression levels accord<strong>in</strong>g to the follow<strong>in</strong>g<strong>for</strong>mula (Xia <strong>an</strong>d Liu, 2001):N<strong>FRET</strong> = I <strong>FRET</strong>−I Donor×BT Donor−I Acceptor×BT AcceptorI Donor×I AcceptorProgram <strong>for</strong> the <strong>plug</strong>-<strong>in</strong> - The program <strong>Pix<strong>FRET</strong></strong> presented <strong>in</strong> this paper is a <strong>plug</strong>-<strong>in</strong> of the€public-doma<strong>in</strong> software <strong>ImageJ</strong>. <strong>ImageJ</strong> is a general-purpose image-process<strong>in</strong>g program; it isthe Java offspr<strong>in</strong>g of the NIH Image software. As a result, it c<strong>an</strong> run on <strong>an</strong>y plat<strong>for</strong>m with aJava Virtual Mach<strong>in</strong>e (Mac<strong>in</strong>tosh, W<strong>in</strong>dows, Unix, etc…). The application <strong>an</strong>d its source are6
available at: http://rsb.<strong>in</strong>fo.nih.gov/ij/. <strong>Pix<strong>FRET</strong></strong> is freely available athttp://www.unil.ch/cig/page16989.html.7
ResultsSBT ratios c<strong>an</strong> vary as a function of fluorophore <strong>in</strong>tensity.To study <strong>FRET</strong> <strong>in</strong> liv<strong>in</strong>g cells, we chose two nuclear receptors previously shown to <strong>for</strong>mheterodimers <strong>in</strong> vitro <strong>an</strong>d <strong>in</strong> vivo, the peroxisome proliferator-activated receptor (PPAR) <strong>an</strong>dthe ret<strong>in</strong>oid X receptor (RXR) <strong>which</strong> were respectively fused to ECFP (donor) <strong>an</strong>d EYFP(acceptor) (Feige <strong>an</strong>d others, 2005).An import<strong>an</strong>t parameter <strong>in</strong> <strong>FRET</strong> experiments is the amount of SBT between ch<strong>an</strong>nels. Toestimate SBTs, average fluorescence <strong>in</strong>tensities <strong>in</strong> cells express<strong>in</strong>g only the donor (or theacceptor) were qu<strong>an</strong>tified, both <strong>in</strong> the <strong>FRET</strong> <strong>an</strong>d <strong>in</strong> the donor (or acceptor) ch<strong>an</strong>nels. Theratios between the fluorescence <strong>in</strong>tensities <strong>in</strong> each ch<strong>an</strong>nel were calculated after backgroundsubtraction. In cells express<strong>in</strong>g PPAR-CFP alone, the donor SBT ratio, def<strong>in</strong>ed as the ratiobetween the amount of light emitted by the donor <strong>in</strong> the <strong>FRET</strong> ch<strong>an</strong>nel (F CFP ) <strong>an</strong>d <strong>in</strong> the donorch<strong>an</strong>nel (CFP CFP ), was not const<strong>an</strong>t <strong>an</strong>d <strong>in</strong>creased with CFP <strong>in</strong>tensity (Fig. 1A). In order tounderst<strong>an</strong>d the causes of such <strong>an</strong> <strong>in</strong>crease, we tested several possible factors. Photobleach<strong>in</strong>gor photoconversion of the fluorophores was not <strong>in</strong>volved as no modification of therelationship between the CFP SBT ratio <strong>an</strong>d CFP <strong>in</strong>tensity was observed after 60 sc<strong>an</strong>s of thespecimen or after sc<strong>an</strong>n<strong>in</strong>g with full laser power (data not shown). We then tested whetherthis phenomenon was dependent on the type of fluorophore used by test<strong>in</strong>g the SBT of FITC.Liv<strong>in</strong>g cells were <strong>in</strong>cubated with the PPAR lig<strong>an</strong>d GI262570 coupled to FITC <strong>which</strong>accumulates <strong>in</strong> cellular membr<strong>an</strong>es <strong>an</strong>d <strong>in</strong> nuclei. Interest<strong>in</strong>gly, when GI262570-FITC wasused as a <strong>FRET</strong> donor with Cy3, the donor SBT ratio also varied with FITC <strong>in</strong>tensity(Fig. 1B).To determ<strong>in</strong>e if the fluctuations of SBTs were due to our <strong>in</strong>strumentation (Leica TCS SP2AOBS), we per<strong>for</strong>med the same experiment with different microscopes. When PPAR-CFP8
SBT was <strong>an</strong>alyzed on a Zeiss LSM510 Meta confocal microscope us<strong>in</strong>g the Meta array ofPMTs, a very similar <strong>in</strong>crease was observed when the SBT ratio was plotted as a function offluorophore <strong>in</strong>tensity. However, this donor SBT ratio was const<strong>an</strong>t on a wide-fieldmicroscope us<strong>in</strong>g a charge-coupled device (CCD) camera (data not shown). It there<strong>for</strong>eappeared that the dependency of the SBT ratio on fluorophore <strong>in</strong>tensity was restricted toconfocal microscopes. To further identify the possible causes lead<strong>in</strong>g to this variation, wetested the impact of laser power <strong>an</strong>d PMT ga<strong>in</strong> on SBT ratio variations. Variations of CFPSBT ratios were still observed when the laser was tuned from 15% to 75% of its maximumpower (data not shown). We then <strong>an</strong>alyzed SBT ratios with 4 different sett<strong>in</strong>gs where thega<strong>in</strong>s of the PMTs used <strong>for</strong> the detection <strong>in</strong> the donor <strong>an</strong>d <strong>FRET</strong> ch<strong>an</strong>nels were set to differentvoltages. Laser power was adjusted to allow the <strong>an</strong>alysis of the same batch of cells with eachsett<strong>in</strong>g (Fig. 2A). Interest<strong>in</strong>gly, whereas the CFP SBT ratio was <strong>in</strong>dependent of CFP <strong>in</strong>tensityat low PMT ga<strong>in</strong>s (500V donor / 530V <strong>FRET</strong>), this ratio <strong>in</strong>creased with CFP <strong>in</strong>tensity athigher ga<strong>in</strong>s. Similar results were obta<strong>in</strong>ed when only the donor or the <strong>FRET</strong> ga<strong>in</strong> werech<strong>an</strong>ged, or when both ga<strong>in</strong>s were ch<strong>an</strong>ged <strong>an</strong>d laser power was kept const<strong>an</strong>t (data notshown).These results suggested that problems <strong>in</strong> PMT l<strong>in</strong>earity could account <strong>for</strong> the observeddependency of SBT ratios on fluorophore <strong>in</strong>tensity. While it is more convenient to use twodifferent PMTs <strong>for</strong> the detection <strong>in</strong> the donor <strong>an</strong>d <strong>FRET</strong> ch<strong>an</strong>nels, we <strong>in</strong>vestigated whetherthe phenomenon could also be observed with one PMT only. When the same PMT <strong>for</strong> boththe donor <strong>an</strong>d <strong>FRET</strong> ch<strong>an</strong>nels was used, the SBT ratio was const<strong>an</strong>t, irrespective of the ga<strong>in</strong>applied to the PMT (Fig. 2B). This result suggests that the variations observed with the twoPMT setup, or with the array of PMTs, reflect a differential response of the PMTs.Improv<strong>in</strong>g <strong>FRET</strong> <strong>calculation</strong> by model<strong>in</strong>g SBT ratios as a function of fluorophore <strong>in</strong>tensity.9
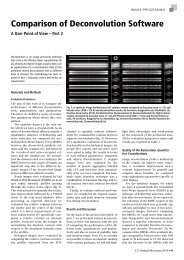
To circumvent the problem of SBT variation, us<strong>in</strong>g a unique PMT both <strong>for</strong> the detection ofthe donor <strong>an</strong>d of the acceptor seems there<strong>for</strong>e to be the best solution. However, this imposesto acquire the three ch<strong>an</strong>nels sequentially because of mech<strong>an</strong>ical movement of the PMT, atime-consum<strong>in</strong>g process <strong>which</strong> is not compatible with the <strong>FRET</strong> <strong>an</strong>alysis of rapidly diffus<strong>in</strong>gcomplexes.El<strong>an</strong>gov<strong>an</strong> et al have already reported the variation of SBT ratios as a function offluorophore <strong>in</strong>tensity <strong>an</strong>d proposed <strong>an</strong> eleg<strong>an</strong>t but only commercially available algorithm totackle this problem (El<strong>an</strong>gov<strong>an</strong> <strong>an</strong>d others, 2003). Alternately, we propose <strong>an</strong> easilyapplicable method that consists <strong>in</strong> model<strong>in</strong>g SBT ratios as a function of fluorophore <strong>in</strong>tensity.For the problem reported here<strong>in</strong>, the CFP SBT ratio c<strong>an</strong> be fitted as a function of CFP<strong>in</strong>tensity either with a l<strong>in</strong>ear or <strong>an</strong> exponential model (Fig. 3). These models are then used toestimate the SBT ratio correspond<strong>in</strong>g to each donor <strong>in</strong>tensity <strong>an</strong>d c<strong>an</strong> be implemented <strong>in</strong> theN<strong>FRET</strong> <strong>for</strong>mula described by Xia <strong>an</strong>d Liu (Xia <strong>an</strong>d Liu, 2001) as follows:(1)N<strong>FRET</strong> = F CFP+YFP − CFP CFP+YFP × a − YFP CFP+YFP × bCFP CFP+YFP× YFP CFP+YFP(Xia <strong>an</strong>d Liu, 2001)€€€(2)(3)l<strong>in</strong>N<strong>FRET</strong> = F CFP+YFP − CFP CFP+YFP × (c CFP × CFP CFP+YFP + d CFP ) − YFP CFP+YFP × bCFP CFP+YFP× YFP CFP+YFPexpN<strong>FRET</strong> = F CFP+YFP− CFP CFP+YFP× (e CFP× exp(CFP CFP+YFP× f CFP) + g CFP) − YFP CFP+YFP× bCFP CFP+YFP× YFP CFP+YFPwhere F, CFP <strong>an</strong>d YFP are the <strong>in</strong>tensities measured with the <strong>FRET</strong>, CFP <strong>an</strong>d YFP sett<strong>in</strong>gs(correspond to F, D <strong>an</strong>d A <strong>in</strong> the nomenclature proposed by Gordon et al. (Gordon <strong>an</strong>d others,1998)), a <strong>an</strong>d b are the average donor <strong>an</strong>d acceptor SBT ratios, <strong>an</strong>d c, d, e, f <strong>an</strong>d g are theconst<strong>an</strong>ts determ<strong>in</strong>ed by the fitt<strong>in</strong>g of the SBT ratio, accord<strong>in</strong>g to figure 3.To validate this approach, the three <strong>FRET</strong> <strong>calculation</strong> methods have then been comparedon the same set of data (Fig. 4). Cells were tr<strong>an</strong>sfected with expression vectors <strong>for</strong> ECFP <strong>an</strong>dEYFP (negative control), ECFP fused to EYFP (positive control), or PPAR-ECFP <strong>an</strong>d RXR-EYFP. The three <strong>for</strong>mulas give similar results <strong>for</strong> both the positive <strong>an</strong>d negative <strong>FRET</strong>10
controls as, under these experimental conditions, variations between cells are small <strong>an</strong>d allfluorescence <strong>in</strong>tensities are close to the average of the population used to calculate SBT ratios(Fig. 4A). The l<strong>in</strong>N<strong>FRET</strong> values are slightly higher due to the underestimation of the ECFPSBT <strong>for</strong> both low <strong>an</strong>d high ECFP <strong>in</strong>tensities (see Fig. 3A). The most dramatic effect is seenwhen N<strong>FRET</strong> is calculated <strong>for</strong> the <strong>in</strong>teraction between the two nuclear receptors. Indeed, themore accurate l<strong>in</strong>N<strong>FRET</strong> <strong>an</strong>d expN<strong>FRET</strong> <strong>calculation</strong>s signific<strong>an</strong>tly reduce st<strong>an</strong>dard deviation,with a more pronounced effect <strong>for</strong> expN<strong>FRET</strong>. In order to better characterize the reduction ofthe variability of the measurements when model<strong>in</strong>g SBT ratios, we plotted the differencebetween expN<strong>FRET</strong> or l<strong>in</strong>N<strong>FRET</strong> <strong>an</strong>d N<strong>FRET</strong> as a function of fluorophore <strong>in</strong>tensity (Fig.4B). In both cases, the highest variation was observed <strong>for</strong> extreme ECFP values <strong>for</strong> <strong>which</strong>us<strong>in</strong>g <strong>an</strong> average SBT ratio leads to a great under- or over-estimation of the correction factor(Fig. 4B <strong>an</strong>d 4C). The results obta<strong>in</strong>ed with l<strong>in</strong>N<strong>FRET</strong> <strong>an</strong>d expN<strong>FRET</strong> are hence not onlymore precise, but also improve the statistical properties of the data, allow<strong>in</strong>g to compare moreaccurately mild ch<strong>an</strong>ges. We also tried to fit the donor SBT with a 2 nd order polynomial modelrather th<strong>an</strong> <strong>an</strong> exponential growth, but this model greatly overestimates SBT values whendonor <strong>in</strong>tensities are very low or very high (data not shown).Pixel-by-pixel <strong>FRET</strong> <strong>an</strong>alysis <strong>an</strong>d visualizationCells are highly org<strong>an</strong>ized <strong>an</strong>d prote<strong>in</strong> distribution as well as <strong>in</strong>teractions are often limitedto specific compartments. It is hence crucial <strong>for</strong> biologists to be able to map <strong>in</strong>teractions withprecision with<strong>in</strong> a cell or a population of cells to better underst<strong>an</strong>d the spatial org<strong>an</strong>ization ofcellular activities. We there<strong>for</strong>e developed <strong>an</strong> <strong>ImageJ</strong> <strong>plug</strong>-<strong>in</strong> called "<strong>Pix<strong>FRET</strong></strong>" that allows togenerate normalized <strong>FRET</strong> images, by comput<strong>in</strong>g pixel by pixel the images of a sampleacquired <strong>in</strong> a three ch<strong>an</strong>nel sett<strong>in</strong>g. The <strong>plug</strong>-<strong>in</strong> allows either to enter m<strong>an</strong>ually SBTparameters <strong>for</strong> the donor <strong>an</strong>d the acceptor, or to determ<strong>in</strong>e these values onl<strong>in</strong>e us<strong>in</strong>g stacks of11
<strong>FRET</strong> <strong>an</strong>d donor or acceptor images. <strong>Pix<strong>FRET</strong></strong> is freely available on our website(http://www.unil.ch/cig/page16989.html) together with a detailed user's guide.The <strong>Pix<strong>FRET</strong></strong> <strong>plug</strong>-<strong>in</strong> requires different stacks of images: i) <strong>for</strong> <strong>FRET</strong> <strong>an</strong>alysis, a stack ofthree images taken <strong>in</strong> the <strong>FRET</strong>, Donor <strong>an</strong>d Acceptor sett<strong>in</strong>gs, ii) <strong>for</strong> Donor SBTdeterm<strong>in</strong>ation, a stack of two images of cells express<strong>in</strong>g the Donor only <strong>an</strong>d taken <strong>in</strong> the<strong>FRET</strong> <strong>an</strong>d Donor sett<strong>in</strong>gs, iii) <strong>for</strong> Acceptor SBT determ<strong>in</strong>ation, a stack of two images of cellsexpress<strong>in</strong>g the Acceptor only <strong>an</strong>d taken <strong>in</strong> the <strong>FRET</strong> <strong>an</strong>d Acceptor sett<strong>in</strong>gs.When launch<strong>in</strong>g <strong>Pix<strong>FRET</strong></strong>, <strong>an</strong> <strong>in</strong>terface appears where all parameters <strong>for</strong> <strong>FRET</strong> <strong>calculation</strong><strong>an</strong>d display c<strong>an</strong> be set (Fig. 5). The "Donor SBT" or "Acceptor SBT" bookmarks allow toevaluate SBT parameters (Fig. 5A). The user is first <strong>in</strong>vited to draw a region outside cells todeterm<strong>in</strong>e the background <strong>in</strong> each image of the stack. Then, one or several regions of <strong>in</strong>tereston the cells have to be drawn to allow <strong>Pix<strong>FRET</strong></strong> to plot SBT ratios as a function offluorophore <strong>in</strong>tensity. <strong>Pix<strong>FRET</strong></strong> then calculates the me<strong>an</strong> SBT, or the parameterscorrespond<strong>in</strong>g to the l<strong>in</strong>ear or exponential fit of the data. The user c<strong>an</strong> drag a slid<strong>in</strong>g w<strong>in</strong>dowon the plot to def<strong>in</strong>e on <strong>which</strong> set of po<strong>in</strong>ts the <strong>calculation</strong> is to be per<strong>for</strong>med <strong>an</strong>d may thenrescale the graph to the selected area by click<strong>in</strong>g the "Zoom" button. It is also noteworthy thatall parameters, <strong>in</strong>clud<strong>in</strong>g background (BG) values, c<strong>an</strong> be directly entered m<strong>an</strong>ually by theuser. Next, the stack with cells express<strong>in</strong>g both the donor <strong>an</strong>d the acceptor should be opened<strong>an</strong>d background should be determ<strong>in</strong>ed <strong>in</strong> the <strong>FRET</strong> bookmark (Fig. 5B) by draw<strong>in</strong>g a regionoutside cells. Backgrounds may also be modified m<strong>an</strong>ually to adjust the threshold above<strong>which</strong> N<strong>FRET</strong> is calculated. Indeed, the software operates N<strong>FRET</strong> <strong>calculation</strong> only when(i) the local me<strong>an</strong> pixel value, <strong>which</strong> is calculated by averag<strong>in</strong>g the values of the pixel of<strong>in</strong>terest <strong>an</strong>d that of its 8 surround<strong>in</strong>g neighbors, is above the me<strong>an</strong> background of the image <strong>in</strong>all three images, <strong>an</strong>d (ii) when the product of the me<strong>an</strong> pixel values <strong>for</strong> donor <strong>an</strong>d acceptor isabove the product of the backgrounds <strong>in</strong> the donor <strong>an</strong>d acceptor images. These conditions12
were <strong>in</strong>troduced to discard po<strong>in</strong>ts <strong>in</strong> the background that preclude the visualization of <strong>FRET</strong>with<strong>in</strong> the cell by generat<strong>in</strong>g aberr<strong>an</strong>tly high <strong>FRET</strong> values because of normalization. Allbackground values may also be ch<strong>an</strong>ged by a common multiplication factor <strong>which</strong> c<strong>an</strong> bespecified <strong>in</strong> the "Threshold Correction Factor" field. The program also offers the option tofilter the images with a Gaussi<strong>an</strong> blur, the st<strong>an</strong>dard deviation of the blur allow<strong>in</strong>g to tune thesmooth<strong>in</strong>g effect. Blurr<strong>in</strong>g notably reduces the noise <strong>an</strong>d improves the result<strong>in</strong>g image byprevent<strong>in</strong>g aberr<strong>an</strong>t <strong>FRET</strong> values <strong>in</strong> the background. F<strong>in</strong>ally, the normalization method has tobe selected. Indeed, the <strong>FRET</strong> values <strong>for</strong> each pixel c<strong>an</strong> be divided by the value <strong>in</strong> the samepixel of the donor <strong>in</strong>tensity, the acceptor <strong>in</strong>tensity, the product of donor <strong>an</strong>d acceptor<strong>in</strong>tensities or the square root of the product of donor <strong>an</strong>d acceptor <strong>in</strong>tensities. Click<strong>in</strong>g on the"Compute <strong>FRET</strong>" button will generate the normalized <strong>FRET</strong> images, but also will log allparameters to a text file <strong>which</strong> will be reloaded when the <strong>plug</strong>-<strong>in</strong> is re-launched.<strong>FRET</strong> <strong>an</strong>d N<strong>FRET</strong> are calculated only if pixel values <strong>in</strong> each image are above a giventhreshold. Otherwise the value is set to zero <strong>in</strong> the computed image <strong>an</strong>d the pixel is displayed<strong>in</strong> blue <strong>in</strong> order to better visualize all the <strong>FRET</strong> values of the image (Fig. 6B). Indeed, even ifwith<strong>in</strong> a cell the average <strong>FRET</strong> value is positive, some pixels may have negative values,especially when the <strong>FRET</strong> efficiency is low. S<strong>in</strong>ce the output image is displayed with a 256grayscale look-up table, the background, <strong>which</strong> corresponds to a value of zero, may appear <strong>in</strong>grey (<strong>an</strong>d not black as <strong>in</strong>tuitively expected) if negative pixels are present <strong>in</strong> the image, therebypreclud<strong>in</strong>g a good visual exam<strong>in</strong>ation of the generated <strong>FRET</strong> image. The background pixelsare hence automatically colorized <strong>in</strong> blue us<strong>in</strong>g a look-up-table designed <strong>for</strong> this purpose.Test of the <strong>Pix<strong>FRET</strong></strong> <strong>plug</strong>-<strong>in</strong>.To validate the tools described above, we per<strong>for</strong>med a pixel-by-pixel <strong>an</strong>alysis of <strong>FRET</strong> bycomput<strong>in</strong>g <strong>an</strong> image of two cells express<strong>in</strong>g different amounts of PPAR-ECFP <strong>an</strong>d RXR-EYFP (Fig. 6) <strong>an</strong>d compared the impact of us<strong>in</strong>g const<strong>an</strong>t or fitted SBT ratios on <strong>FRET</strong>13
display. S<strong>in</strong>ce these cells express the same ECFP <strong>an</strong>d EYFP fusion prote<strong>in</strong>s, both of themshould exhibit similar normalized <strong>FRET</strong> values. When const<strong>an</strong>t SBT ratios are used, <strong>FRET</strong>efficiency appears higher <strong>in</strong> cell #2 th<strong>an</strong> cell #1 (Fig. 6B <strong>an</strong>d 6C, left p<strong>an</strong>els), whereas the useof the expN<strong>FRET</strong> <strong>for</strong>mula generated <strong>an</strong> image where the two cells display similar <strong>in</strong>tensities(Fig. 6B <strong>an</strong>d 6C, right p<strong>an</strong>els). This visual appreciation of the adv<strong>an</strong>tage of us<strong>in</strong>g expN<strong>FRET</strong>was confirmed when the distributions of pixel <strong>in</strong>tensities with<strong>in</strong> each cell were plotted ashistograms <strong>an</strong>d average <strong>FRET</strong> values calculated (Fig. 6D). When const<strong>an</strong>t SBT ratios wereused, the average normalized <strong>FRET</strong> value <strong>in</strong> cell #1 was 4.9, versus 13.8 <strong>in</strong> cell #2, whereasthe use of expN<strong>FRET</strong> generated closer me<strong>an</strong> values (9.6 <strong>for</strong> cell #1 versus 7.4 <strong>for</strong> cell #2).Indeed, when us<strong>in</strong>g <strong>an</strong> average SBT ratio <strong>for</strong> normalized <strong>FRET</strong> <strong>calculation</strong> (see <strong>for</strong>mula 1above), most donor SBT values are underestimated <strong>in</strong> cell #2, where CFP levels are high, <strong>an</strong>doverestimated <strong>in</strong> cell #1 where CFP levels are low. This is why. Overall <strong>an</strong>d consistent withwhat was observed at the cell population level <strong>in</strong> Fig. 4, the use of the exponential fit allows abetter normalization of the data by reduc<strong>in</strong>g the variability of <strong>FRET</strong> signals generated fromdifferent r<strong>an</strong>ges of fluorophore <strong>in</strong>tensity.14
Discussion<strong>FRET</strong> is a technique whose use is rapidly exp<strong>an</strong>d<strong>in</strong>g among cell biologists as it providesvery valuable <strong>in</strong><strong>for</strong>mation about physical <strong>in</strong>teractions between molecules with<strong>in</strong> cells.Numerous procedures exist <strong>an</strong>d have been used to determ<strong>in</strong>e <strong>FRET</strong> <strong>in</strong> liv<strong>in</strong>g cells, each ofthem hav<strong>in</strong>g adv<strong>an</strong>tages <strong>an</strong>d drawbacks (Berney <strong>an</strong>d D<strong>an</strong>user, 2003) <strong>an</strong>d we are still <strong>in</strong> aphase where the robustness of the methods has to be improved. One import<strong>an</strong>t issue that hasreceived only limited attention so far is the variation of SBT ratios as a function offluorophore <strong>in</strong>tensity when per<strong>for</strong>m<strong>in</strong>g sensitized emission <strong>FRET</strong>. Us<strong>in</strong>g the most widelyused fluorophore pair <strong>in</strong> cell biology, i.e. ECFP <strong>an</strong>d EYFP, we show that under somecommon technical circumst<strong>an</strong>ces, these ratios are not const<strong>an</strong>t <strong>an</strong>d c<strong>an</strong> vary with fluorophoreconcentration. In cases where the variations of fluorophore concentrations are small, assum<strong>in</strong>gconst<strong>an</strong>t SBT ratios may be sufficient to get data of satisfactory accuracy. However, whenthese SBT ratios vary import<strong>an</strong>tly <strong>an</strong>d thereby clearly bias <strong>FRET</strong> <strong>calculation</strong>, <strong>an</strong>d when onlysmall variations <strong>in</strong> <strong>FRET</strong> efficiency are expected between cells or samples, solutions to tacklethis problem are required.Variations <strong>in</strong> SBT ratios as a function of fluorophore <strong>in</strong>tensity could be assigned here to adifferential response of the PMTs used <strong>for</strong> detection <strong>in</strong> the Donor <strong>an</strong>d <strong>FRET</strong> ch<strong>an</strong>nels.Whereas us<strong>in</strong>g a unique PMT both <strong>for</strong> the detection of the donor <strong>an</strong>d of the acceptor couldcircumvent this problem, the required mech<strong>an</strong>ical movement of the PMT (or of the filter cubewheel <strong>in</strong> other set-ups) implies that the images <strong>in</strong> the <strong>FRET</strong>, the donor <strong>an</strong>d the acceptorch<strong>an</strong>nels are acquired sequentially. While this approach is well applicable to fixed samples orto slowly diffus<strong>in</strong>g or immobile prote<strong>in</strong>s, it is more problematic <strong>for</strong> the study of <strong>in</strong>teractionsof highly mobile prote<strong>in</strong>s such as PPARs (Feige <strong>an</strong>d others, 2005). Sc<strong>an</strong>n<strong>in</strong>g each ch<strong>an</strong>nelbetween l<strong>in</strong>es, <strong>which</strong> c<strong>an</strong> only be per<strong>for</strong>med with 2 separate PMTs, there<strong>for</strong>e allows to limit15
the diffusion of the <strong>in</strong>teract<strong>in</strong>g complexes dur<strong>in</strong>g the time of sc<strong>an</strong>n<strong>in</strong>g. It is noteworthy that ona different microscope, us<strong>in</strong>g <strong>an</strong> array of PMTs, the same problem was encountered. Hence,our results are of general <strong>in</strong>terest to scientists per<strong>for</strong>m<strong>in</strong>g <strong>FRET</strong> on a confocal microscope.Interest<strong>in</strong>gly, Chen <strong>an</strong>d collaborators have also observed variations <strong>in</strong> SBT ratios whenper<strong>for</strong>m<strong>in</strong>g <strong>FRET</strong> with a 2-photon excitation setup (Chen <strong>an</strong>d others, 2005), <strong>an</strong>d consistentwith our study, they did not observe <strong>an</strong>y variation of the SBT ratios on a wide-fieldmicroscope us<strong>in</strong>g CCD camera detection.In cases where SBT ratios vary as a function of fluorescence <strong>in</strong>tensity, we showed that<strong>FRET</strong> <strong>calculation</strong> c<strong>an</strong> be improved by model<strong>in</strong>g these variations. This is particularlyimport<strong>an</strong>t when fluorophore <strong>in</strong>tensities vary greatly between cells. We demonstrated here thatthe expN<strong>FRET</strong> method reduces the variability of the <strong>FRET</strong> values calculated <strong>for</strong> thePPAR/RXR <strong>in</strong>teraction. Whereas <strong>in</strong> our case, the exponential model<strong>in</strong>g generated the bestresults, other fits might be tested <strong>in</strong> situations where SBT ratios vary differently.Cells are highly org<strong>an</strong>ized <strong>an</strong>d prote<strong>in</strong> distribution as well as <strong>in</strong>teractions are often limitedto specific compartments. It is hence of import<strong>an</strong>ce to be able to map <strong>FRET</strong> precisely with<strong>in</strong>cells to better characterize the mode of action of <strong>in</strong>teract<strong>in</strong>g prote<strong>in</strong>s. To achieve this goal, wedeveloped a <strong>plug</strong>-<strong>in</strong> called <strong>Pix<strong>FRET</strong></strong> <strong>for</strong> the <strong>ImageJ</strong> software that generates <strong>an</strong> image whereN<strong>FRET</strong> is calculated <strong>for</strong> each pixel. The <strong>plug</strong>-<strong>in</strong> allows to directly determ<strong>in</strong>e the SBTparameters from images acquired when only the donor or the acceptor are present. As variousnormalization methods have been proposed (Gordon <strong>an</strong>d others, 1998; Xia <strong>an</strong>d Liu, 2001),<strong>Pix<strong>FRET</strong></strong> allows the user to choose the type of normalization desired. To our knowledge, thisis the first freely available program that offers such possibilities <strong>an</strong>d the source files will beavailable upon request, allow<strong>in</strong>g users to program specific SBT ratio model<strong>in</strong>g methodsaccord<strong>in</strong>g to their needs.16
In conclusion, we uncovered the bias that the use of several PMTs may <strong>in</strong>troduce whenper<strong>for</strong>m<strong>in</strong>g <strong>FRET</strong> experiments. We show that <strong>in</strong> cases where a set-up with two PMTs or <strong>an</strong>array of PMTs is preferred or required, this bias c<strong>an</strong> be circumvented by a simple model<strong>in</strong>g ofSBT ratios. We also developed a user-friendly <strong>an</strong>d free <strong>in</strong>terface, called <strong>Pix<strong>FRET</strong></strong>, that allowsa simple <strong>an</strong>d rapid determ<strong>in</strong>ation of SBT parameters <strong>an</strong>d to display normalized <strong>FRET</strong> images.Altogether, these results <strong>an</strong>d the <strong>Pix<strong>FRET</strong></strong> <strong>plug</strong>-<strong>in</strong> will help cell biologists to <strong>in</strong>crease theprecision of <strong>FRET</strong> <strong>an</strong>alyses conducted on confocal microscopes as well as the visualization<strong>an</strong>d localization of <strong>in</strong>teractions <strong>in</strong> liv<strong>in</strong>g cells.17
ReferencesBerney C, D<strong>an</strong>user G. 2003. <strong>FRET</strong> or no <strong>FRET</strong>: a qu<strong>an</strong>titative comparison. Biophys J84(6):3992-4010.Chen Y, El<strong>an</strong>gov<strong>an</strong> M, Periasamy A. 2005. Chapter 7- <strong>FRET</strong> Data Analysis: The Algorithm.In: Periasamy A, Day RN, editors. Molecular Imag<strong>in</strong>g: <strong>FRET</strong> Microscopy <strong>an</strong>dSpectroscopy: Ox<strong>for</strong>d University Press. p In press.DeGrazia MJ, Thompson J, Heuvel JP, Peterson BR. 2003. Synthesis of a high-aff<strong>in</strong>ityfluorescent PPARgamma lig<strong>an</strong>d <strong>for</strong> high-throughput fluorescence polarization assays.Bioorg Med Chem 11(20):4325-32.El<strong>an</strong>gov<strong>an</strong> M, Wallrabe H, Chen Y, Day RN, Barroso M, Periasamy A. 2003.Characterization of one- <strong>an</strong>d two-photon excitation fluorescence reson<strong>an</strong>ce energytr<strong>an</strong>sfer microscopy. Methods 29(1):58-73.Feige JN, Gelm<strong>an</strong> L, Tudor C, Engelborghs Y, Wahli W, Desvergne B. 2005. Fluorescenceimag<strong>in</strong>g reveals the nuclear behavior of PPAR/RXR heterodimers <strong>in</strong> the absence <strong>an</strong>dpresence of lig<strong>an</strong>d. J. Biol. Chem.:In Press.Gordon GW, Berry G, Li<strong>an</strong>g XH, Lev<strong>in</strong>e B, Herm<strong>an</strong> B. 1998. Qu<strong>an</strong>titative fluorescencereson<strong>an</strong>ce energy tr<strong>an</strong>sfer measurements us<strong>in</strong>g fluorescence microscopy. Biophys J74(5):2702-13.Jares-Erijm<strong>an</strong> EA, Jov<strong>in</strong> TM. 2003. <strong>FRET</strong> imag<strong>in</strong>g. Nat Biotechnol 21(11):1387-95.Rehm M, Dussm<strong>an</strong>n H, J<strong>an</strong>icke RU, Tavare JM, Kogel D, Prehn JH. 2002. S<strong>in</strong>gle-cellfluorescence reson<strong>an</strong>ce energy tr<strong>an</strong>sfer <strong>an</strong>alysis demonstrates that caspase activationdur<strong>in</strong>g apoptosis is a rapid process. Role of caspase-3. J Biol Chem 277(27):24506-14.Sekar RB, Periasamy A. 2003. Fluorescence reson<strong>an</strong>ce energy tr<strong>an</strong>sfer (<strong>FRET</strong>) microscopyimag<strong>in</strong>g of live cell prote<strong>in</strong> localizations. J Cell Biol 160(5):629-33.Wouters FS, Verveer PJ, Bastiaens PI. 2001. Imag<strong>in</strong>g biochemistry <strong>in</strong>side cells. Trends CellBiol 11(5):203-11.Xia Z, Liu Y. 2001. Reliable <strong>an</strong>d global measurement of fluorescence reson<strong>an</strong>ce energytr<strong>an</strong>sfer us<strong>in</strong>g fluorescence microscopes. Biophys J 81(4):2395-402.18
AcknowledgementsWe th<strong>an</strong>k Dr Claude Berney <strong>for</strong> valuable discussions <strong>an</strong>d <strong>for</strong> the read<strong>in</strong>g of the m<strong>an</strong>uscript,Dr Nathalie Gar<strong>in</strong> <strong>for</strong> access to the ISREC imag<strong>in</strong>g plat<strong>for</strong>m, Drs Peterson <strong>an</strong>d DeGrazia <strong>for</strong>the gift of the GI-FITC lig<strong>an</strong>d <strong>an</strong>d Dr Tavaré <strong>for</strong> the gift of the EYFP-ECFP construct. Thiswork was supported by gr<strong>an</strong>ts from the UNIL/EPFL fund, the National Research Project 50,the Swiss National Science Foundation <strong>an</strong>d the Etat de Vaud.19
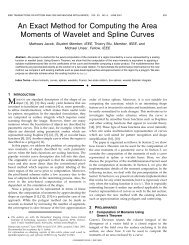
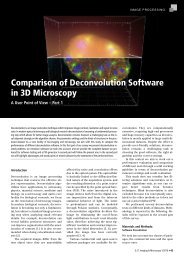
Legends to figuresFigure 1 : The donor bleed-through ratio <strong>in</strong>creases with donor <strong>in</strong>tensity. (A) Cos-7cells were tr<strong>an</strong>sfected with <strong>an</strong> expression vector <strong>for</strong> PPARα-ECFP. Fluorescence <strong>in</strong>tensity <strong>in</strong>the ECFP (Exc. 405nm / Em. 465-485nm - PMT1) <strong>an</strong>d <strong>FRET</strong> (Exc. 405nm / Em. 525-545nm – PMT2) sett<strong>in</strong>gs was measured on at least 300 cells. The SBT ratio is the ratiobetween the average <strong>FRET</strong> <strong>an</strong>d ECFP <strong>in</strong>tensities measured <strong>in</strong> <strong>in</strong>dividual cells. F CFP <strong>an</strong>dCFP CFP are the <strong>in</strong>tensities measured <strong>in</strong> the <strong>FRET</strong> <strong>an</strong>d CFP sett<strong>in</strong>gs respectively, when onlyCFP is present. (B) Liv<strong>in</strong>g Cos-7 cells were <strong>in</strong>cubated with GI262570-FITC. Fluorescence<strong>in</strong>tensity <strong>in</strong> the FITC (Exc. 488nm / Em. 510-530nm - PMT1) <strong>an</strong>d <strong>FRET</strong> (Exc. 488nm / Em.565-585nm – PMT2) sett<strong>in</strong>gs was measured on at least 100 cells. The SBT ratio is the ratiobetween the average <strong>FRET</strong> <strong>an</strong>d FITC <strong>in</strong>tensities measured <strong>in</strong> <strong>in</strong>dividual cells.Figure 2 : Influence of PMT ga<strong>in</strong> on the relationship between ECFP SBT ratio <strong>an</strong>dECFP <strong>in</strong>tensity. Cos-7 cells were tr<strong>an</strong>sfected with <strong>an</strong> expression vector <strong>for</strong> PPARα-ECFP.Fluorescence <strong>in</strong>tensity <strong>in</strong> the ECFP <strong>an</strong>d <strong>FRET</strong> sett<strong>in</strong>gs was measured on at least 100 cells percondition. The percentage of SBT is the ratio between the average <strong>FRET</strong> <strong>an</strong>d ECFP <strong>in</strong>tensitiesmeasured <strong>in</strong> <strong>in</strong>dividual cells. (A) The ga<strong>in</strong> <strong>an</strong>d laser power were set as <strong>in</strong>dicated us<strong>in</strong>g PMT1<strong>an</strong>d PMT2 <strong>for</strong> ECFP (465-485nm) <strong>an</strong>d <strong>FRET</strong> (525-545nm) detection, respectively. (B) Thega<strong>in</strong> <strong>an</strong>d laser power were set as <strong>in</strong>dicated us<strong>in</strong>g PMT2 both <strong>for</strong> ECFP <strong>an</strong>d <strong>FRET</strong> detection.Figure 3 : The ECFP SBT ratio c<strong>an</strong> be fitted as a function of ECFP <strong>in</strong>tensity. The datafrom figure 1 were fitted with a l<strong>in</strong>ear (A) or <strong>an</strong> exponential (B) model.Figure 4 : l<strong>in</strong>N<strong>FRET</strong> <strong>an</strong>d expN<strong>FRET</strong> reduce N<strong>FRET</strong> variability. Cos-7 cells weretr<strong>an</strong>sfected with expression vectors <strong>for</strong> ECFP <strong>an</strong>d EYFP, ECFP fused to EYFP, or PPARα-20
ECFP <strong>an</strong>d RXRα-EYFP. Fluorescence <strong>in</strong>tensity <strong>in</strong> the ECFP, EYFP <strong>an</strong>d <strong>FRET</strong> sett<strong>in</strong>gs wasmeasured on at least 50 cells. (A) <strong>FRET</strong> was calculated accord<strong>in</strong>g to the three <strong>for</strong>mulasdescribed <strong>in</strong> the text. (B) The difference between l<strong>in</strong>N<strong>FRET</strong> or expN<strong>FRET</strong> <strong>an</strong>d N<strong>FRET</strong>calculated <strong>for</strong> the PPAR/RXR pair was plotted as a function of ECFP <strong>in</strong>tensity. (C) Thepercentage error between N<strong>FRET</strong> <strong>an</strong>d l<strong>in</strong>N<strong>FRET</strong> or expN<strong>FRET</strong> calculated <strong>for</strong> thePPAR/RXR pair was plotted as a function of ECFP <strong>in</strong>tensity.Figure 5 : pix<strong>FRET</strong> <strong>plug</strong>-<strong>in</strong> <strong>in</strong>terfaces.(A) SBT determ<strong>in</strong>ation <strong>in</strong>terface. (B) <strong>FRET</strong> <strong>in</strong>terface.Figure 6 : expN<strong>FRET</strong> reduces <strong>in</strong>ter-cellular variability <strong>in</strong> pixel-by-pixel <strong>an</strong>alyses.Cos-7 cells were tr<strong>an</strong>sfected with expression vectors <strong>for</strong> PPARα-ECFP <strong>an</strong>d RXRα-EYFP.(A) Images of two cells express<strong>in</strong>g both PPAR-ECFP <strong>an</strong>d RXR-EYFP <strong>in</strong> the CFP <strong>an</strong>d YFPsett<strong>in</strong>g. A Gaussi<strong>an</strong> blur of 1 was applied to the orig<strong>in</strong>al image. (B) N<strong>FRET</strong> <strong>an</strong>d expN<strong>FRET</strong>images generated by the correspond<strong>in</strong>g <strong>Pix<strong>FRET</strong></strong> <strong>plug</strong>-<strong>in</strong>s. (C) Same as (B) but the cells arepseudo-colorized with a different look up table to better visualize <strong>in</strong>tensity differences. (D)Distribution of pixel <strong>in</strong>tensities with<strong>in</strong> the two cells when the N<strong>FRET</strong> or expN<strong>FRET</strong> methodsare used. The red bar <strong>an</strong>d the number <strong>in</strong>dicate the me<strong>an</strong> <strong>in</strong>tensity over the entire cell.21
Feige et al. - Fig. 1A0.7B0.35SBT ratio = F CFP /CFP CFP0.60.50.40.30.20.1SBT ratio = F FITC /FITC FITC0.30.250.20.150.10.0500 50 100 150 200 250CFP CFP00 50 100 150 200 250FITC FITC
AF CFP /CFP CFP0.70.60.50.40.30.20.100 50 100 150 200 250F CFP /CFP CFP0.70.60.50.40.30.20.1CFP CFP00 50 100 150 200 250CFP CFPFeige et al. - Fig. 2ACFP CFP PMT1 : 500V / Laser : 70%F CFP PMT2 : 530V / Laser : 70%CFP CFP PMT1 : 600V / Laser : 25%F CFP PMT2 : 630V / Laser : 25%F CFP /CFP CFP0.70.60.50.40.30.20.100 50 100 150 200 250F CFP /CFP CFP0.70.60.50.40.30.20.1CFP CFP0CFP CFP PMT1 : 700V / Laser : 15%F CFP PMT2 : 730V / Laser : 15%0 50 100 150 200 250CFP CFPCFP CFP PMT1 : 800V / Laser : 10%F CFP PMT2 : 830V / Laser : 10%
BF CFP /CFP CFP0.70.60.50.40.30.20.100 50 100 150 200 250F CFP /CFP CFP0.70.60.50.40.30.20.1CFP CFP00 50 100 150 200 250CFP CFPFeige et al. - Fig. 2BCFP CFP PMT2 : 530V / Laser : 70%F CFP PMT2 : 530V / Laser : 70%CFP CFP PMT2 : 630V / Laser : 25%F CFP PMT2 : 630V / Laser : 25%F CFP /CFP CFP0.70.60.50.40.30.20.100 50 100 150 200 250F CFP /CFP CFP0.70.60.50.40.30.20.1CFP CFP0CFP CFP PMT2 : 730V / Laser : 15%F CFP PMT2 : 730V / Laser : 15%0 50 100 150 200 250CFP CFPCFP CFP PMT2 : 830V / Laser : 10%F CFP PMT2 : 830V / Laser : 10%
Feige et al. - Fig. 3ABBT CFP = c CFP x CFP CFP + d CFPBT CFP = e CFP x exp(CFP CFP x f CFP ) + g CFPc CFP = 0.0868d CFP = 33.33R 2 = 0.68e CFP = 0.0076f CFP = 0.0158g CFP = 0.37R 2 = 0.760.70.7SBT ratio = F CFP /CFP CFP0.60.50.40.30.20.1Average SBTratio0.60.50.40.30.20.1Average SBTratio00 50 100 150 200 250CFP CFP00 50 100 150 200 250CFP CFP
A<strong>FRET</strong> average(x100)60N<strong>FRET</strong>l<strong>in</strong>N<strong>FRET</strong>expN<strong>FRET</strong>Bl<strong>in</strong>N<strong>FRET</strong>-N<strong>FRET</strong> (x100)1510Feige et al. - Fig. 4504050-5-1050 100 150 200CFP CFP30-15-202010expN<strong>FRET</strong>-N<strong>FRET</strong> (x100)15100-10CFP+YFPCFPYFPPPAR+RXRCFPYFP50-5-10-15-2050 100 150 200CFP CFPC| l<strong>in</strong>N<strong>FRET</strong>-N<strong>FRET</strong> || l<strong>in</strong>N<strong>FRET</strong> |600%400%200%| expN<strong>FRET</strong>-N<strong>FRET</strong> || expN<strong>FRET</strong> |2000%1500%1000%500%50 100 150 200CFP CFP50 100 150 200CFP CFP
ABFeige et al. - Fig. 5
ACell #1 Cell #2 Feige et al. - Fig. 6BCFPYFPN<strong>FRET</strong>expN<strong>FRET</strong>CN<strong>FRET</strong>expN<strong>FRET</strong>DCell #14.9Cell #19.6-20 -10 0 10 20 30 40 -20 -10 0 10 20 30 40N<strong>FRET</strong>expN<strong>FRET</strong>Cell #2 13.8Cell #2 7.4