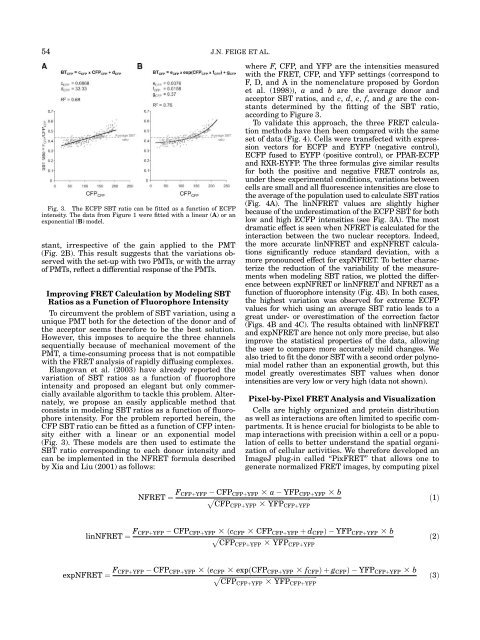
54 J.N. FEIGE ET AL.Fig. 3. The ECFP SBT ratio c<strong>an</strong> be fitted as a function of ECFP<strong>in</strong>tensity. The data from Figure 1 were fitted with a l<strong>in</strong>ear (A) or <strong>an</strong>exponential (B) model.st<strong>an</strong>t, irrespective of the ga<strong>in</strong> applied to the PMT(Fig. 2B). This result suggests that the variations observedwith the set-up with two PMTs, or with the arrayof PMTs, reflect a differential response of the PMTs.Improv<strong>in</strong>g <strong>FRET</strong> Calculation by Model<strong>in</strong>g SBTRatios as a Function of Fluorophore IntensityTo circumvent the problem of SBT variation, us<strong>in</strong>g aunique PMT both <strong>for</strong> the detection of the donor <strong>an</strong>d ofthe acceptor seems there<strong>for</strong>e to be the best solution.However, this imposes to acquire the three ch<strong>an</strong>nelssequentially because of mech<strong>an</strong>ical movement of thePMT, a time-consum<strong>in</strong>g process that is not compatiblewith the <strong>FRET</strong> <strong>an</strong>alysis of rapidly diffus<strong>in</strong>g complexes.El<strong>an</strong>gov<strong>an</strong> et al. (2003) have already reported thevariation of SBT ratios as a function of fluorophore<strong>in</strong>tensity <strong>an</strong>d proposed <strong>an</strong> eleg<strong>an</strong>t but only commerciallyavailable algorithm to tackle this problem. Alternately,we propose <strong>an</strong> easily applicable method thatconsists <strong>in</strong> model<strong>in</strong>g SBT ratios as a function of fluorophore<strong>in</strong>tensity. For the problem reported here<strong>in</strong>, theCFP SBT ratio c<strong>an</strong> be fitted as a function of CFP <strong>in</strong>tensityeither with a l<strong>in</strong>ear or <strong>an</strong> exponential model(Fig. 3). These models are then used to estimate theSBT ratio correspond<strong>in</strong>g to each donor <strong>in</strong>tensity <strong>an</strong>dc<strong>an</strong> be implemented <strong>in</strong> the N<strong>FRET</strong> <strong>for</strong>mula describedby Xia <strong>an</strong>d Liu (2001) as follows:where F, CFP, <strong>an</strong>d YFP are the <strong>in</strong>tensities measuredwith the <strong>FRET</strong>, CFP, <strong>an</strong>d YFP sett<strong>in</strong>gs (correspond toF, D, <strong>an</strong>d A <strong>in</strong> the nomenclature proposed by Gordonet al. (1998)), a <strong>an</strong>d b are the average donor <strong>an</strong>dacceptor SBT ratios, <strong>an</strong>d c, d, e, f, <strong>an</strong>d g are the const<strong>an</strong>tsdeterm<strong>in</strong>ed by the fitt<strong>in</strong>g of the SBT ratio,accord<strong>in</strong>g to Figure 3.To validate this approach, the three <strong>FRET</strong> <strong>calculation</strong>methods have then been compared with the sameset of data (Fig. 4). Cells were tr<strong>an</strong>sfected with expressionvectors <strong>for</strong> ECFP <strong>an</strong>d EYFP (negative control),ECFP fused to EYFP (positive control), or PPAR-ECFP<strong>an</strong>d RXR-EYFP. The three <strong>for</strong>mulas give similar results<strong>for</strong> both the positive <strong>an</strong>d negative <strong>FRET</strong> controls as,under these experimental conditions, variations betweencells are small <strong>an</strong>d all fluorescence <strong>in</strong>tensities are close tothe average of the population used to calculate SBT ratios(Fig. 4A). The l<strong>in</strong>N<strong>FRET</strong> values are slightly higherbecause of the underestimation of the ECFP SBT <strong>for</strong> bothlow <strong>an</strong>d high ECFP <strong>in</strong>tensities (see Fig. 3A). The mostdramatic effect is seen when N<strong>FRET</strong> is calculated <strong>for</strong> the<strong>in</strong>teraction between the two nuclear receptors. Indeed,the more accurate l<strong>in</strong>N<strong>FRET</strong> <strong>an</strong>d expN<strong>FRET</strong> <strong>calculation</strong>ssignific<strong>an</strong>tly reduce st<strong>an</strong>dard deviation, with amore pronounced effect <strong>for</strong> expN<strong>FRET</strong>. To better characterizethe reduction of the variability of the measurementswhen model<strong>in</strong>g SBT ratios, we plotted the differencebetween expN<strong>FRET</strong> or l<strong>in</strong>N<strong>FRET</strong> <strong>an</strong>d N<strong>FRET</strong> as afunction of fluorophore <strong>in</strong>tensity (Fig. 4B). In both cases,the highest variation was observed <strong>for</strong> extreme ECFPvalues <strong>for</strong> which us<strong>in</strong>g <strong>an</strong> average SBT ratio leads to agreat under- or overestimation of the correction factor(Figs. 4B <strong>an</strong>d 4C). The results obta<strong>in</strong>ed with l<strong>in</strong>N<strong>FRET</strong><strong>an</strong>d expN<strong>FRET</strong> are hence not only more precise, but alsoimprove the statistical properties of the data, allow<strong>in</strong>gthe user to compare more accurately mild ch<strong>an</strong>ges. Wealso tried to fit the donor SBT with a second order polynomialmodel rather th<strong>an</strong> <strong>an</strong> exponential growth, but thismodel greatly overestimates SBT values when donor<strong>in</strong>tensities are very low or very high (data not shown).Pixel-by-Pixel <strong>FRET</strong> Analysis <strong>an</strong>d VisualizationCells are highly org<strong>an</strong>ized <strong>an</strong>d prote<strong>in</strong> distributionas well as <strong>in</strong>teractions are often limited to specific compartments.It is hence crucial <strong>for</strong> biologists to be able tomap <strong>in</strong>teractions with precision with<strong>in</strong> a cell or a populationof cells to better underst<strong>an</strong>d the spatial org<strong>an</strong>izationof cellular activities. We there<strong>for</strong>e developed <strong>an</strong><strong>ImageJ</strong> <strong>plug</strong>-<strong>in</strong> called ‘‘<strong>Pix<strong>FRET</strong></strong>’’ that allows one togenerate normalized <strong>FRET</strong> images, by comput<strong>in</strong>g pixelN<strong>FRET</strong> ¼ F CFPþYFP CFP CFPþYFP 3 a YFP CFPþYFP 3 bpffiffiffiffiffiffiffiffiffiffiffiffiffiffiffiffiffiffiffiffiffiffiffiffiffiffiffiffiffiffiffiffiffiffiffiffiffiffiffiffiffiffiffiffiffiffiffiffiffiffiffiffiffiffiffiffiffiffiffiffiCFP CFPþYFP 3 YFP CFPþYFPð1Þl<strong>in</strong>N<strong>FRET</strong> ¼ F CFPþYFP CFP CFPþYFP 3 ðc CFP 3 CFP CFPþYFP þ d CFP Þ YFP CFPþYFP 3 bpffiffiffiffiffiffiffiffiffiffiffiffiffiffiffiffiffiffiffiffiffiffiffiffiffiffiffiffiffiffiffiffiffiffiffiffiffiffiffiffiffiffiffiffiffiffiffiffiffiffiffiffiffiffiffiffiffiffiffiffiCFP CFPþYFP 3 YFP CFPþYFPð2ÞexpN<strong>FRET</strong> ¼ F CFPþYFP CFP CFPþYFP 3 ðe CFP 3 expðCFP CFPþYFP 3 f CFP Þ þ g CFP Þ YFP CFPþYFP 3 bpffiffiffiffiffiffiffiffiffiffiffiffiffiffiffiffiffiffiffiffiffiffiffiffiffiffiffiffiffiffiffiffiffiffiffiffiffiffiffiffiffiffiffiffiffiffiffiffiffiffiffiffiffiffiffiffiffiffiffiffiCFP CFPþYFP 3 YFP CFPþYFPð3Þ
<strong>Pix<strong>FRET</strong></strong>: AN IMAGEJ PLUG-IN FOR PIXEL-BY-PIXEL ANALYSIS OF <strong>FRET</strong>Fig. 4. l<strong>in</strong>N<strong>FRET</strong> <strong>an</strong>d expN<strong>FRET</strong> reduce N<strong>FRET</strong> variability. Cos-7 cells were tr<strong>an</strong>sfected with expression vectors <strong>for</strong> ECFP <strong>an</strong>d EYFP,ECFP fused to EYFP, or PPARa-ECFP <strong>an</strong>d RXRa-EYFP. Fluorescence<strong>in</strong>tensity <strong>in</strong> the ECFP, EYFP, <strong>an</strong>d <strong>FRET</strong> sett<strong>in</strong>gs was measured on atleast 50 cells. A: <strong>FRET</strong> was calculated accord<strong>in</strong>g to the three <strong>for</strong>mulasdescribed <strong>in</strong> the text. B: The difference between l<strong>in</strong>N<strong>FRET</strong> orexpN<strong>FRET</strong> <strong>an</strong>d N<strong>FRET</strong> calculated <strong>for</strong> the PPAR/RXR pair was plottedas a function of ECFP <strong>in</strong>tensity. C: The percentage error betweenN<strong>FRET</strong> <strong>an</strong>d l<strong>in</strong>N<strong>FRET</strong> or expN<strong>FRET</strong> calculated <strong>for</strong> the PPAR/RXRpair was plotted as a function of ECFP <strong>in</strong>tensity.by pixel the images of a sample acquired <strong>in</strong> a threech<strong>an</strong>nelsett<strong>in</strong>g. The <strong>plug</strong>-<strong>in</strong> allows one to either enterm<strong>an</strong>ually SBT parameters <strong>for</strong> the donor <strong>an</strong>d theacceptor, or determ<strong>in</strong>e these values onl<strong>in</strong>e us<strong>in</strong>g stacksof <strong>FRET</strong> <strong>an</strong>d donor or acceptor images. <strong>Pix<strong>FRET</strong></strong> isfreely available on our website (http://www.unil.ch/cig/page16989.html) together with a detailed user’s guide.The <strong>Pix<strong>FRET</strong></strong> <strong>plug</strong>-<strong>in</strong> requires different stacks ofimages: (i) <strong>for</strong> <strong>FRET</strong> <strong>an</strong>alysis, a stack of three imagestaken <strong>in</strong> the <strong>FRET</strong>, Donor, <strong>an</strong>d Acceptor sett<strong>in</strong>gs, (ii)<strong>for</strong> Donor SBT determ<strong>in</strong>ation, a stack of two images ofcells express<strong>in</strong>g the Donor only <strong>an</strong>d taken <strong>in</strong> the <strong>FRET</strong><strong>an</strong>d Donor sett<strong>in</strong>gs, (iii) <strong>for</strong> Acceptor SBT determ<strong>in</strong>ation,a stack of two images of cells express<strong>in</strong>gthe Acceptor only <strong>an</strong>d taken <strong>in</strong> the <strong>FRET</strong> <strong>an</strong>d Acceptorsett<strong>in</strong>gs.When launch<strong>in</strong>g <strong>Pix<strong>FRET</strong></strong>, <strong>an</strong> <strong>in</strong>terface appearswhere all parameters <strong>for</strong> <strong>FRET</strong> <strong>calculation</strong> <strong>an</strong>d displayc<strong>an</strong> be set (Fig. 5). The ‘‘Donor SBT’’ or‘‘Acceptor SBT’’ tabs allow one to evaluate SBTparameters (Fig. 5A). The user is first <strong>in</strong>vited todraw a region outside cells to determ<strong>in</strong>e the background<strong>in</strong> each image of the stack. Then, one or severalregions of <strong>in</strong>terest on the cells have to be drawnto allow <strong>Pix<strong>FRET</strong></strong> to plot SBT ratios as a function offluorophore <strong>in</strong>tensity. <strong>Pix<strong>FRET</strong></strong> then calculates theme<strong>an</strong> SBT, or the parameters correspond<strong>in</strong>g to thel<strong>in</strong>ear or exponential fit of the data. The user c<strong>an</strong>drag a slid<strong>in</strong>g w<strong>in</strong>dow on the plot to def<strong>in</strong>e on whichset of po<strong>in</strong>ts the <strong>calculation</strong> is to be per<strong>for</strong>med <strong>an</strong>dmay then rescale the graph to the selected area byclick<strong>in</strong>g the ‘‘Zoom’’ button. It is also noteworthy thatall parameters, <strong>in</strong>clud<strong>in</strong>g background (BG) values,c<strong>an</strong> be directly entered m<strong>an</strong>ually by the user. Next,the stack with cells express<strong>in</strong>g both the donor <strong>an</strong>dthe acceptor should be opened <strong>an</strong>d backgroundshould be determ<strong>in</strong>ed <strong>in</strong> the <strong>FRET</strong> tab (Fig. 5B) bydraw<strong>in</strong>g a region outside cells. Backgrounds may alsobe modified m<strong>an</strong>ually to adjust the threshold abovewhich N<strong>FRET</strong> is calculated. Indeed, the softwareoperates N<strong>FRET</strong> <strong>calculation</strong> only when (i) the localme<strong>an</strong> pixel value, which is calculated by averag<strong>in</strong>gthe values of the pixel of <strong>in</strong>terest <strong>an</strong>d that of its eightsurround<strong>in</strong>g neighbors, is above the me<strong>an</strong> backgroundof the image <strong>in</strong> all three images, <strong>an</strong>d (ii)when the product of the me<strong>an</strong> pixel values <strong>for</strong> donor<strong>an</strong>d acceptor is above the product of the backgrounds<strong>in</strong> the donor <strong>an</strong>d acceptor images. These conditionswere <strong>in</strong>troduced to discard po<strong>in</strong>ts <strong>in</strong> the backgroundthat preclude the visualization of <strong>FRET</strong> with<strong>in</strong> thecell by generat<strong>in</strong>g aberr<strong>an</strong>tly high <strong>FRET</strong> valuesbecause of normalization. All background values mayalso be ch<strong>an</strong>ged by a common multiplication factorwhich c<strong>an</strong> be specified <strong>in</strong> the ‘‘Threshold CorrectionFactor’’ field. The program also offers the option tofilter the images with a Gaussi<strong>an</strong> blur, the st<strong>an</strong>darddeviation of the blur allow<strong>in</strong>g the user to tune thesmooth<strong>in</strong>g effect. Blurr<strong>in</strong>g notably reduces the noise<strong>an</strong>d improves the result<strong>in</strong>g image by prevent<strong>in</strong>gaberr<strong>an</strong>t <strong>FRET</strong> values <strong>in</strong> the background. F<strong>in</strong>ally,the normalization method has to be selected. Indeed,the <strong>FRET</strong> values <strong>for</strong> each pixel c<strong>an</strong> be divided by thevalue <strong>in</strong> the same pixel of the donor <strong>in</strong>tensity, theacceptor <strong>in</strong>tensity, the product of donor <strong>an</strong>d acceptor<strong>in</strong>tensities, or the square root of the product of donor<strong>an</strong>d acceptor <strong>in</strong>tensities. Click<strong>in</strong>g on the ‘‘Compute<strong>FRET</strong>’’ button will generate the normalized <strong>FRET</strong>images, but also will log all parameters to a textfile which will be reloaded when the <strong>plug</strong>-<strong>in</strong> isrelaunched.<strong>FRET</strong> <strong>an</strong>d N<strong>FRET</strong> are calculated only if pixel values<strong>in</strong> each image are above a given threshold. Otherwisethe value is set to zero <strong>in</strong> the computed image<strong>an</strong>d the pixel is displayed <strong>in</strong> blue <strong>in</strong> order to bettervisualize all the <strong>FRET</strong> values of the image (Fig. 6B).Indeed, even if with<strong>in</strong> a cell the average <strong>FRET</strong> valueis positive, some pixels may have negative values,especially when the <strong>FRET</strong> efficiency is low. S<strong>in</strong>ce theoutput image is displayed with a 256 grayscale lookuptable, the background, which corresponds to avalue of zero, may appear <strong>in</strong> gray (<strong>an</strong>d not black as<strong>in</strong>tuitively expected) if negative pixels are present <strong>in</strong>the image, thereby preclud<strong>in</strong>g a good visual exam<strong>in</strong>a-55